HAL Id: hal-01009094
https://hal.archives-ouvertes.fr/hal-01009094
Submitted on 9 Oct 2020
HAL is a multi-disciplinary open access
archive for the deposit and dissemination of sci-entific research documents, whether they are pub-lished or not. The documents may come from teaching and research institutions in France or abroad, or from public or private research centers.
L’archive ouverte pluridisciplinaire HAL, est destinée au dépôt et à la diffusion de documents scientifiques de niveau recherche, publiés ou non, émanant des établissements d’enseignement et de recherche français ou étrangers, des laboratoires publics ou privés.
Distributed under a Creative Commons Attribution| 4.0 International License
Use of image processing for structural computation
updating during repair works of concrete structures
Emilio Bastidas-Arteaga, E. Leonel, Franck Schoefs, C. Attard, Michel Roche
To cite this version:
Emilio Bastidas-Arteaga, E. Leonel, Franck Schoefs, C. Attard, Michel Roche. Use of image processing for structural computation updating during repair works of concrete structures. Structural Faults and Repair, 2010, Edinburgh, United Kingdom. �hal-01009094�
USE OF IMAGE PROCESSING FOR STRUCTURAL COMPUTATION
UP-DATING DURING REPAIR WORKS OF CONCRETE STRUCTURES
E. Bastidas-Arteaga, E. D. Leonel, F. Schoefs, C. Attard, M. Roche GeM, UMR 6183 - CAPACITES AS, University of Nantes, Centrale Nantes
2, rue de la Houssinière BP 92208, 44322 Nantes Cedex 3,France
emilio.bastidas@gmail.com
KEYWORDS: reinforced concrete, corrosion, chloride penetration, image analysis, cover, reliability. ABSTRACT
In corrosive environments, cover depth is one of the dominant parameters that controls time to corrosion initiation. Consequently, probabilistic modeling of this variable is essential to determine the performance of structures during the time. In this work, we study the influence of cover depth on probability of corrosion initiation. Towards this aim, we compare the effect of the models commonly used in probabilistic modeling with models determined from image analysis. Preliminary results illustrate the importance of accurate characterization of this random variable for a realistic assessment of structural lifetime.
1 INTRODUCTION
The reinforced concrete structures located in non aggressive environments respect the structural life predicted. However, the structural durability can be reduced by degradation processes of environmental and/or functional origin like the penetration of chlorides, the carbonation, fatigue, creep, etc. In this work we focus on the penetration of chloride ions in the concrete which one produces the corrosion of the reinforcements. This process begins when a threshold level of chlorides concentration is reached at the steels of reinforcement. When corrosion begins, the durability of the structure is affected by several phenomena as the reduction of the cross section of the reinforcements, the cracking of the concrete and the loss of adherence between steels and the concrete (Stewart, 2000; Duprat, 2007).
The time of corrosion initiation is the time necessary for the threshold concentration of chlorides reaches the reinforcements. This time depends mainly on the properties of the concrete (coefficient of diffusion, degree of cracking, etc), characteristics of the environment (concentration of chlorides in the surface, temperature, moisture, etc) and the cover as shown in Bastidas-Arteaga et al. (2009). Consequently, the assessment of the initiation time of corrosion is essential to ensure an optimal level of safety throughout structural lifetime. The success of this modeling depends on the level of precision of the adopted model as well as the quality of its data input.
This work studies the influence of the cover depth on the probability of corrosion initiation. Section 2 describes the method of image analysis used to propose our probabilistic models. The stochastic model to simulate the penetration of ions chloride is presented in section 3. Finally, the influence of choice of the depth cover model on the probability of corrosion initiation is studied in section 4.
2 CHARACTERIZATION OF THE DEPTH COVER RANDOMNESS
The cover depth is defined by design codes according to the environmental conditions at which the structure will be exposed (i.e., Eurocode). Several studies show the importance of including the randomness of this variable in the assessment of the structural lifetime. According to Duracrete (2000), the main source of randomness for the cover is related to the quality of construction. Table 1 gathers several models for cover depth used in probabilistic studies on the penetration of chlorides in concrete. It is observed that the most used types of distribution are: lognormal, normal and normal truncated. The mean value is evaluated according to the value specified in the design codes or defined by the specialists. Generally, the mean has a value larger than the value specified in the design. On the other hand, the range of variation of the coefficients of variation COV is very large (between 0.10 and 0.45). This high variability justifies the interest in determining a COV more representative of the reality.
Table 1. Probabilistic models of cover depth
Reference Distribution Mean COV Duracrete, 2000 Log-normal VS 0.30 Vu et Stewart, 2000 Normal tr. in 15 mm VS + 8.6 σ =14.7 mm
Vu, 2003 Normal VS + 3.2mm σ =9.5 mm Val et Stewart, 2003 Normal VS + 6mm σ =11.5 mm
Lounis, 2005 Normal VR 0.45
Duprat, 2007 Log-normal VS 0.10-0.20 Val et Trapper, 2008 Normal tr. à 10 mm VS + 6mm 0.25
Sudret, 2008 Log-normal VS 0.20 Suo et Stewart 2009 Normal VS + 3.2mm σ =9.2 mm VS : Value specified in design code or for specialist.
VR : real value.
This study contributes to the characterization of the cover depth. The data used for this characterization are digital photographs coming from a building site of the Atlantic Port of Nantes St Nazaire (figure 1a). The figure 1a shows the beams used for the data acquisition, where we can observe that the lower part of these beams was demolished by hydrodemolition (water with high pressure). The group IXEAD of the company CAPACITES-University of Nantes, developed Visiodefect®, a numerical tool in Matlab® which makes possible a semi-automatic analysis of images (figure 1b).
Figure 1. (a) Specimens for the data acquisition. (b) Visiodefect.
Few trajectories of values of depth cover c(x,θi) (where θ is the hazard) evaluated using Visiodefect
are presented on figure 2: they represent the evolution of the cover depth along a 1,2 meter long portion of four concrete beams. They have been measured during the repair of the Agri-foodstuffs terminal of the port of Nantes Saint-Nazaire. This terminal is part of the port of Nantes Saint-Nazaire (fourth largest port in France) which is linked to 400 ports worldwide. This wharf was built in 1971 and is located at the west of France (Montoir de Bretagne) in the estuary of the Loire River. Note that the scatter is large (from 30 to 50 mm). However the trajectories µ(x) of the mean value and σ(x) of the standard deviation are stable (see figure 2). The average µ of the mean values of the cover depth is 38.2 with a standard deviation of 1.4, thus the coefficient of variation is only 3.7% when the average σ of the standard deviation values of the cover depth is 5.7 with a standard deviation of 1, thus the coefficient of variation is 18%. This large value comes from the fact that 4 trajectories are not enough from statistical point of view. In further studies, this analysis with be deepened in view to analyze more in detail the random field of cover depth and analyze its second order stationnarity (correlation is a function of the distance between measurements only).
Figure 2. Trajectories of cover depth.
3 PROBABILISTIC MODELING OF THE IONS CHLORIDES PENETRATION Penetration of ions chloride in concrete
Chloride penetration in concrete is controlled by a complex interaction between physical and chemical mechanisms which are often simplified as diffusion phenomenon (second Fick’s law). Many studies use a simplified solution of the Fick’s law which estimates the concentration of chlorides from the complementary error function (Tuutti, 1982). In this classical approach, the diffusion coefficient is constant in time and in space, supposes that the concentration of chlorides in the environment is constant and is only valid for saturated conditions. Thus, this simplified approach does not consider the convection phenomenon which is important in non-saturated environments. Based on the works of Saetta et al (1993) and Martín-Pérez et al (2001), Bastidas-Arteaga et al. (2009) presented a comprehensive model which considers the interaction between three physical phenomena: (i) penetration of chlorides, (ii) diffusion of moisture and (iii) heat transfer. The coupled phenomenon is described by a set of partial differential equations which is solved by combining finite element and finite difference methods. This approach takes into account:
- chloride binding capacity;
- the time-variant nature and the influence of the temperature, moisture and the concentration of chlorides in the environment;
- the reduction of the chloride diffusivity with age and; - the flow of chlorides in unsaturated media.
In this article, we will use this model but we do not detail its formulation. Probability of corrosion initiation
The time of corrosion initiation, tini, is generally evaluated as the time at which the concentration of
chlorides at the cover thickness, ct, is higher than a threshold value, Cth. For this event, the limit state
function is:
( , ) th( ) tc( , , )t
g x t =C x −C x t c [1]
where x is the vector of random variables and Ctc (x; t; Ct ) is the total concentration of chlorides in depth
ct at time t, obtained from the solution of the system of equations that controls chloride penetration. The
evaluation of the limit state function [1] led to the probability of corrosion initiation defined by:
0 20 40 60 80 100 120 140 0 10 20 30 40 50 60 Length [cm] Co v e r th ic k n e s s [ c m ] beam11 beam 12 beam 13 beam 14 mean std 100*CoV
[
]
( ) P ( , ) 0 |
corr
p t = g x t ≤ t [2]
Taking into account the complexity of the system of partial differential equations representing the phenomenon, simulations methods seem most suitable to solve the problem. To reduce the computational time, this study combines Monte Carlo simulations and Latin Hypercube sampling.
4 INFLUENCE ON THE PROBABILITY OF CORROSION INITIATION
The probability of corrosion initiation is evaluated based on the probabilistic models presented in Table 3. The influence of climatic conditions on chlorides penetration is considered taking into account that the structure is placed in an oceanic climate with a temperature varying from 5 to 25 ºC and a relative humidity between 0.6 and 0.8. The stochastic nature of the climatic conditions and the chloride concentration in the environment is integrated into the problem using the methodology presented in Bastidas-Arteaga et al (2009). To model temperature and humidity, a stochastic perturbation is added to a sinusoidal deterministic tendency that represents the seasonal variations, by using a discretization of Karhunen-Loève. As several studies indicate that the concentration of ions chloride in the environment,
Cenv, follows a lognormal distribution, as presented in Vu et al (2000) and Duracrete (2000), our work
adopts a stochastic process generated by independent numbers according to a lognormal law (lognormal noise). The mean to generate this noise is 6 kg/m3 and corresponds to the limit between the high and severe levels of corrosive environment, Weyers (1994). A coefficient of variation of 0.2 is considered. The other assumptions are:
- the isotherm of Langmuir is used to consider chloride binding; the coefficients are αL=0.1185 and
βL=0.09;
- the random variables are independent, do not vary spatially and their characteristics are presented in table 2. The explanation of the choice of the presented values is detailed in Bastidas-Arteaga et al (2009).
Table 2. Random variables
Variable Unit Distribution Mean COV – Reference chloride diffusion
coefficient, Dc,ref m
2/s log-normal 3·10-11 0.20
– Concentration threshold of
corrosion initiation, Cth wt% cim normal 0.48 0.30
– Activation energy of the
chloride diffusion process, Uc kJ/mol
beta sur
[32;44.6] 41.8 0.10 Aging factor, m beta sur [0;1] 0.15 0.30 – Reference humidity diffusion
coefficient, Dh,ref m
2/s log-normal 3·10-10 0.20
– Parameter representing the ratio
Dh,min/Dh,max, α0
beta sur
[0.025;0.1] 0.05 0.20 – Parameter characterizing the
spread of the drop in Dh, n
beta sur
[6;16] 11 0.10 – Thermal conductivity of
concrete, λ W/(m°C) [1.4;3.6] beta sur 2.5 0.20 – Specific heat capacity of
concrete, cq J/(kg°C)
beta sur
[840;1170] 1000 0.10 – Density of concrete, ρc kg/m3 normal 2400 0.20
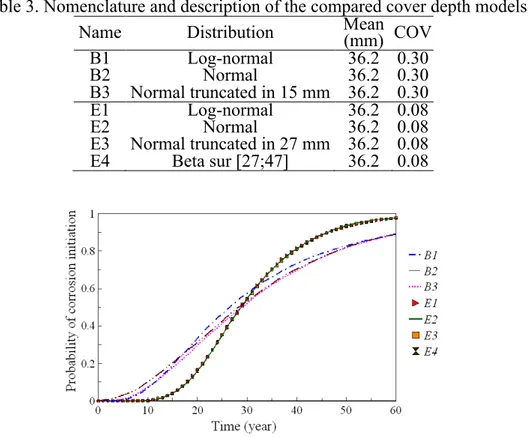
In order to study the influence of the randomness of cover depth on the probability of corrosion initiation, we compare seven models of random variables. The description of these models is presented in Table 3.
This study focuses, initially, on the impact of the type of distribution by comparing the distributions generally used in the literature. We will also study the effect of a Beta distribution limited between the values maximum and minimum measured experimentally. For all cases, the mean value is equal to 36.2 mm which is a conservative value of the one identified from the image analysis (38,2) due to its standard deviation of 1.4 mm. The coefficients of variation for the models B1, B2 and B3 were defined according to the values showed in Table 1. For the models E1, E2, E3 and E4, we use the mean and COV determined in section 2.
The evolution of the probabilities of corrosion initiation for the different models of depth cover is presented in Figure 2. It is obvious that the coefficient of variation of ct influence strongly the
probabilities of corrosion initiation. For the models B1, B2 and B3, we observe that pcorr increases earlier
and progresses with a low rate. The more critical case corresponds to model normal (B2) where the increase begins two years after exposure. This behavior was expected because a normal distribution, with coefficient of variation of 30%, gives small or negative values without any physical sense. The normal truncated or lognormal distributions do not present this type of problems. Moreover, it is noted that the type of distribution does not influence the probability of corrosion initiation when we use the values determined with the image analysis because the COV is small.
Table 3. Nomenclature and description of the compared cover depth models Name Distribution Mean (mm) COV
B1 Log-normal 36.2 0.30 B2 Normal 36.2 0.30 B3 Normal truncated in 15 mm 36.2 0.30 E1 Log-normal 36.2 0.08 E2 Normal 36.2 0.08 E3 Normal truncated in 27 mm 36.2 0.08 E4 Beta sur [27;47] 36.2 0.08
Figure 2. Influence of the depth cover model on the probability of corrosion initiation.
The results presented show the importance of an accurate characterization of the randomness of depth cover. By comparing the models proposed in the literature, we conclude that distributions: normal truncated, lognormal normal and beta can be used to model this random variable. Preferably, we recommend use a beta distribution because it allows us to establish boundaries that follow a physical signification. About the coefficient of variation, we identified coefficients lower than those available in the literature. However, the COV presented in this article is specific to a category of works carried out under determined conditions and cannot be used in all cases. We could imagine, from a regulation point of view, that a construction code may give values grouped in classes. Due the importance of this parameter in the assessment of structural lifetime, we hope to carry out other measurements to complement this study. The measurement of ct by nondestructive methods can also help with the
identification of randomness of this variable. These techniques can also be used as procedure of control of
ct when the construction is completed. We recommend decreasing the COV of the cover depth by
CONCLUSIONS
In this work, we study the influence of the randomness of the cover depth on the probability of corrosion initiation in a structural component. For this study we used a robust model of chloride penetration to compare the probabilistic models obtained from the image analysis with those available in the literature. The results show the importance of the accurate characterization of the randomness of the cover depth for more realistic estimation of structural lifetime.
ACKNOWLEDGEMENTS
The authors acknowledge financial support of the MAREO project and of the European Community and FEDER founds within the duratiNet Interreg (Atlantic space, project N° N°2008-1/049) (duratiNet: Durable Transport Infrastructures in the Atlantic Area) – contact: franck.schoefs@univ-nantes.fr.
REFERENCES
Bastidas-Arteaga E., Chateauneuf A., Sánchez-Silva M., Bressolette P., Schoefs F., «“A comprehensive probabilistic model of chloride ingress in unsaturated concrete”. Submitted to Probabilistic Engineering Mechanics, 2009.
Duprat F., “Reliability of RC beams under chloride-ingress”, Construction and building materials, vol. 21, pp. 1605-1616, 2007.
Duracrete, “Statistical quantification of the variables in the limit state functions”. The European union, BriteEuRam III, contract BRPR-CT95-0132, Project BE95-1347. Report No. BE95-1347/R7, 2000.
Lounis Z., “Uncertainty modeling of chloride contamination and corrosion of concrete bridges”, pp. 491-511, Springer, USA, 2005. Martín-Pérez B., Pantazopoulou S.J., Thomas M.D.A., “Numerical solution of mass transport equations in concrete structures”. Computers
and Structures vol. 79, 2001, p. 1251-1264.
Saetta A.V., Scotta R.V., Vitaliani R.V., “Analysis of chloride diffusion into partially saturated concrete”. ACI Materials Journal, vol. 90, 1993, p. 441-451.
Sudret B., “Probabilistic models for the extent of damage in degrading reinforced concrete structures”, Reliability Engineering and System
Safety, vol. 93, pp. 410-422, 2008.
Suo Q., Stewart M.G., “Corrosion cracking prediction updating of deteriorating RC structures using inspection information”, Reliability
Engineering and System Safety, vol. 94, pp. 1340-1348, 2009.
Tuutti, K. Corrosion of steel in concrete. Swedish Cement and Concrete Institute. 1982.
Val D., Stewart M., “Life-cycle analysis of reinforced concrete structures in marine environments”, Structural safety, vol. 25, pp. 343-362, 2003.
Val D., Trapper P., “Probabilistic evaluation of initiation time of chloride-induced corrosion”, Reliability Engineering and System Safety, vol. 93, pp. 364-372, 2008.
Vu K., Corrosion-induced cracking and spatial time-dependent reliability analysis of reinforced concrete structures, PhD thesis, University of Newcastle, New South Wales, Australia, 2003.
Vu K.A.T., Stewart M.G., “Structural reliability of concrete bridges including improved chloride-induced corrosion models”. Structural
Safety, vol. 22, 2000, pp. 313-333.
Weyers R.E., Concrete Bridge Protection and Rehabilitation: Chemical and Physical Techniques - Service Life Estimates. SHRP-S-668, Strategic Highway Research Program, National Research Council. 1994.
View publication stats View publication stats