HAL Id: hal-00983146
https://hal.archives-ouvertes.fr/hal-00983146
Submitted on 6 Jun 2014
HAL is a multi-disciplinary open access
archive for the deposit and dissemination of
sci-entific research documents, whether they are
pub-lished or not. The documents may come from
teaching and research institutions in France or
abroad, or from public or private research centers.
L’archive ouverte pluridisciplinaire HAL, est
destinée au dépôt et à la diffusion de documents
scientifiques de niveau recherche, publiés ou non,
émanant des établissements d’enseignement et de
recherche français ou étrangers, des laboratoires
publics ou privés.
Absorption and Fluorescence Signatures of
1,2,3-Triazole Based Regioisomers : Challenging
Compounds for TD-DFT
Claudine Katan, Paul Savel, Bryan Wong, Thierry Roisnel, Vincent Dorcet,
Jean-Luc Fillaut, Denis Jacquemin
To cite this version:
Claudine Katan, Paul Savel, Bryan Wong, Thierry Roisnel, Vincent Dorcet, et al.. Absorption and
Fluorescence Signatures of 1,2,3-Triazole Based Regioisomers : Challenging Compounds for TD-DFT.
Physical Chemistry Chemical Physics, Royal Society of Chemistry, 2014, 16 (19), pp.9064-9073.
�10.1039/C4CP00478G�. �hal-00983146�
Absorption and Fluorescence Signatures of 1,2,3-Triazole Based
Re-gioisomers : Challenging Compounds for TD-DFT
†
Claudine Katan
∗a, Paul Savel
a, Bryan M. Wong
b, Thierry Roisnel
a, Vincent Dorcet
a, Jean-Luc
Fillaut
a, and Denis Jacquemin
∗c,dReceived Xth XXXXXXXXXX 20XX, Accepted Xth XXXXXXXXX 20XX First published on the web Xth XXXXXXXXXX 200X
DOI: 10.1039/b000000x
In the continuous quest for improving TD-DFT methodologies as a tool to predict the photophysical features of solvated chro-mophores, we herein investigate two model regioisomers based on the 1,2,3-triazole moiety. Starting from their experimental absorption and emission spectra, key energy differences highlighting the main trends between the two isomers are extracted and used to gauge the accuracy of several levels of theory. RI-CC2 and EOM-CCSD calculations allow us to ascertain that the low energy spectra is not linked to double excitations. In vacuum, neither these methods nor any of the implemented TD-DFT levels of theory, ranging from global hybrids (PBE0, B3LYP) to range-separated functionals without (CAM-B3LYP,ωB97X) or with dispersion corrections (ωB97X-D), is able to capture the key features that differentiate the two chromophores. Accounting for solvent within a specific PCM model allows to recover experimental trends, but the dramatic changes occurring when moving from toluene to THF and/or for different PCM approaches (LR, cLR, SS) suggest that this agreement is probably fortuitous. Even so theωB97X-D functional combined to the SS-PCM scheme leads to quantitative agreement with experiment, TD-DFT results obtained for 1,2,3-triazole based chromophores need to be treated with caution. We also show that the SS-PCM approach may be useful to test current and novel exchange-correlation functionals against the charge transfer failure.
1
Introduction
The computation of accurate excitation energies of medium and large organic molecules has been at the centre of contin-uous attention from the Time Dependent Density Functional Theory (TD-DFT) community.1–3 In the past decade, TD-DFT has shown to be an economical yet pretty accurate tool for simulating the excited-states (ES) of chromophores. Be-sides the widespread applications afforded by organic and in-organic luminophores, we underline that three methodologi-cal breakthroughs have clearly boosted TD-DFT’s popularity. First, the development and implementation of new exchange-correlation functionals, e.g., range-separated hybrids,4–7 dis-persion corrected functionals,8–11and double hybrid function-als12–14allowed to overcome well-known pitfalls of
conven-a CNRS, Institut des Sciences Chimiques de Rennes, UMR6226-CNRS-Universit´e de Rennes 1, 35042 Rennes Cedex, France. Tel: +33-2-23-23-52-86. E-mail: claudine.katan@univ-rennes1.fr
bDrexel University, Department of Chemistry, Department of Materials Sci-ence & Engineering, Philadelphia, PA 19104, USA
cCEISAM, UMR CNRS 6230, BP 92208, Universit´e de Nantes, 2, Rue de la Houssini`ere, 44322 Nantes, Cedex 3, France. Tel: +33-2-51-12-55-64 d Institut Universitaire de France, 103 bd St Michel, 75005 Paris Cedex 5, France. E-mail: Denis.Jacquemin@univ-nantes.fr.
†Electronic Supplementary Information (ESI) available: (1) Synthesis (2) Structural data (3) Absorption and emission (4) Calculated maximum of the first absorption band (5) Additional Natural transition orbitals. See DOI: 10.1039/b000000x/
tional DFT kernels that is the appearance of spurious charge transfer states,15–17the inability to describe weak-interactions and the simulation of doubly excited-states,18 respectively. The possibility to compute vibrationally resolved optical spec-tra19–23stands as a second important progress as it allows, at least, to capture the band asymmetries if the underlying multi-peak structure of the gas phase spectra becomes smeared out by inhomogeneous broadening in solution. As steady-state op-tical spectroscopy in solution is routinely used to characterise organic chromophores, the importance of properly accounting for solvent effects at the TD-DFT level is obvious. Signifi-cant improvements have recently been achieved in this frame-work, especially within the well-known polarisable continuum model (PCM).24,25When combining PCM with TD-DFT, two points need to be clarified: on the one hand, the relative speed of the process, and, on the other hand, the polarisation of the ES cavity. Depending on the time scale of interest, the solvent polarisation can be either fully equilibrated with the electronic configuration of the solute (equilibrium) or solely for its fast degrees of freedom (non-equilibrium approach),26,27the for-mer (latter) being adequate for slow (fast) processes. It is also possible to correct the standard linear response (LR) excitation energies by introducing state specific solvent responses that model the impact of the change of states of the chromophores on the polarisation of the solute-solvent border considering the actual dipole of the excited-state. This can be done
ei-ther within a perturbative scheme, namely the corrected LR scheme (cLR),26,28or self-consistently using the state-specific scheme (SS)27,29or the vertical excitation model (VEM).30–32 Despite these developments, including large benchmarking, there is still need for further investigations in the quest of de-signing theoretical schemes able to accurately predict spectro-scopic data as some unexpected failures of TD-DFT can still be found, and we tackle such problem in the present contribu-tion. Among the most simple test examples one can
imag-N N N NMe2 N N N NMe2 da dai
Fig. 1Molecular structures of 1,2,3-triazole based model chromophores: da (left) and the corresponding dai position isomer (right).
ine, regio-isomers (position isomers) of chromophores are good candidates for TD-DFT assessment due to their chem-ical similarity. 1,2,3-triazole based regio-isomers have re-cently been suggested as a kind of tutorial example to test novel exchange-correlation kernels.33 Indeed, while the ab-sorption features of one of the isomers showed to be quali-tatively well described when using the B3LYP global hybrid functional,34,35the same level of theory was deficient for its isomeric counterpart.33At the same time, triazole chemistry has gained renewed interest as it allows for click chemistry re-actions, making triazole-based molecules interesting beyond an academic viewpoint.36Indeed, with four attachment points, 1,2,3-triazole paves the way to different regio-isomers of var-ious sizes and shapes, ranging from small push-pull chro-mophores33,37–43 to polymers and branched molecular archi-tectures.33,41–47 These molecular compounds have shown di-verse optical responses. For example, position isomerism has been demonstrated to dramatically change absorption fea-tures of push-pull chromophores38,39 and ligation of triazole on coumarins has been reported to increase their fluorescence quantum yield by more than an order of magnitude.37Triazole based multipolar structures have also been reported to develop large nonlinear optical responses, in particular for electro-optic activity and two-photon absorption.33,42–48 Moreover, triazole is recognised as a versatile chemical moiety, able to act either as an electron donor37 or acceptor,36,42,44 as well as an active π-linker38,39 or as a site-isolation moiety,45–47 while affording metal ligation in some cases.40This prompts the need for theoretical methodologies able to provide an ac-curate description of their ES structure or, at least, chemically sounded.
In that framework, we investigate here the photophysical properties of two model regio-isomers based on the
1,2,3-triazole moiety (Figure 1), labelled da and dai. The moti-vation for choosing these two specific regio-isomers are two-fold. First, comparison of experimental photophysical data and TD-B3LYP results of multi-branched analogues of these two specific chromophores (e.g., quadrupoles 2da and 2dai obtained by gathering respectively two da and dai units in a head-to-tail architecture) was already available. It revealed that TD-B3LYP results fit nicely for dai analogues43, but fail for da analogues33, with large overestimation of both the oscillator strength ratio and the band splitting between the two-first absorption bands. Next, working with dipoles instead of quadrupoles, or even larger multi-branched chro-mophores, reduces considerably the computational cost, thus allowing implementation of higher levels of theory. To en-sure relevant comparison with experimental data, the chro-mophores have been synthesised, crystallised and their flu-orescence and absorption spectra were measured in both dichloromethane (DCM) and tetrahydrofuran (THF). From the theoretical point of view, we used several quantum chemi-cal approaches. Among those, ab initio RI-CC2 and EOM-CCSD allowed to assess the importance of double excita-tions in the low-energy spectra. TD-DFT calculaexcita-tions are per-formed with different approximations, first in vacuum, next for solvated chromophores using the LR-, cLR- and SS-PCM methods (see above) combined with a panel of exchange-correlation functionals including both global (B3LYP35 and PBE049,50) and range-separated (LC-BLYP,4CAM-B3LYP,6 ωB97X-D9) hybrids. After the Section devoted to computa-tional and experimental details, we discuss molecular geome-tries. Next, we present the experimental phosophysical prop-erties and extract relevant information for comparisons with theoretical results. Then, we successively inspect the ES prop-erties related to absorption, emission, 0-0 energy and Stokes shift.
2
Methodology
2.1 Computations
We employed a blend of ab initio approaches to model the two chromophores of interest. A locally modified version of GAMESS was used to carry out TD-DFT calculations with both the LC-BLYP4(ω= 0.3) and B3LYP35functionals us-ing the same convergence criteria described in a previous study.51,52 The TURBOMOLE code was used to carry out wave-function based RI-CC2 calculations. These gas phase calculations relied on the SVP basis set and used geometries optimised in an earlier work at the HF/6-31G level.33 All other computations were performed with the latest version of the Gaussian09 package (D.01 revision),53using default algo-rithms except when noted. Ground and excited state geome-tries, subsequent excited state structures were computed with
Table 1Selected structural data of da and dai: the rings are labeled A, B and C from left to right. Distances are given in ˚A and angles in degrees. All calculations in gas phase with 6-31+G(d) but for HF (6-31G). Additional data is available as ESI.
N N8 N9 NMe2 da A C B N8 N9 N NMe2 dai A B C
X-Ray HF PBE0 CAM-B3LYP ωB97X ωB97X-D X-Ray HF PBE0 CAM-B3LYP ωB97X ωB97X-D N8=N9 1.319 1.281 1.292 1.293 1.292 1.294 1.314 1.283 1.294 1.295 1.294 1.296 A-B 1.434 1.416 1.414 1.420 1.423 1.420 1.472 1.465 1.464 1.469 1.473 1.470 B-C 1.468 1.462 1.461 1.466 1.470 1.467 1.430 1.419 1.416 1.422 1.425 1. 422 ˆ AB 18/21 31 26 29 30 31 18 1 1 0 6 9 ˆ BC 16/23 2 4 3 8 11 28 42 33 37 37 38
different functionals: PBE049,50, CAM-B3LYP6, ωB97X7 andωB97X-D9, employing the 6-31+G(d) atomic basis54,55. Additional EOM-CCSD calculations were performed using the 6-31G(d) atomic basis in vacuum. All geometries reported here correspond to true minima of the potential energy surface with absence of imaginary frequencies and correspond to a so-called tight optimisation with residual mean forces smaller than 0.00001 a.u.
Solvent effects were modeled thanks to the PCM ap-proach25 as it provides an accurate description of solvation effects as long as no specific interactions come into play. The three different PCM approaches implemented in Gaussian09 have been applied, namely LR, cLR and SS schemes (see In-troduction). Within the LR model the PCM reaction field has a contribution which is related to the ground to excited state transition density rather than to the change in electron density upon excitation. This can be corrected with more advanced schemes either pertubatively (cLR) or self-consistently (SS), but at the prize of an increased computational effort, espe-cially in the SS model. As stated in the introduction, slow (fast) processes should be described in an equilibrium (non-equilibrium) limit irrespective of the selection of LR, cLR or SS schemes. Therefore, geometry optimisations and adia-batic transition energies correspond to the equilibrium regime, whereas vertical transition energies do not, as they require the equilibrium limit for the initial state and the non-equilibrium one for the final state. Furthermore, to accurately compute the crossing point of fluorescence and absorption bands, known as the experimental 0-0 reference (E00), the equilibrium adi-abatic energies should be corrected for both zero-point vibra-tional energy (ZPVE) and non-equilibrium effects. We redi-rect the interested reader to Ref. 56 for details of the selected procedure.
2.2 Synthesis
N,N-dimethyl-4-(1-phenyl-1H-1,2,3-triazol-4-yl)aniline (da) and N,N-dimethyl-4-(4-phenyl-1H-1,2,3-triazol-1-yl)aniline
(dai) were prepared in good yields (69 and 72% respectively) according to the procedure inspired from earlier work by V. V. Fokin and co-workers57and described in details in the ESI.
2.3 Crystal structures
Both da and dai crystals : (C16H16N4); M = 264.33. APEXII, Bruker-AXS diffractometer, Mo-Kα radiation (λ = 0.71073
˚
A), T = 150(2) K; da is triclinic P-1 (I.T.#2), a = 5.8977(6), b = 7.4177(7), c = 30.865(3) ˚A,α = 91.949(4), β = 92.578(5), γ = 94.343(4)◦, V = 1344.1(2) ˚A3, Z = 4, d = 1.306 g.cm−3, µ = 0.081 mm−1; dai is monoclinic P21/n (I.T.#14), a = 5.7857(5), b = 16.921(2), c = 13.7060(17) , β = 98.453(4)◦, V = 1327.2(3) 3, Z = 4, d = 1.323 g.cm−3, µ = 0.082 mm−1. The structures were solved by direct methods using the SIR97 program,58and then refined with full-matrix least-square methods based on F2(SHELXL-97)59 with the aid of the WINGX program.60All non-hydrogen atoms were refined with anisotropic atomic displacement parameters. H atoms were finally included in their calculated positions. A final re-finement on F2with 6089 unique intensities and 365 param-eters converged atωR(F2) = 0.139 (R(F) = 0.0589) for 4195 observed reflections with I>2σ (I) for the da crystal. For dai, refinement on F2with 3038 unique intensities and 183 param-eters converged atωR(F2) = 0.1065 (R(F) = 0.0444) for 2515 observed reflections with I>2σ (I).
2.4 Optical measurements
UV/Vis absorption spectra were recorded on a Jasco V-570 instrument. Steady-state fluorescence spectra were recorded on a Edinburgh FLS920 instrument. Measurements were performed at room temperature using freshly-prepared air-equilibrated dilute solutions (ca. 10−6 M, optical density < 0.1) contained in standard 1 cm quartz cuvettes. Emis-sion spectra were obtained by exciting samples at the wave-length of the absorption maximum. Fluorescence quantum yields were measured according to literature procedures us-ing fluorescein in 0.1 N NaOH as a standard (quantum yield
φ= 0.90).
3
Results and discussion
3.1 Ground and excited state molecular geometries The ground state geometries obtained from X-Ray diffrac-tion and calculated optimized geometries lead to non-planar molecular conformations for both regio-isomers (Table 1). Experimental conformations show sizeable dihedral angles on both sides of the triazole ring (Figure 2). The DFT structures are in overall good agreement with experiment, though one notices a systematically too small diazo distance (ca. 0.02
˚
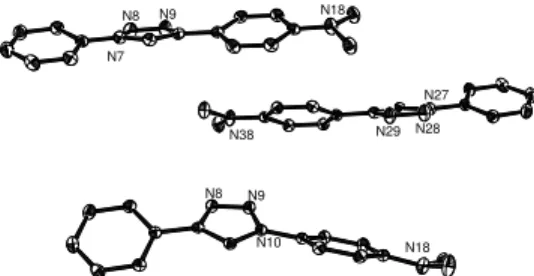
A), a previously reported trend.61The length of the interring bonds is estimated accurately by all theoretical levels. The di-hedral angles obtained after geometry optimisation more sig-nificantly depend on the level of theory in use but test cal-culations revealed that this has an only small impact on the estimated optical properties (vide infra). They are systemati-cally larger for the ring connected to the nitrogen atom of the triazole ring. Given the fact that solid-state packing effects might significantly tune the dihedral angles, it is not straight-forward to pinpoint a preferred level of theory from the data listed in Table 1. We have also investigated solvent effects (Ta-ble 2), considering only theωB97X-D functional. By compar-ing the gas phase and THF data for the ground-state structure, one notices that solvation induces a small elongation of the di-azo bonds, and slight increase of the dihedral angles. Let us now turn towards the first excited-state. While, ground state of both regio-isomers showed benzene rings with a clear aro-matic character and a slightly quinoidal nature for rings A and C (Figure 1), the quinoidal character increases in the excited-states and becomes very significant for ring C. Concomitant decreases of inter-ring bond lengths, with a larger effect for the one involving the nitrogen atom of the triazole ring, and pla-narisation of the geometries are observed when moving to the electronically excited-state. Such a phenomenon is quite com-mon for chromophores having low dipolar character in their ground state. N7 N8 N9 N18 N38 N29 N28 N27 N8 N9 N10 N18
Fig. 2ORTEP representation of the crystal structures of da (two molecules on top) and dai (molecule at bottom).
Table 2Comparison between ground and (first bright) excited states ω-B97X-D/6-31+G(d) geometrical parameters computed in THF with the PCM model. See Table 1 for more details.
da dai GS ES GS ES N8=N9 1.299 1.277 1.301 1.303 A-B 1.424 1.379 1.471 1.460 B-C 1.467 1.409 1.425 1.343 ˆ AB 37 4 13 0 ˆ BC 16 1 45 0
3.2 Experimental optical spectra
UV/Vis and fluorescence spectra of da and dai measured in both THF and DCM are shown Figure 3. Consistently with earlier findings on related chromophores,41,42both regio-isomers have an intense absorption band in the near UV region and display a strong photoluminescence in the violet part of the visible spectrum. In THF, the absorption extinction co-efficients attain 27000 and 21000 cm−1.mol−1.L whereas the fluorescence quantum yields amount to 0.87 and 0.18, for da and dai, respectively. da absorption and emission spectra are clearly not mirror images of each other (See in the ESI). This hints that at least one low-lying ES with significantly smaller oscillator strength than the higher lying state at the origin of the main absorption band is present. A crude deconvolution leads to an energy splitting between these two states of ca. 0.3–0.5 eV range (See in the ESI).
Table 3Experimental photophysical data of the two dyes in eV. ωabs
maxcorresponds to the position of the maximum of the first
absorption band, FWHM to its full width at half maximum, ∆ωabsto an estimate of the energy shift between the first bright excited state and the first excited state (ESmax-ES1),ωmaxem to the position of the
maximum of the emission band, E00to the crossing point of the absorption and emission bands and ∆SSto the Stokes shift.δ are the
energy shifts between da and dai, labelled (from top to bottom): δ(ωabs
max), δ (∆ωabs), δ (ωmaxem), δ (E00) and δ (∆SS).
DCM THF da dai δ da dai δ ωabs max 4.18 4.08 +0.1 4.22 4.10 +0.1 FWHM 0.7 ≥0.9 0.7 ≥0.9 ∆ωabs 0.3 ≤0.1 +[0.2,0.4] 0.4 ≤0.1 +[0.3,0.5] ωem max 2.81 3.07 −0.3 2.83 3.10 −0.3 FWHM 0.52 0.54 0.51 0.56 E00 3.30 3.51 −0.2 3.30 3.55 −0.3 ∆SS 1.37 1.01 +0.4 1.39 1.00 +0.4
On the contrary, absorption and emission of dai are close to be mirror images. In this case, would the first ES be a (nearly) dark state, the splitting with the bright state would be much smaller than in da. Both regio-isomers have higher lying ES
Table 4Calculated photophysical data (eV) in gas phase. Excited state number is given in ket notation and ∆ωabsandδ have been defined in the caption of Table 3. In the rightmost column,δ(ωabs
max) and δ (∆ωabs) are given for each method. δ (ωmaxabs) are derived from convoluted
gaussians with experimental FWHM (0.5 eV) when the two bright states relevant for absorption are close in energy. Relevant experimental values in THF are also shown to facilitate comparison.
da dai
Method |ii ωi( fi) |ii ωi( fi) ∆ωabs |ii ωi( fi) |ii ωi( fi) ∆ωabs δ(ωmaxabs) δ(∆ωabs)
EOM-CCSD/6-31G(d)a |1i 4.67 (0.07) |2i 5.03 (0.99) 0.36 |1i 4.71 (0.03) |3i 5.22 (0.95) 0.51 -0.19 -0.15
RI-CC2/SVPb |1i 4.43 (0.21) |2i 4.70 (0.78) 0.27 |1i 4.51 (0.04) |2i 4.93 (1.01) 0.42 -0.27 -0.15
LC-BLYP/SVPb |1i 4.59 (0.23) |2i 4.82 (0.86) 0.23 |1i 4.66 (0.04) |2i 5.01 (1.07) 0.35 -0.23 -0.12
ωB97X-D/SVPb |1i 4.56 (0.35) |2i 4.79 (0.65) 0.23 |1i 4.69 (0.04) |2i 4.96 (1.05) 0.27 -0.24 -0.04
ωB97X-D/6-31G(d)b |1i 4.64 (0.44) |2i 4.85 (0.58) 0.21 |1i 4.78 (0.04) |2i 5.00 (1.07) 0.22 -0.24 -0.01
ωB97X-D/6-31+G(d)b |1i 4.45 (0.31) |2i 4.72 (0.61) 0.27 |1i 4.63 (0.05) |2i 4.87 (0.96) 0.24 -0.22 +0.03
ωB97X-D/6-31+G(d)c |1i 4.48 (0.33) |2i 4.72 (0.56) 0.24 |1i 4.62 (0.04) |2i 4.81 (0.94) 0.19 -0.17 +0.05
CAM-B3LYP/6-31+G(d)a |1i 4.35 (0.38) |2i 4.68 (0.41) 0.33 |1i 4.61 (0.07) |2i 4.72 (0.85) 0.11 -0.18 +0.22
B3LYP/SVPb |1i 3.60 (0.18) |4i 4.61 (0.84) 1.01 |1i 4.30 (0.57) |5i 5.01 (0.19) 0.00 +0.31 +1.01
PBE0/6-31+G(d)a |1i 3.71 (0.19) |4i 4.57 (0.52) 0.86 |1i 4.30 (0.62) |2i 4.41 (0.09) 0.00 +0.26 +0.86
Experiment (THF) ωabs
max= 4.22 [0.3,0.5] ωmaxabs= 4.10 ≤0.1 +0.12 [0.2,0.5] aCAM-B3LYP geometry bHF geometry cωB97X-D geometry 3 4 5
ω
(eV) intensity (a.u.) DCM THF 3 4 5ω
(eV) intensity (a.u.) DCM THFFig. 3Normalised fluorescence (left) and absorption (right) spectra of da (top) dai (bottom) in DCM (straight lines) and THF (dotted lines).
with significant oscillator strength leading to an increase of the absorption intensity near 5.1 eV. Unfortunately, the
exis-tence of several ES with significant oscillator strength hinders straightforward deconvolution of the spectra (see in the ESI). Nevertheless, to highlight the main trends, different energies and energy differences (δ , corresponding to energy shifts be-tween da and dai) have been extracted from the spectra and are summarised Table 3. ∆ωabscorresponds to an estimate of the energy shift between the first bright excited state (ESmax) and the first excited state (ES1). These energy shifts reveal clear trends between the two isomers. Indeed, bothδabs
max and δ(∆ωabs) are positive with a larger value for the latter, ev-idencing a clear separation between the first and the bright ES of da. On the contrary,δ(ωem
max) are negative indicating a larger stabilisation of the relaxed ES in da than in dai for both solvents. This also shows up through larger Stokes shifts for the former dye and consequently positive values for δ(∆SS). These different behaviours in absorption and emission also yield redshifted crossing points (E00) for da and therefore neg-ativeδ(E00).
3.3 Modelled absorption
In order to make a direct comparison with gas phase TD-DFT results, we have carried out simulations with both RI-CC2 and EOM-CCSD wavefunction approaches (see Table 4). We un-derline that these methods indicate that none of the four first excited-states of both dyes presents a significant weight for double excitations. Overall, the TD-DFT and wavefunction results provide the same general qualitative trends, though the TD results are, of course, sensitive to the selected exchange-correlation functional. The agreement with the experimental data reported in Table 3 looks reasonable for da: the split-ting between the first and bright state, ∆ωabs, is well
repro-Table 5Natural transition orbitals62of da and dai calculated in gas phase highlighting the appearance of low-lying charge-transfer states for dawhen using global hybrids (PBE0 for instance). Panels quote excited state number, associated eigenvalue, transition energy and oscillator strength. Geometries are optimized at the CAM-B3LYP/6-31+G(d) level and TD calculations use the 6-31+G(d) basis set. Orbitals were plotted using XCrySDen63.
da da
hole electron hole electron
|1i w=0.99, ω01=3.71, f01=0.19 w=0.98, ω01=4.30, f01=0.62 PBE0 |2i w=0.99, ω02=4.26, f02=0.04 w=0.93, ω02=4.41, f02=0.09 |1i w=0.95, ω01=4.35, f01=0.38 w=0.91, ω01=4.61, f01=0.07 CAM-B3LYP |2i w=0.90, ω02=4.68, f02=0.41 w=0.89, ω02=4.72, f02=0.85
duced and relatively constant for all techniques, only B3LYP and PBE0 giving unreasonably large values. These two func-tionals also show the appearance of low-lying charge transfer states as illustrated Table 5. On the contrary, the ∆ωabs of daiis often too large compared to experiment, especially for the two coupled-cluster schemes, and this yields an incorrect negative sign for δ(∆ωabs) for the wavefunction approaches as well as for LC-BLYP. ωB97X-D improves the ∆ωabs of daiand the results of this functional highlight that increasing the size of the atomic basis set has only a small impact on the respective positions of the maximum of the first absorp-tion bands of the two compounds though it slightly improves their respective excited state splittings: δ(∆ωabs) becomes correctly positive for the diffuse containing basis set. We also note from theωB97X-D results that the selected ground-state geometry has a trifling influence on the results. CAM-B3LYP provides a rather accurateδ(∆ωabs) but at the price of a too large f for the first excited state of da and a wrong sign for δ(ωmaxabs). The two global hybrids recover the correct sign for this parameter, but as stated above, at the expense of a wrong description for da. In short, none of the gas phase results is able to capture the key experimental features differing be-tween da from dai and we have therefore turned our attention to solvent effects.
Transition energies and corresponding oscillator strengths
relevant for absorption (vertical approximation) have been cal-culated within the non-equilibrium regime and are reported Table 6 for four different functionals and three different sol-vents. Interestingly, the data obtained for dai are quite insen-sitive to the solvent (toluene, THF or DCM) and this holds for the three PCM model (LR, cLR or SS). This vastly contrasts with da for which large variations of the relative oscillator strengths of the two first excited states take place, especially with PBE0. As the two states are quite well separated with PBE0 (at least with LR and cLR), this result is puzzling as normally intensity borrowing takes only place between states that are closer on the energetic scale. This leads to drastic sol-vent effects with PBE0, e.g., the LR-PBE0 ∆ωabsgoes from 0.00 to 0.62 when shifting from toluene to THF, and this con-sequently reflects in the sign change ofδ(ωabs
max) characteriz-ing the two systems. Whilst, this brcharacteriz-ings the LR-PCM PBE0 results in quite good agreement with experimental absorption spectra in THF, such radical variations are probably calcula-tion artifacts. Impressively, while the cLR-LR difference are already sizable with PBE0, the SS-LR shift appears unrealisti-cally large. Indeed, the cLR correction to the transition energy of the first ES of da amounts to more then 0.3 eV whereas the SS corrections lead to huge shifts and dramatic decrease of oscillator strengths for both compounds. This reveals appear-ance of low lying spurious charge transfer states and makes the
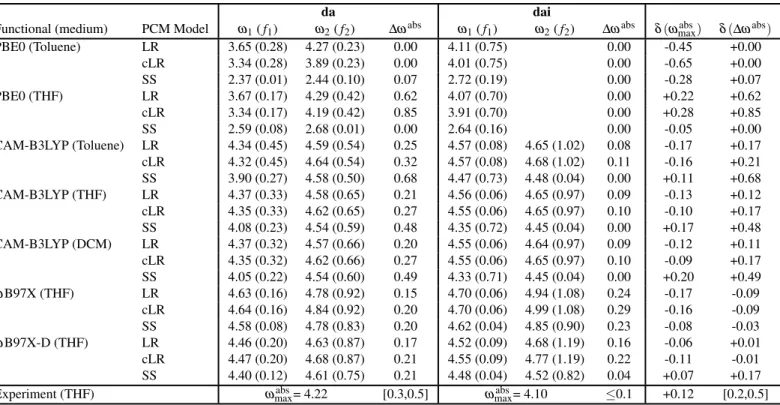
Table 6Calculated photophysical data using the continuum PCM model in its non-equilibrium limits. All data used the 6-31+G(d) atomic basis set and the geometries are optimized at the same level of theory as the one used for the TD-DFT part. See caption of Table 4 for more details. Relevant experimental values in THF are also shown to facilitate comparison.
da dai
Functional (medium) PCM Model ω1( f1) ω2( f2) ∆ωabs ω1( f1) ω2( f2) ∆ωabs δ(ωmaxabs) δ(∆ωabs)
PBE0 (Toluene) LR 3.65 (0.28) 4.27 (0.23) 0.00 4.11 (0.75) 0.00 -0.45 +0.00 cLR 3.34 (0.28) 3.89 (0.23) 0.00 4.01 (0.75) 0.00 -0.65 +0.00 SS 2.37 (0.01) 2.44 (0.10) 0.07 2.72 (0.19) 0.00 -0.28 +0.07 PBE0 (THF) LR 3.67 (0.17) 4.29 (0.42) 0.62 4.07 (0.70) 0.00 +0.22 +0.62 cLR 3.34 (0.17) 4.19 (0.42) 0.85 3.91 (0.70) 0.00 +0.28 +0.85 SS 2.59 (0.08) 2.68 (0.01) 0.00 2.64 (0.16) 0.00 -0.05 +0.00 CAM-B3LYP (Toluene) LR 4.34 (0.45) 4.59 (0.54) 0.25 4.57 (0.08) 4.65 (1.02) 0.08 -0.17 +0.17 cLR 4.32 (0.45) 4.64 (0.54) 0.32 4.57 (0.08) 4.68 (1.02) 0.11 -0.16 +0.21 SS 3.90 (0.27) 4.58 (0.50) 0.68 4.47 (0.73) 4.48 (0.04) 0.00 +0.11 +0.68 CAM-B3LYP (THF) LR 4.37 (0.33) 4.58 (0.65) 0.21 4.56 (0.06) 4.65 (0.97) 0.09 -0.13 +0.12 cLR 4.35 (0.33) 4.62 (0.65) 0.27 4.55 (0.06) 4.65 (0.97) 0.10 -0.10 +0.17 SS 4.08 (0.23) 4.54 (0.59) 0.48 4.35 (0.72) 4.45 (0.04) 0.00 +0.17 +0.48 CAM-B3LYP (DCM) LR 4.37 (0.32) 4.57 (0.66) 0.20 4.55 (0.06) 4.64 (0.97) 0.09 -0.12 +0.11 cLR 4.35 (0.32) 4.62 (0.66) 0.27 4.55 (0.06) 4.65 (0.97) 0.10 -0.09 +0.17 SS 4.05 (0.22) 4.54 (0.60) 0.49 4.33 (0.71) 4.45 (0.04) 0.00 +0.20 +0.49 ωB97X (THF) LR 4.63 (0.16) 4.78 (0.92) 0.15 4.70 (0.06) 4.94 (1.08) 0.24 -0.17 -0.09 cLR 4.64 (0.16) 4.84 (0.92) 0.20 4.70 (0.06) 4.99 (1.08) 0.29 -0.16 -0.09 SS 4.58 (0.08) 4.78 (0.83) 0.20 4.62 (0.04) 4.85 (0.90) 0.23 -0.08 -0.03 ωB97X-D (THF) LR 4.46 (0.20) 4.63 (0.87) 0.17 4.52 (0.09) 4.68 (1.19) 0.16 -0.06 +0.01 cLR 4.47 (0.20) 4.68 (0.87) 0.21 4.55 (0.09) 4.77 (1.19) 0.22 -0.11 -0.01 SS 4.40 (0.12) 4.61 (0.75) 0.21 4.48 (0.04) 4.52 (0.82) 0.04 +0.07 +0.17 Experiment (THF) ωabs
max= 4.22 [0.3,0.5] ωmaxabs= 4.10 ≤0.1 +0.12 [0.2,0.5]
SS-PCM PBE0 values completely off (experimental) target.
With CAM-B3LYP and the LR-PCM model, all three sol-vents provide comparable energy shifts. With CAM-B3LYP, the cLR correction remains moderate, if not negligible, while SS corrections are significant for both regioisomers, ranging from 0.2 to 0.4 eV. At the SS-CAM-B3LYP level of theory, the oscillator strength ratio of the first two ES of da improves compared to LR-CAM-B3LYP but at the expense of an in-creased energy splitting between the two states. For dai, SS corrections induce a larger stabilization for the bright excited state for all three solvent, the first states becoming the bright-est. Consequently, the SS-PCM CAM-B3LYP energy shifts are in qualitatively satisfying agreement with the reference data, though the δ(∆ωabs) is slightly overestimated. Both Head-Gordon’s range-separated hybrids, namelyωB97X and ωB97X-D, give similar results, that is comparable energies and oscillator strengths with the three solvation models. More-over, both cLR and SS corrections remain small (≤0.15 eV). Subsequently, in contrast with the CAM-B3LYP situation, no inversion of the nature of the two first excited states is found for dai. As can be seen in Table 6 the best agreement with experiment for bothδ(ωmax) and δ (∆ωabs abs) is obtained with a method combiningωB97X-D and SS-PCM.
3.4 Emission
Vertical fluorescence energies and oscillator strengths are listed in Table 7 for geometries optimized for the lowest ly-ing excited-states, followly-ing Kasha’s rule. These optimiza-tions have been performed in the equilibrium limit of the PCM model. At the LR-PCM level, only PBE0 restores the correct trend forδ(ωem
max) with little differences between toluene and THF. However, the LR model is known to be rarely the most suited for emission properties. The SS-PCM PBE0 fluores-cence energies are completely off the experimental value, as already noted for the absorption. Indeed, for da, PBE0 tran-sition energies decrease by 1 and 2 eV for toluene and THF, respectively, and the oscillator strengths are reduced by a fac-tor of ca. 2. For dai, while corrections introduced by the SS scheme remain modest in toluene, they become huge in THF and attain about the same amplitude as for da. These dramatic effects reveal that combining the SS-PCM model to the PBE0 functional is inadequate in the present case.
With CAM-B3LYP, the SS corrections are more reasonable for dai in all solvents. On the other hand, for da transition energies and oscillator strengths are markedly reduced by SS corrections in polar medium. In toluene, the changes stay within a reasonable range and theδ(ωem
max) at the SS-CAM-B3LYP coincide nicely with the experimental value.
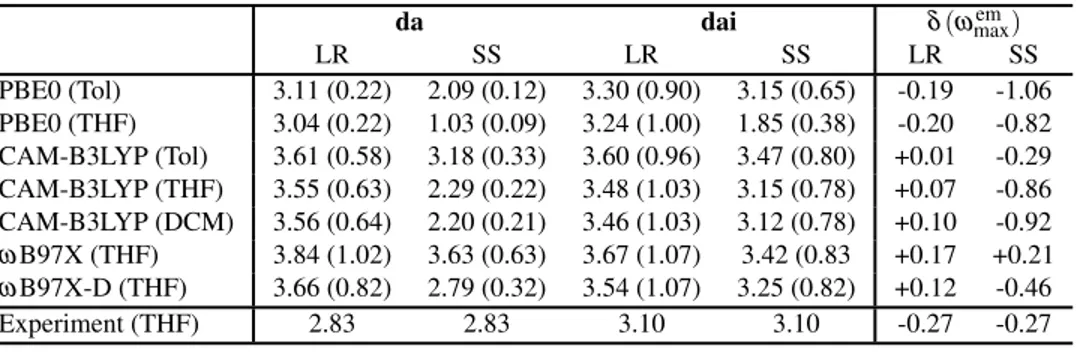
Never-Table 7Vertical emission wavelengths computed for the two dyes in eV, the number between brackets are the corresponding oscillator strengths (in a.u.). See caption of Table 6 for more details. At the rightmost part of the Table, theδ(ωem
max) are reported. Relevant experimental
values in THF are also shown to facilitate comparison.
da dai δ(ωmaxem) LR SS LR SS LR SS PBE0 (Tol) 3.11 (0.22) 2.09 (0.12) 3.30 (0.90) 3.15 (0.65) -0.19 -1.06 PBE0 (THF) 3.04 (0.22) 1.03 (0.09) 3.24 (1.00) 1.85 (0.38) -0.20 -0.82 CAM-B3LYP (Tol) 3.61 (0.58) 3.18 (0.33) 3.60 (0.96) 3.47 (0.80) +0.01 -0.29 CAM-B3LYP (THF) 3.55 (0.63) 2.29 (0.22) 3.48 (1.03) 3.15 (0.78) +0.07 -0.86 CAM-B3LYP (DCM) 3.56 (0.64) 2.20 (0.21) 3.46 (1.03) 3.12 (0.78) +0.10 -0.92 ωB97X (THF) 3.84 (1.02) 3.63 (0.63) 3.67 (1.07) 3.42 (0.83 +0.17 +0.21 ωB97X-D (THF) 3.66 (0.82) 2.79 (0.32) 3.54 (1.07) 3.25 (0.82) +0.12 -0.46 Experiment (THF) 2.83 2.83 3.10 3.10 -0.27 -0.27
theless, considering the values obtained in THF and DCM, this agreement might be fortuitous. As for absorption, the use ofωB97X does allow to recover more reasonable LR-SS differences, but the data remains far from experiment. Inter-estingly, withωB97X-D, δ(ωmaxem) improves but mainly as a consequence of SS corrections of about 1 eV on the transition energy of da. Even though this large stabilization of the ex-cited state brings the transition energy in almost perfect agree-ment with the position of the maximum of the experiagree-mental emission band, a 1 eV correction remains questionable in our views.
3.5 0-0 energies
A meaningful choice to check the absolute agreement between experiment and theory is to determine the 0-0 energies (E00) that can be compared to the crossing point between absorption and emission curves. To accurately determine this crossing point, we have used a computational protocol defined else-where,56and that includes corrections for both zero-point vi-brational energy (ZPVE) and non-equilibrium solvation ef-fects. The obtained values are reported in Table 8 together with corresponding energy shifts between the two isomers, in order to allow easy comparison with experimental data. Overall the obtained trends are in line with the conclusions drawn for absorption and emission namely: i) within the LR-PCM scheme the global hybrid PBE0 givesδ(E00) in agree-ment with experiagree-ment while range separated hybrids perform poorly, giving either small negative shifts (CAM-B3LYP) or a deficient da and dai ranking (ωB97X and ωB97X-D); ii) with the SS-PCM model, PBE0 completely fails as a result of the huge overstabilization of states having a charge transfer character; iii) the same occurs for CAM-B3LYP in THF while it does not in toluene; and iv)ωB97X-D provides the correct ordering at PCM level. It is also noteworthy that the SS-PCMωB97X-D E00energies are 3.16 and 3.62 eV for da and dai, respectively, in reasonable match with the experimental
values of 3.30 and 3.55 eV. Indeed, error of ca. a quarter of an eV are typical for such TD-DFT calculations.56
Table 8Computed 0-0 reference, E00, and the corresponding energy
shifts between da and dai,δ(E00). All data used the 6-31+G(d)
atomic basis set and the geometries are optimized at the same level of theory as the one used for the TD-DFT part. Relevant
experimental values in THF are also given to facilitate comparison.
da dai δ(E00) LR SS LR SS LR SS PBE0 (Tol) 3.24 2.24 3.52 3.17 -0.28 -0.93 PBE0 (THF) 3.19 1.46 3.42 2.26 -0.23 -0.80 CAM-B3LYP (Tol) 3.82 3.40 3.89 3.77 -0.07 -0.37 CAM-B3LYP (THF) 3.78 2.72 3.79 3.52 -0.01 -0.80 ωB97X (THF) 4.06 3.91 4.04 3.84 +0.02 +0.07 ωB97X-D (THF) 3.88 3.16 3.85 3.62 +0.03 -0.46 Experiment (THF) 3.30 3.30 3.55 3.55 -0.25 -0.25 3.6 Stokes shifts
Last, let us discuss the Stokes shifts reported Table 9 as they provide a complementary path to E00 for relevant theory– experiment comparisons. Of course, one could also wish to compute vibrationally resolved spectra, so to compare band shapes, but the experimental absorption and emission spec-tra are broad and structureless, making the vibronic simula-tions relatively pointless. Contrary to the energies of Table 8, the Stokes shifts reveal the dramatic effects of solvatochromic effects with PBE0. This marked change is the direct conse-quence of the relative oscillator strength of the excited state contributing to the first absorption band of da and brings the LR-PCM(THF) PBE0 result in good agreement with the ex-perimental Stokes shifts and δ(∆SS). All other LR calcula-tions fail to reproduce the correct sign ofδ(∆SS), but, as stated above, LR is not a very good model for emission nor, conse-quently, Stokes shifts. With the SS-PCM model, the unphys-ical large SS corrections obtained for PBE0 absorption and emission prevents any rationale analysis of the Stokes shifts
computed with PBE0, and the same holds for CAM-B3LYP results in THF. In toluene, the CAM-B3LYP data reasonably match experiment, as SS-PCM CAM-B3LYP vertical energies were meaningful (see above). Once again, ωB97X-D pro-vides accurate results, better matching experiment than their ωB97X counterparts.
Table 9Computed Stokes shifts (derived from convoluted bands with experimental FWHM when the two bright states relevant for absorption are close in energy), and corresponding energy shifts δ(∆SS) between da and dai. Relevant experimental values in THF
are also given to facilitate comparison.
da dai δ(∆SS) LR SS LR SS LR SS PBE0 (Tol) 0.55 0.44 0.81 ≤0 -0.26 PBE0 (THF) 1.25 1.56 0.83 0.79 +0.42 +0.77 CAM-B3LYP (Tol) 0.87 1.40 1.05 1.00 -0.18 +0.40 CAM-B3LYP (THF) 0.97 2.23 1.17 1.20 -0.20 +1.03 ωB97X (THF) 0.92 1.14 1.27 1.43 -0.35 -0.29 ωB97X-D (THF) 0.95 1.80 1.14 1.27 -0.19 +0.53 Experiment (THF) 1.39 1.39 1.00 1.00 +0.39 +0.39
4
Conclusions
Starting from the experimental absorption and emission spec-tra of two model chormophores based on the 1,2,3-triazole moiety, we have thoroughly investigated the ability of TD-DFT methodologies to describe their main photophysical fea-tures. Our findings show that these regio-isomers are particu-larly challenging compounds for TD-DFT and, consequently, can be viewed as interestings benchmarks to evidence poten-tial deficiencies of both new exchange-correlation functionals and/or solvent models.
First, none of the implemented level of theories, ranging from global hybrids (B3LYP, PBE0) to range-separated func-tionals without (CAM-B3LYP, ωB97X) or with dispersion corrections (ωB97X-D), was able to recover all key features of the two regio-isomers in vacuum. Secondly, accounting for solvent effects within different PCM approaches may con-duct to quantitative agreement with experiment, but assess-ing the potential of several models suggests that some theory-experiment match might be fortuitous. Indeed, within the LR approximation of the PCM model, none of the range-separated hybrids gives satisfactory trends whereas PBE0 results are rather good, especially for the absorption-fluorescence cross-ing points. However, LR-PCM PBE0 calculations lead to marked differences for absorption features of da when going from toluene to THF, with a better agreement between exper-iment and calculations for the latter. Moreover, both cLR and SS schemes of the PCM model lead to dramatic decreases of transition energies, most probably related to the appear-ance of spurious charge transfer states, an artifact common of
global hybrids but apparently enhanced with SS-PCM, mak-ing the SS-PCM-PBE0 combination clearly out of control in the present cases.
SS-PCM corrections are larger for da than for dai and big-ger in THF than in toluene when using range-corrected hy-brids. While the magnitude of these corrections remain rea-sonable for both the absorption and emission of dai, they be-come unphysically large for most of the fluorescence wave-lengths computed for da, e.g., SS-PCM(THF) CAM-B3LYP results are both large and leading to non satisfying match with experiment. When using the ωB97X exchange-correlation functional, that incorporates larger amount of exact exchange, no methodological catastrophe is to be found but the experi-mental differences between the two isomers are not restored. Though the SS-PCM corrections for the fluorescence of da remain large, ωB97X-D, that allows to recover most of the experimental trends for the systems investigated herein, could be the best available compromise approach.
In summary, our findings suggest that the SS-PCM ap-proach may be useful to reveal the charge transfer failure of current and new exchange-correlation functionals, even though it may improves the description in some cases. Such tendency was noted before, though much less dramatically then here, as only systems with a strong intramolecular charge-transfer described with global hybrids were shown to exhibit an incorrect behaviour of the SS-PCM approach.64 Last but not least, this work also prescribes particular cir-cumspection about TD-DFT results obtained for 1,2,3-triazole based chromophores.
Acknowledgement
D.J. acknowledges the European Research Council (ERC) and the R´egion des Pays de la Loire for financial support in the framework of Starting Grant (Marches - 278845) and a
re-crutement sur poste strat´egique, respectively. This research
used resources of the CCIPL (Centre de Calcul Intensif des
Pays de Loire), of a local Troy cluster and was granted access
to the HPC resources of CINES and IDRIS under the allo-cations 2012-[x2012080649] and 2013-[x2013080649] made by GENCI (Grand Equipement National de Calcul Intensif). B.M.W. acknowledges the National Science Foundation for supercomputing resources through the Extreme Science and Engineering Discovery Environment (XSEDE), Project No. TG-CHE130052.
References
1 Fundamentals of Time-Dependent Density Functional Theory, ed. M. A. L. Marques, F. M. S. Nogueira, E. K. U. Gross and A. Rubio, Springer-Verlag, Heidelberg, 2012, vol. 837, p. 592.
2 M. E. Casida and M. Huix-Rotllant, Ann. Rev. Phys. Chem., 2012, 63, 287–323.
3 C. Adamo and D. Jacquemin, Chem. Soc. Rev., 2013, 42, 845–856. 4 H. Iikura, T. Tsuneda, T. Yanai and K. Hirao, J. Chem. Phys., 2001, 115,
3540–3544.
5 J. Heyd, G. E. Scuseria and M. Ernzerhof, J. Chem. Phys., 2003, 118, 8207–8215.
6 T. Yanai, D. P. Tew and N. C. Handy, Chem. Phys. Lett., 2004, 393, 51–56. 7 J. D. Chai and M. Head-Gordon, J. Chem. Phys., 2008, 128, 084106. 8 S. Grimme, J. Comput. Chem., 2006, 27, 1787–1799.
9 J. D. Chai and M. Head-Gordon, Phys. Chem. Chem. Phys., 2008, 10, 6615–6620.
10 T. van Mourik, J. Chem. Theory Comput., 2008, 4, 1610–1619. 11 S. N. Steinmann and C. Corminboeuf, J. Chem. Theory Comput., 2011, 7,
3567–3577.
12 S. Grimme and F. Neese, J. Chem. Phys., 2007, 127, 154116. 13 E. Fromager, J. Chem. Phys., 2011, 135, 244106.
14 E. Br´emond and C. Adamo, J. Chem. Phys., 2011, 135, 024106. 15 R. J. Magyar and S. Tretiak, J. Chem. Theory Comput., 2007, 3, 976–987. 16 B. M. Wong and J. G. Cordaro, J. Chem. Phys., 2008, 129, 214703. 17 T. Stein, L. Kronik and R. Baer, J. Chem. Phys., 2009, 131, 244119. 18 L. Goerigk and S. Grimme, J. Chem. Theory Comput., 2011, 7, 3272–
3277.
19 M. Dierksen and S. Grimme, J. Phys. Chem. A, 2004, 108, 10225–10237. 20 F. Santoro, R. Improta, A. Lami, J. Bloino and V. Barone, J. Chem. Phys.,
2007, 126, 084509.
21 F. Santoro, R. Improta, A. Lami, J. Bloino and V. Barone, J. Chem. Phys., 2007, 126, 184102.
22 F. Santoro, A. Lami, R. Improta, J. Bloino and V. Barone, J. Chem. Phys., 2008, 128, 224311.
23 A. Charaf-Eddin, A. Planchat, B. Mennucci, C. Adamo and D. Jacquemin, J. Chem. Theory Comput., 2013, 9, 2749–2760.
24 R. Cammi and B. Mennucci, J. Chem. Phys., 1999, 110, 9877–9886. 25 J. Tomasi, B. Mennucci and R. Cammi, Chem. Rev., 2005, 105, 2999–
3093.
26 M. Caricato, B. Mennucci, J. Tomasi, F. Ingrosso, R. Cammi, S. Corni and G. Scalmani, J. Chem. Phys., 2006, 124, 124520.
27 R. Improta, V. Barone, G. Scalmani and M. J. Frisch, J. Chem. Phys., 2006, 125, 054103.
28 R. Cammi, S. Corni, B. Mennucci and J. Tomasi, J. Chem. Phys., 2005, 122, 104513.
29 R. Improta, G. Scalmani, M. J. Frisch and V. Barone, J. Chem. Phys., 2007, 127, 074504.
30 D. M. Chipman, J. Chem. Phys., 2009, 131, 014103. 31 D. M. Chipman, J. Chem. Phys., 2009, 131, 014104.
32 A. V. Marenich, C. J. Cramer, D. G. Truhlar, C. G. Guido, B. Mennucci, G. Scalmani and M. J. Frisch, Chem. Sci., 2011, 2, 2143–2161. 33 C. Katan, M. Blanchard-Desce and S. Tretiak, J. Chem. Theory Comput.,
2010, 6, 3410–3426.
34 A. D. Becke, J. Chem. Phys., 1993, 98, 5648–5652.
35 G. E. Scuseria and V. N. Staroverov, in Progress in the development of
exchange-correlation functionals, ed. C. E. Dykstra, G. Frenking, K. S. Kim and G. E. Scuseria, Elsevier, Amsterdam, 2005, book section 24, pp. 669–724.
36 A. Qin, C. K. W. Jim, W. Lu, J. W. Y. Lam, M. H¨aussler, Y. Dong, H. H. Y. Sung, I. D. Williams, G. K. L. Wong and B. Z. Tang, Chem. Rev., 2007, 40, 2308–2317.
37 Z. Zhou and C. J. Fahrni, J. Am. Chem. Soc., 2004, 126, 8862–8863. 38 P. D. Jarowski, Y.-L. Wu, W. B. Schweizer and F. Diederich, Org. Lett.,
2008, 10, 3347–3350.
39 S. Ast, T. Fischer, H. Muller, W. Mickler, M. Schwichtenberg, K. Rurack and H. J. Holdt, Chem. Eur. J., 2013, 19, 2990–3005.
40 D. Schweinfurth, K. I. Hardcastle and U. H. F. Bunz, Chem. Commun.,
2008, 2203–2205.
41 P. D. Zoon, I. H. M. v. Stokkum, M. Parent, O. Mongin, M. Blanchard-Desce and A. M. Brouwer, Phys. Chem. Chem. Phys., 2010, 12, 2706– 2715.
42 M. Parent, O. Mongin, K. Kamada, C. Katan and M. Blanchard-Desce,
Chemical Communications, 2005, 2029–2031.
43 C. Katan, S. Tretiak and J. Even, in Two-photon transitions in triazole
based quadrupolar and octupolar chromophores: a TD-DFT investiga-tion, ed. D. L. Andrews, J. M. Nunzi and A. Ostendorf, Spie-Int Soc Op-tical Engineering, Bellingham, 2010, vol. 7712, p. 77123D.
44 A. Qin, C. K. W. Jim, W. Lu, J. W. Y. Lam, M. H¨aussler, Y. Dong, H. H. Y. Sung, I. D. Williams, G. K. L. Wong and B. Z. Tang, Macromolecules, 2007, 40, 2308–2317.
45 J. Xie, L. Hu, W. Shi, X. Deng, Z. Cao and Q. Shen, J. Polym. Sci. B:
Polym. Phys., 2008, 46, 1140–1148.
46 Z. Li, G. Yu, P. Hu, C. Ye, Y. Liu, J. Qin and Z. Li, Macromolecules, 2009, 42, 1589–1596.
47 Z. Li, G. Yu, W. Wu, Y. Liu, C. Ye, J. Qin and Z. Li, Macromolecules, 2009, 42, 3864–3868.
48 P. A. Sullivan, H. Rommel, Y. Liao, B. C. Olbricht, A. J. P. Akelaitis, K. A. Firestone, J. W. Kang, J. D. Luo, J. A. Davies, D. H. Choi, B. E. Eichinger, P. J. Reid, A. T. Chen, A. K. Y. Jen, B. H. Robinson and L. R. Dalton, J. Am. Chem. Soc., 2007, 129, 7523–7530.
49 C. Adamo and V. Barone, J. Chem. Phys., 1999, 110, 6158–6170. 50 M. Ernzerhof and G. E. Scuseria, J. Chem. Phys., 1999, 110, 5029–5036. 51 B. M. Wong, M. Piacenza and F. Della Sala, Phys. Chem. Chem. Phys.,
2009, 11, 4498–4508.
52 B. M. Wong and T. H. Hsieh, J. Chem. Theory Comput., 2010, 6, 3704– 3712.
53 M. J. Frisch, G. W. Trucks, H. B. Schlegel, G. E. Scuseria, M. A. Robb, J. R. Cheeseman, G. Scalmani, V. Barone, B. Mennucci, G. A. Peters-son, H. Nakatsuji, M. Caricato, X. Li, H. P. Hratchian, A. F. Izmaylov, J. Bloino, G. Zheng, J. L. Sonnenberg, M. Hada, M. Ehara, K. Toyota, R. Fukuda, J. Hasegawa, M. Ishida, T. Nakajima, Y. Honda, O. Kitao, H. Nakai, T. Vreven, J. A. Montgomery, Jr., J. E. Peralta, F. Ogliaro, M. Bearpark, J. J. Heyd, E. Brothers, K. N. Kudin, V. N. Staroverov, R. Kobayashi, J. Normand, K. Raghavachari, A. Rendell, J. C. Burant, S. S. Iyengar, J. Tomasi, M. Cossi, N. Rega, J. M. Millam, M. Klene, J. E. Knox, J. B. Cross, V. Bakken, C. Adamo, J. Jaramillo, R. Gomperts, R. E. Stratmann, O. Yazyev, A. J. Austin, R. Cammi, C. Pomelli, J. W. Ochterski, R. L. Martin, K. Morokuma, V. G. Zakrzewski, G. A. Voth, P. Salvador, J. J. Dannenberg, S. Dapprich, A. D. Daniels, O. Farkas, J. B. Foresman, J. V. Ortiz, J. Cioslowski and D. J. Fox, Gaussian 09 Revision
D.01, 2009, Gaussian Inc. Wallingford CT.
54 P. C. Hariharan and J. A. Pople, Theoret. Chimica Acta, 1973, 28, 213– 222.
55 R. Krishnan, J. S. Binkley, R. Seeger and J. A. Pople, J. Chem. Phys., 1980, 72, 650–654.
56 D. Jacquemin, A. Planchat, C. Adamo and B. Mennucci, J. Chem. Theory
Comput., 2012, 8, 2359–2372.
57 A. K. Feldman, B. Colasson and V. V. Fokin, Org. Lett., 2004, 6, 3897– 3899.
58 A. Altomare, M. C. Burla, M. Camalli, G. L. Cascarano, C. Giacovazzo, A. Guagliardi, A. G. G. Moliterni, G. Polidori and R. Spagna, J. Appl.
Cryst., 1999, 32, 115–119.
59 G. M. Sheldrick, Acta Cryst. A, 2008, 64, 112–122. 60 L. J. Farrugia, J. Appl. Cryst., 2012, 45, 849–854.
61 D. Jacquemin, Int. J. Quantum Chem., 2012, 112, 2043–2050. 62 R. L. Martin, J. Chem. Phys., 2003, 118, 4775–4777.
63 A. Kokalj, Computational Materials Science, 2003, 28, 155 – 168. 64 S. Chibani, A. Charaf-Eddin, B. Le Guennic and D. Jacquemin, J. Chem.