HAL Id: hal-01007812
https://hal.archives-ouvertes.fr/hal-01007812
Submitted on 5 May 2018HAL is a multi-disciplinary open access archive for the deposit and dissemination of sci-entific research documents, whether they are pub-lished or not. The documents may come from teaching and research institutions in France or abroad, or from public or private research centers.
L’archive ouverte pluridisciplinaire HAL, est destinée au dépôt et à la diffusion de documents scientifiques de niveau recherche, publiés ou non, émanant des établissements d’enseignement et de recherche français ou étrangers, des laboratoires publics ou privés.
A study of the apparent thermal conductivity of cement
paste at very early age of hydration: An attempt of
modelisations
Pierre Mounanga, Guy Bastian, Abdelhafid Khelidj
To cite this version:
Pierre Mounanga, Guy Bastian, Abdelhafid Khelidj. A study of the apparent thermal conductivity of cement paste at very early age of hydration: An attempt of modelisations. Sixteenth European Con-ference for Thermophysical Properties (ECTP 2002), 2002, Londres, United Kingdom. �hal-01007812�
A study of the evolution of the thermophysical properties of cement paste at
early age of hydration – an attempt of modelisations
P. Mounanga, G. Bastian, A. Khelidj
Laboratoire Génie Civil de Nantes St-Nazaire (L.G.C.N.S-N.), I.U.T. de Saint-Nazaire, BP 420, 44606 Saint-Nazaire Cedex, France ; e-mail : mounanga@iutsn.univ-nantes.fr
Abstract: The measurement results of the apparent thermal conductivity of cement paste at very early stages of
hydration are described and an attempt of modelisations of these results is presented.
The experimental method is based on the “hot wire” method. The results show an evolution of the apparent thermal conductivity of the cement paste at very early age. Two types of modelling are proposed to explain this evolution:
- First, the apparent thermal conductivity is calculated assuming the fresh cement paste as a multiphase material. This model enables to take account of the material chemical evolution.
- The second modelling approach is based on the theory of heat and mass transfer in non-saturated porous media. It enables to take account of two main phenomena observed during the hydration of cement-based materials. The first one is the creation of an internal porosity, partially saturated; the second one is the temperature elevation of the material, due to the exothermic character of hydration reactions.
The results of this second modelling seem to fit better to our experimental results.
Keywords: Apparent thermal conductivity, cement paste, “hot wire” method, hydration, early age, modelling.
1 Introduction
The aim of the present work was to study the evolution of the apparent thermal properties of Ordinary Portland Cement paste (OPC). OPC constitutes the reactive phase of concrete and it ensures the cohesion and a part of the material rigidity.
The hydration process of cement that leads to these mechanical properties occurs with important heat liberation. Both this exothermic character and the thermo-activated character of the hydration reactions can lead to cracks at early ages of the material and to a loss of durability in structures, especially in case of large structures.
In order to prevent these cracks, it is important to understand precisely the thermal behaviour of the material during its hydration. Extensive works have been made in determining thermal properties of concrete in hardened state [1, 2, 3, 4, 5] but very few studies have been carried out on fresh material, when heat liberation takes place. We can quote [6, 7, 8]. These studies reveal contradictive results.
The choice of pure cement paste enables to directly link the evolution of thermal properties to both chemical and structural evolution of the material. In this paper, we focus on the evolution of the thermal conductivity of fresh OPC. The complexity of hydration process lies in the fact that anhydrous cement is a heterogeneous material: each of its chemical phases has its proper kinetic of hydration and interacts with the other ones [9]. From a structural point of view, the negative volume balance between reaction products (mainly calcium silicate hydrate noted C-S-H) and initial products provokes the creation of an internal porosity and so of an internal vapour water phase.
The model of hydration proposed in [10] simplifies this process and assumes a global hydration degree and a linear production of CSH products, function of this degree. Considering cement paste as a multiphase material and assigning to each phase the values of its own thermal properties, it is possible to estimate the thermal conductivity evolution of the material as a function of the progression of chemical reactions (classical Maxwell’s problem). A second approach consists in taking account of the micro-structuration of the material (creation of non-saturated internal porosity), and in assuming evaporation-condensation mechanisms. The application of Philip and De Vries’ analysis [11, 12, 13] permits to quantify the effect of such mechanisms on the thermal conductivity variations of wet porous materials.
Both modelling approaches have been applied to the case of OPC. The computed results have been compared with experimental results previously obtained by the way of the “hot wire method”.
2 Experimental set-up
2.1 Material
The cement used was an ordinary type I Portland cement (CPA CEM I 52.5 HTS), containing 63.3% of C3S,
(w/c) ratio was 0.348. A mixing during three minutes has ensured the homogeneous mix between cement and water. Immediately after mixing, the cement paste has been poured into a PVC tube containing the two parallel wires.
2.2 Thermal conductivity measurement
The method used to determine the thermal conductivity of OPC is an adaptation of the “two wires method” [6]. It is proper to call it “apparent” thermal conductivity of the material since Moyne and al. [14] have demonstrated that it is the only value that transient type methods allow to determine. This notion of “apparent” thermal conductivity λ* will be clarified later in this paper (see section 4.2).
The test device is schematically illustrated in Fig. 1.
wires stressing system dynamometer orifices for the thermocouples base voltmeter voltmeter cement paste orifice for the relative humidity probe non-heated wire heated wire PVC mould electric current
Fig. 1. Schematic of the test device used for the measurement of fresh cement paste thermal conductivity.
Two stainless steel wires (Ø 0.5 mm) insulated with thermo-retractable sheath were used as temperature captors for measuring temperature variations. One of these wires was used as a heat line source: every half an hour, a 4 A-current passed through this wire and provoked its heating. A transformer associated with a potentiometer supplied the current. The duration of heating steps was 60 sec.; between each heating step (and during the whole experiment for the non-heated wire), a much lower current (80 mA) was injected in both wires in order to generate the potential difference necessary to voltage measurements. Measuring the wires voltage with a central data acquisition system during heating and non-heating steps enabled us to determine the evolution of their electrical resistance. From the knowledge of the law resistance vs. temperature of the wires, previously determined, we deduced the evolution of their temperature and therefore the “apparent” thermal conductivity and the volumetric heat capacity of the material. The theoretical development leading to the calculation of these thermal properties can be found in details in [15,6]
The exterior mould containing the fresh cement paste was a 1200 mm long PVC tube, with a diameter of 160 mm. A wire mechanical stressing system was placed at each extremity of the pipe to ensure a similar mechanical state (50 N) of both wires. Those latter were set symmetrically about the cylinder axis. The distance between the two wires was 15 mm. Four other captors were used:
- 3 thermocouples, placed respectively at 200 mm, 400 mm and 600 mm from the top of the PVC tube, - a relative humidity probe, set 25 hours after the casting of the cement paste, in an orifice made with a
steel rode (Ø5 mm). This probe measured the diminution of internal relative humidity due to the mixing water consumption provoked by the hydration process.
Once the paste had been cast, the mould was closed and sealed with silicone grease in order to prevent any mass exchange between the specimen and the outside. The experiment was conducted in a temperature and relative humidity controlled room (T=20±2°C, relative humidity=50±5%).
2.3 Hydration degree measurement
The evolutions of the whole important properties of cement paste (resistance [16], chemical shrinkage [17], hydration heat [18], etc.) can be directly linked to its hydration degree. In order to find a correlation between the evolution of thermal properties of cement paste and the chemical changes induced by the hydration process, we measured at the same time the evolution of the hydration degree of cement paste. For this purpose, prismatic specimens (40 mm) were prepared from the same batch used for the making of the cylindrical specimen. The method adopted here to ensure the sealing of the prismatic samples was, firstly, to wrap moulds with plastic film in a damp cloth up to an age of 24 hrs and, secondly, to seal the specimens with a resin layer and aluminium adhesive tape after demoulding at 24 hrs.
160 40× ×
The hydration degree was determined using as a basis the fact that the hydration of 1 g of anhydrous cement produces 0.23 g of evaporable water. This ratio was calculated from Bogue’s formula [19]. The non-evaporable water corresponds to the loss on ignition (LOI) of hydrating cement paste sample between 105°C and 1050°C [20]. We obtain the following equation for the calculation of the hydration degree:
( )
(
)
100 / 1 23 . 0 ) ( 100 23 . 0 ⋅ × = ⋅ ⋅ + × = wntc wntm wc α , α in % (1)where α is the hydration degree of cement paste, wn(t) is the mass of non-evaporable water measured at time t, c is the initial mass of anhydrous cement in the sample of cement paste and m the mass of this sample, w/c is the initial water /cement ratio. Fig. 2. shows the evolution of cement paste hydration degree as a function of time. The furnace used for the samples ignition was a Thermolyne type 6000. For each measurement, three prismatic specimens were cut and two pieces (1 cm3) were taken from each of these specimens for the determination of
hydration degree. The whole process of measurement can be found in details in [21].
3 Results and discussions
3.1 Correction of the experimental results
As mentioned in introduction, cement paste manifests at early age (between 5 and 10 hours after its mixing) important heat liberation. This exothermic phenomenon perturbs the measurements because the real temperature evolution of the wires is due to both heat liberated by Joule effect and heat generated by the chemical reactions. Since the equations for the determination of thermal conductivity only take account of the power supplied by the electric current, a correction is necessary to eliminate the influence of this artefact. We have considered a pure additive effect between the power generated by the hydration process and the power supplied by the electric current. In that case, correcting the results consists in deducting the temperature raising (θhydr(t)) due to the hydration heat from the measured temperature raising of the wire (θmeas(t)):
( )
t meas( )
t hydr( )
tcor θ θ
θ = − , (2)
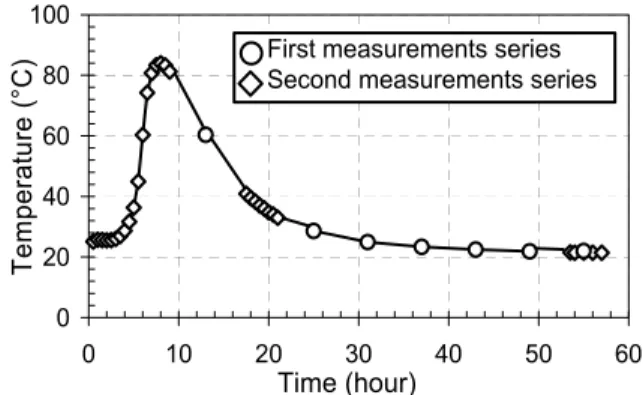
where θcor(t) is the corrected temperature raising of the “hot wire”. θhydr(t) evolution was measured by the thermocouples embedded in cement paste (see Fig. 3).
0 10 20 30 40 50 60 0 10 20 30 40 50 6 Time (hour) Hyd ra tion deg re e (% ) 0 First measurements series Second measurements series
Fig. 2. Evolution of hydration degree (measured by LOI) vs. time. 0 20 40 60 80 100 0 10 20 30 40 50 6 Time (hour) T e m p eratu re (°C ) 0 First measurements series Second measurements series
Fig. 3. Evolution of internal temperature of fresh cement paste vs. time.
3.2 Evolution of apparent thermal conductivity
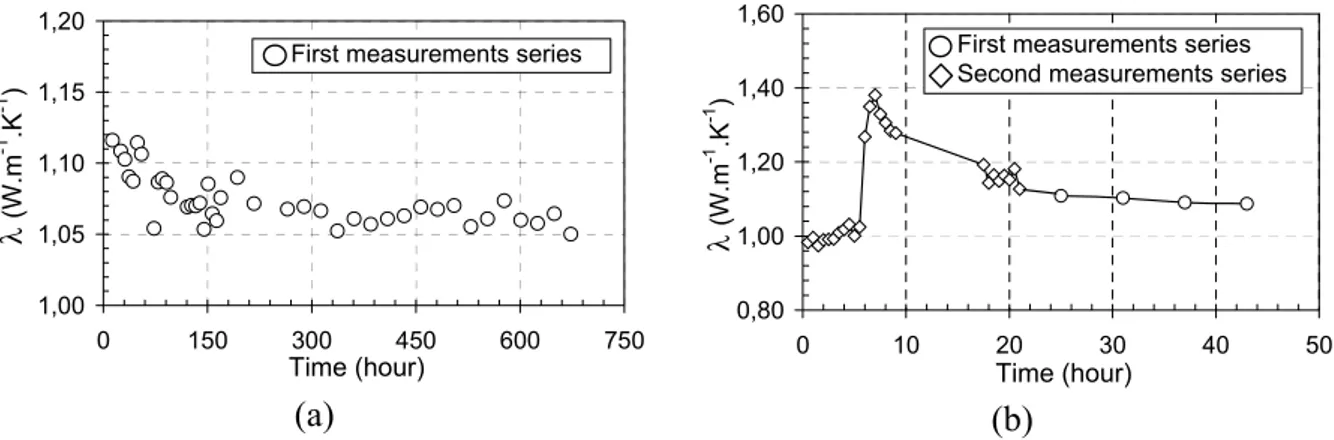
Two series of tests have been carried out. The first series, conducted over a relatively long period (28 days), shows a variation of apparent thermal conductivity at early ages. In order to clarify this variation, we have achieved a second test series during a shorter period (the first 24 hrs after the casting of OPC). We present at Fig. 4 the evolution of the apparent thermal conductivity of cement paste. We can distinguish three main phases: - From 0 to 6 hrs after mixing, the apparent thermal conductivity remains nearly constant, at about 1 W.m-1.K-1.
- At about 6 hrs, the apparent thermal conductivity shows a maximum, at 1.4 W. m-1.K-1.
- After this peak, the apparent thermal conductivity value decreases and stabilizes at about 1.1 W. m-1.K-1.
The final value of apparent thermal conductivity is globally in agreement with [22]. But we did not find in literature any information about a peak in the evolution of cement paste thermal conductivity at very early age. In order to explain this phenomenon, we have applied two types of modelling and compared them with experimental results. The following parts of this paper deal with the modelling.
1,00 1,05 1,10 1,15 1,20 0 150 300 450 600 750 Time (hour) λ (W.m -1 .K -1 )
First measurements series
(a)
0,80 1,00 1,20 1,40 1,60 0 10 20 30 40 5 Time (hour) λ (W. m -1 .K -1 ) 0 First measurements series Second measurements series(b)
Fig. 4. Evolution of measured apparent thermal conductivity of cement paste (corrected results) vs. time. (a) during 28 days; (b) during the first 24 hrs after casting.
4 Modelling approaches
4.1 Linear chemical evolution model of Neville and classical Maxwell’s problem
This modelling approach consists in connecting directly the evolution of the apparent thermal conductivity to the chemical evolution of cement paste. The principle is based on the classical Maxwell’s problem: assuming only pure conductive heat transfers, we estimate the apparent thermal conductivity λ*of cement paste as the equivalent
conductivity of a multiphase material:
( ) ( )
(
λ α)
λ i iT V g , = ∗ , (3) where λi and Vi are the thermal conductivity and the volume fraction respectively, of phase i, T is the temperature and g represents different types of multiphase models (series/parallel model, Hashin and Shtrikman’s model). Considering the reactive behaviour of OPC, we need first to quantify the volume fraction evolutions of each phase. In order to express these evolutions as a function of hydration degree α, the Neville’s model has been used [10]. This model implies several hypotheses:1- Hydration reactions which are in fact various and complex, are represented by a global reactive balance such as: anhydrous cement + water → hydrates.
2- Hydration of 1 g of anhydrous cement consumes 0.23 g of water.
3- Absolute volume Vh of hydrates formed by reactions is less than the sum of anhydrous cement (
V
) and water (V
) volumes consumed by hydration (Le Châtelier’s contraction [23]):c c c w c w c c c w c w c c h V V V V V V =( + )−0.254⋅ = +0.746⋅ (4)
4- Hydrates structure contains micro-pores which occupy a volume Vm expressed as:
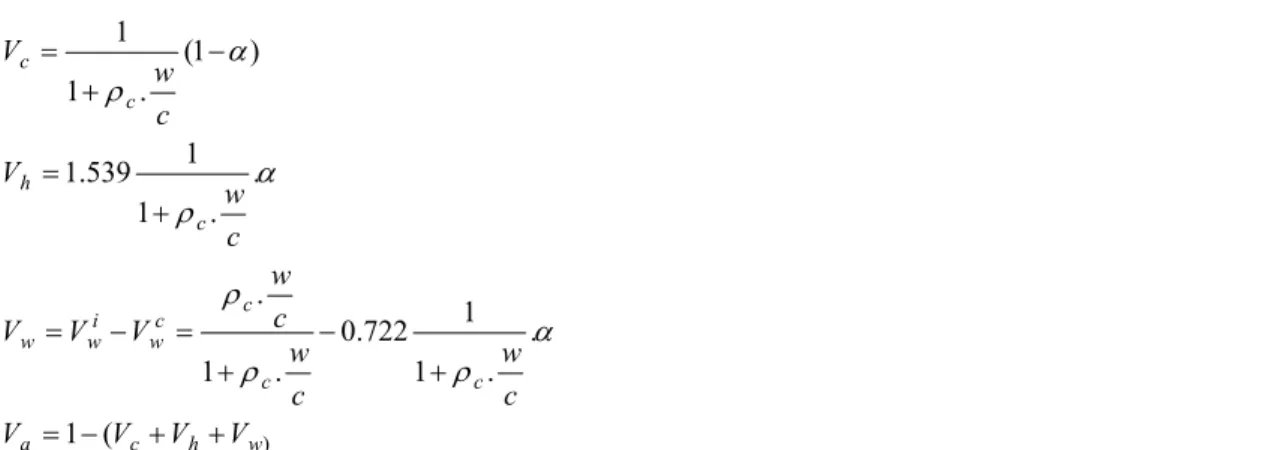
28 . 0 = + h m m V V V (5) Finally, we obtain the following equations system, for 1 volume unit of cement paste:
(6.a) (6.b) (6.c) + + − = + − + = − = + = − + = ) ( 1 . . 1 1 722 . 0 . 1 . . . 1 1 539 . 1 ) 1 ( . 1 1 w h c a c c c c w i w w c h c c V V V V c w c w c w V V V c w V c w V α ρ ρ ρ α ρ α ρ (6.d) where Vc, Vw, Vh, Va are the anhydrous cement volume fraction, water volume fraction, hydrates volume fraction and gaseous volume fraction respectively, present in cement paste at α % of hydration, ρc is the density of anhydrous cement (ρc =3.15) and w/c the initial water/cement ratio. Superscripts c and i are for “consumed” and “initial”, respectively.
The thermal conductivities values of the different phases (anhydrous cement + hydrates, liquid water and air) are given in Table I.
Table I. Thermal conductivity values of the different phases of fresh cement paste.
Phase Thermal conductivity (W.m-1.K-1) Sources
Anhydrous cement + hydrates 2.8 [25] (on crushed hydrated cement paste)
Water 0.6 [15]
Air 0.025 [15]
From (6) and the values of Table I, it is possible to propose a bracketing of λ*. Two approaches have been used:
- first, disregarding the material structure, we have used the series/parallel models (Wiener bounds) whose lower bound is given by:
1 1 − = ⊥ =
∑
n i i i V λλ , (series model) (7.a)
and upper limit is expressed as:
∑
= = n i i i V 1 .λ λ , (parallel model) (7.b)- Secondly, we have assumed an isotropic structure of the fresh cement paste and applied the more restrictive Hashin and Shtrikman’s model. The thermal conductivity λ* of the multiphase material is bounded by:
n n n n l l l l A A A A λ λ λ λ λ 3 1 3 1 − + ≤ ≤ − + ∗ , (8.a) in which, λ1≤λ2≤...≤λn are respectively the thermal conductivities of phases 1, 2 , ...n of the material and
,
∑
≠ = + − = n j i i j j i i j V A 1 3 1 1 λ λ λ,
(8.b) where λi and Vi are the thermal conductivity and the volume fraction respectively, of phase i of the material. The results of the simulation calculated from (7) and (8) are represented at Fig. 5. The comparison between the modelling results and the experimental ones leads us to two remarks:- On the first hand, both models give an acceptable bracketing of the linear part of the experimental curve. The Hashin and Shtrickman’s model permits us to obtain a more precise bracketing; this fact shows that we can consider fresh cement paste structure as isotropic.
- On the other hand, the application of these two models cannot account of the apparent thermal conductivity peak observed at about 30% of hydration.
4.2 Philip and De Vries’ analysis (PDVA)
We know after Krischer [24] that the vapour diffusive transport contributes to the heat transfer process in wet porous media by the so-called evaporation-condensation mechanism: water evaporates from the hot surface of the pores, migrates under the action of the gaseous diffusion and condenses on the cold surface, transferring thus its latent heat vaporization.
Considering the case of fresh cement paste, we know that hydration process provokes two important phenomena in material microstructure: first, the creation of an internal porosity, secondly the consumption of water by the chemical reactions. The coupling of these two phenomena leads to phase change (liquid water – vapour water) and creation of interfaces between liquid and vapour water. The diminution of internal relative humidity measured during the cement paste hydration is a result of the creation of such menisci.
Classical Philip and De Vries’ analysis (PDVA) permits to take account of the evaporation-condensation mechanism that can exist in non-saturated porous media submitted to relative high temperatures. A restriction on the application of PDVA to our case is that, originally, it is only applicable to non-reactive bodies. In spite of this main objection, we have chosen to use that analysis: the main interest is to conclude if such an approach, already used with success on hardened civil engineering materials (wood concrete [25], autoclaved aerated concrete [26]), can give a correct order of magnitude of the experimental results obtained on hardening cement paste. In the theoretical framework proposed by Philip and De Vries, the heat flow Q inside wet porous media can be written as: v vJ L T Q=−λ0∇ + , (9)
in which λ0 is the “pure” thermal conductivity (Fourier’s law), ∇T a temperature gradient, Lv the water latent heat of vaporization and Jv a mass flow of water vapour. The term LvJv represents the evaporation-condensation effects. The amount of sensible heat transferred is negligible because of the small vapour density and the high value of the latent heat vaporization compared to the specific heat of water. The vapour flux density Jv may be written as: v v va v fD PPP RTM P J ∇ − − = , (10)
a specific application of Fick’s law, in which P is the total pressure, Pv the partial pressure of water vapour, M its molar mass, R the perfect gas constant, Dva the diffusion coefficient of water vapour in air, T the temperature and
f an adimensional factor taking into account the tortuosity effect of the porous media. If we assume water vapour
as a perfect gas and consider very high moisture content (relative humidity ϕ ≈100%), then:
vs vs
v P P
P = .ϕ ≈ , (11)
where Pvs is the saturation vapour pressure.
Therefore, neglecting in first approximation a moisture rate gradient, (10) becomes: T dT dP RT M P P P fD J vs vs va v =− − ∇ . (12)
If we now report (12) in (9), we obtain:
T T dT dP RT M P P P D fL Q vs vs va v ∇ =− ∇ − + − = λ λ∗ 0 (13)
which gives the classical form of Fourier’s law, if we assume the concept of apparent thermal conductivity λ*of the material. The term
dT dP RT M P P P D L vs vs va
v − is homogeneous to a thermal conductivity. It is generally noted as
λdiff and represents the apparent contribution of water vapour diffusion to heat transfer. There is different ways to take this term into account in the calculation of the apparent thermal conductivity of wet porous materials. De Vries [13] suggested use of (λdiff+λa) for the effective thermal conductivity of the air component, where λa is the normal thermal conductivity of air. Bouguerra [25] and Laurent and al. [26] have used the development presented in (13). Finally, they obtained the following expression for λ*:
diff
fλ λ
λ∗ = 0+ (14)
The expression of Jv proposed in [27] is slightly different since the authors have taken account explicitly of the
gaseous phase volume content a. They obtained the expression of the apparent thermal conductivity λ*from: Tv v lL D ρ λ λ∗ = 0+ , (15) where ∂ ∂ + − = θ ϕ ϕ ρ α T P dT dP RT M P P P aD D vs vs l v va Tv 1 , (16)
in which α is an adimensional factor taking account of the geometrical influence of the porous media on vapour
diffusion, and θ is the volume water content of the material. If we consider, as previously, a constant relative
humidity ϕ ≈100%, (16) becomes: dT dP RT M P P P aD D vs l v va Tv =α − ρ1 (17)
Combining (17) with (15) leads to the following formulation of λ*:
dT dP RT M P P P D aL vs v va v − + = ∗ λ α λ 0 (18)
The identification of the different parameters shows that the factor f, present in (14), corresponds to the factor αa used in (18). Considering high moisture content rate, the only difference between both expressions of λ* is that Crausse and al. [27] have introduced explicitly the value of volume air content.
Experimental results [14, 25, 26] show that f can be considered as a unique function of the saturation rate S of the
material. Practically speaking, f is determined by measuring λ* at different temperatures and assuming that at low temperature, evaporation-condensation effects can be neglected (λ∗=λ0). Factor f may be therefore expressed as:
( )
( )
T S T S S f diff measured λ λ λ( , ) 0 ) ( = ∗ − (19)Adapting this approach to our case, we have considered that:
1) The value of λ0 changes during the hydration process since in autogenous conditions, the saturation rate is directly function of both hydration degree and initial water content of the cement paste. λ0 evolution can be supposed, in first approximation, as linear between two values: the apparent thermal conductivity measured at t = 1 hr (T=25,65°C; α =12.74%), noted , and the same parameter measured at t = 73 hrs (T=21.33°C;
α =58.88%), noted . Therefore, we obtain λ
∗ 1 λ ∗ 2 λ 0 as:
(
)
∗ ∗ ∗ + − ⋅ − = 2 1 2 0( ) 46.14 α 58.88 λ λ λ α λ (α in %) (20)2) For a given material, λdiff value depends on the internal pressure of gaseous phase, temperature, and relative humidity of the material ([28] for example). At atmospheric pressure and for a relative humidity value close to 100%, we can use the following expression already given by [24]:
) . 054198 . 0 exp( 02213 . 0 T diff = × λ (T in °C) (21)
3) Our experimental results do not enable us to determine the value of factor f. We know that, at early age,
cement paste shows a high saturation rate. Experiments made on hardened wood concrete and autoclaved concrete have concluded that in field of high saturation rate, the value of f does not exceed 0.2. In order to
achieve some simulations and compare them with our experimental results, we have considered, due to simplicity, that f remains constant and we simulate different f-values.
Experimental results and modelling results obtained from the application of (20) and (21) are presented in Fig. 5.
0,0 0,4 0,8 1,2 1,6 2,0 0 10 20 30 40 50 6 Hydration degree (%) λ (W .m -1 .K -1 ) Series model Parallel model
Hashin and Shtrickman's bounds
0
Corrected experimental results Modelling results (PDVA), f =0.17
Fig. 5. Bracketing of measured apparent thermal conductivity (corrected results) with different multiphase models (series/parallel model and Hashin and Shtrikman’s model) and comparison with apparent thermal
Fig 5. shows that PDVA gives a good order of magnitude of experiments results for f =0.17.
In spite of this first positive element, we note an offset between the experimental peak of apparent thermal conductivity evolution of fresh cement paste and the theoretical peak calculated by mean of PDVA. Several reasons may be set out: PDVA does not consider reactive and shrinking materials (it is the case of fresh cement paste). Moreover, we have neglected the movement of moisture inside the material. This moisture movement combined with the temperature gradient induced by the exothermic character of cement hydration may influence apparent thermal properties of the material.
5 Conclusions
This study on the thermal behaviour of fresh cement paste maintained in autogenous conditions has shown a variation of its apparent thermal conductivity at very early ages. From the comparison between these experimental results and modelling attempts presented in the paper, the following main conclusions can be drawn:
The chemical evolution of the fresh cement paste cannot completely explain the variation of its apparent thermal conductivity at very early ages.
Considering the existence of evaporation-condensation phenomenon due to the structural changes of the material, we applied Philip and De Vries’ analysis. This application enables us to obtain a better agreement with experimental results but shows a time offset between modelling results and experimental ones.
Further experimental work is necessary, especially in isothermal conditions to clarify the phenomenon observed and get closer to previous experimental and theoretical studies achieved in isothermal conditions. For this purpose, the achievement of a specific device is in progress in our laboratory. This device will permit us to work on smaller samples of fresh cement paste and to impose different temperatures of isothermal cure. From a theoretical point of view, it may be interesting to integrate the effect of deformation and chemical reactions into the equations set, for example considering the larger framework of thermodynamics of non-saturated reactive porous media [29].
References
[1] P. J. Arnold, J.I.H.V.E 37 101 (1969).
[2] D. Whiting, A. Litvin, S. E. Goodwin, A.C.I. Journal 75 299 (1978).
[3] P. Morabito, High Temp.-High Pressures 21 51 (1989).
[4] Y. Xu, D. D. L. Chung, Cem. Conc. Res. 29 1117 (1999).
[5] Y. Xu, D. D. L. Chung, Cem. Conc. Res. 30 59 (2000).
[6] G. Bastian, A. Khelidj, Bull. Liaison Labo. P. et Ch. 200 25 (1995).
[7] G. De Schutter, L. Taerwe, Mag. Conc. Res. 47 203 (1995).
[8] G. J. Gibbon, Y. Ballim, Mag. Conc. Res. 50 229 (1998).
[9] L. E. Copeland, D. L. Kantro, G. Verbeck, Proc. 4th Int. Symp. on Chem. of Cement 1 429 (1960).
[10] A. M. Neville, A., Properties of Concrete (Pitman, London, 1975), pp. 11-57.
[11] J. R. Philip, D. A. De Vries, Trans. Amer. Geophys. Union 38 222 (1957).
[12] D. A. De Vries, Trans. Amer. Geophys. Union 39 909 (1958).
[13] D. A. De Vries, Int. J. Heat Mass Transfer 30 1343 (1987).
[14] Ch. Moyne, S. Azizi, A. Degiovanni, Sixth Int. Drying Symp. IDS’88 1 85 (1988).
[15] H. S. Carslaw, J.-C. Jaeger, Conduction of Heat in Solids (Oxford University Press, London, 1959),
pp.357-352.
[16] J. M. Taplin, Aus. J. Appl. Sc. 10 329 (1959).
[17] M. Geiker (1983), Ph.D. Thesis, (Technical University of Denmark, 1983), 259 p.
[18] H. Kada-Benameur, E. Wirquin, B. Duthoit, Cem..Conc. Res. 30 301 (2002).
[19] R. H. Bogue, La Chimie du Ciment Portland (Eyrolles, Paris, 1952), pp 189-208.
[20] Y. Maltais, J. Marchand Cem. Conc. Res. 27 1009 (1997).
[21] A. Salmon-Gandonnière, DEA Dissertation, ( Saint-Nazaire, France : IUT Saint-Nazaire, 1998), pp 28-31.
[22] B. F. Johannesson, Cem. Conc. Res. 32 1 (2002), article in press.
[23] H. Le Châtelier, Bull. Soc. Enc. Ind. Nat., 5 54 (1900), pp 54-57.
[24] O. Krischer, K. Kröll, Technique du Séchage (trad. CETIAT, Orsay, 1963), pp 335-343.
[25] A. Bouguerra, Ph.D. Thesis (Lyon, France : INSA de Lyon, 1997), pp 163-167.
[26] J.-P. Laurent, C. Guerre-Chaley, Mater. Struct. 28 464 (1995).
[27] P. Crausse, J.-P. Laurent, B. Perrin, Rev. Gén. Therm. 35 95 (1996).
[28] O. T. Farouki, Thermal Properties of Soils (Trans Tech Publication, Clausthal-Zellerfeld, 1986), pp.
54-56.