VEGETATION potentialities in food early warning systems in the Sahelian
region
Bernard TYCHON, Pierre OZER andSouleymane TOURE FONDATION UNIVERSITAIRE LUXEMBOURGEOISE
185, Avenue de Longwy
B-6700 Arlon
Belgium
Email : [email protected] INTRODUCTION and OBJECTIVES
Developing countries in the Sahelian region dedicate most of their activities to agriculture. A year with rainfall deficits or unevenly distributed rainfall during the rainy season often leads to food insecurity in this part of the world (Diop et al. 1996). This food status has to be foreseen early enough to allow decision-makers or financial backers to react fast enough to prevent or reduce the effects of potential famines. Among the available tools to foresee this type of disaster, the combined use of the low resolution NOAA-AVHRR sensor with the IR band of METEOSAT has served up to now in the global vegetation monitoring in Africa. This sensor association is presently used in routine by FAO inside its ARTEMIS Programme (FAO 1999). However, the AVHRR sensor has shown some limitations that did not always allow reaching the initial expectation of such an earth observation sensor. Some of these limits have been reduced even removed with VEGETATION sensor placed on SPOT 4 (Spot-Image 1999).
The main objective of this study is to verify that VEGETATION instrument actually provides information of better quality than those derived from NOAA satellite specifically for the Sahelian region and within the scope of early warning system on food and agriculture of FAO.
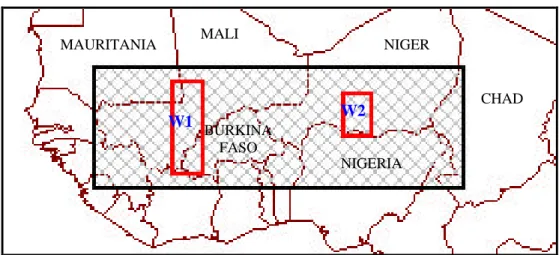
STUDY AREA (Figure 1)
The study area includes the central part of West African Sahel extending from western Mali to eastern Niger. In this area, two windows have been selected to compare the data derived from NOAA (AGRHYMET and FAO) and VEGETATION. These two windows were chosen in function of the ground based station density for which we do have estimated data of yields derived from the DHC_CP agrometeorological software (Bourneuf et al., 1998).
The location of the two windows is presented on figure 1. The first one (W1) covers an area about 170 000 km2 and extends from the Malian northern Sahel to southern Burkina Faso (6°W-17°N ; 4°W-10°N). The second one (W2) covers an area about 73 000 km2 and only concerns the Sahelian belt of Niger (7°E-16°N ; 9°E-13°N).
Figure 1 : Location of the two windows (W1 et W2) selected for the study.
METHODOLOGY
Four criteria were selected to compare remote observations from the two satellites:
- The first criterion is based on the correlation between local yields of millet calculated with an agrometeorological model (DHC_CP) and the NDVI from NOAA and VGT. The NOAA image processing chain used in the AGRHYMET Center has been developed by the USGS (J. C. Eidenshink et al. 2000).
- The second criterion checks the potentiality of spatial extrapolation of agrometeorological parameters. Here, the chosen criterion allows determining the start of the vegetation season with remote sensing based on a set of image series. Results from the two remote sources are compared with a map calculated with an agrometerological approach that fixes sowing date according to a given quantity of rainfall per 10-day period.
- A third criterion checked the saturation level of both sensors in regions with high vegetation density.
- Finally, pixel location was analyzed inside a window crossed by the Niger River. This study covers the 1998 rainy season (April to October).
RESULTS Yields correlation
Three vegetation indicators derived from the NDVI data of VEGETATION and NOAA have been used for the comparison with the estimated yields in the ground based station at the local scale.
These three vegetation indicators are:
1. The Length of the Growing Period (LGP).
W1 W2 MALI BURKINA FASO MAURITANIA NIGERIA CHAD NIGER
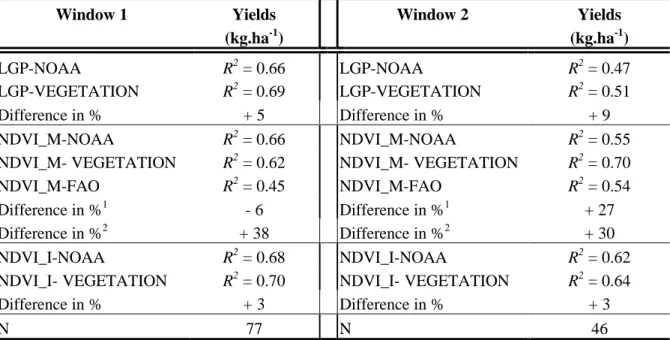
than those derived from the NOAA data. This improvement is, in some cases, not negligible as it can reach 27%.
Once the results obtained by VEGETATION are compared to the ARTEMIS operational system developed and currently used in FAO, the improvements are of 38 and 30% (respectively for W1 and W2).
Window 1 Yields (kg.ha-1) Window 2 Yields (kg.ha-1) LGP-NOAA R2 = 0.66 LGP-NOAA R2 = 0.47 LGP-VEGETATION R2 = 0.69 LGP-VEGETATION R2 = 0.51 Difference in % + 5 Difference in % + 9 NDVI_M-NOAA R2 = 0.66 NDVI_M-NOAA R2 = 0.55
NDVI_M- VEGETATION R2 = 0.62 NDVI_M- VEGETATION R2 = 0.70
NDVI_M-FAO R2 = 0.45 NDVI_M-FAO R2 = 0.54
Difference in %1 - 6 Difference in %1 + 27
Difference in %2 + 38 Difference in %2 + 30
NDVI_I-NOAA R2 = 0.68 NDVI_I-NOAA R2 = 0.62
NDVI_I- VEGETATION R2 = 0.70 NDVI_I- VEGETATION R2 = 0.64
Difference in % + 3 Difference in % + 3
N 77 N 46
Table 1 : Comparison of the determination coefficients (R2) linking the « Length of the Growing Period LGP » indicator, the « maximum value of NDVI-NDVI_M » indicator, the « integrated NDVI curve during the Growing Period-NDVI_I » indicator and the local ground based yields estimations. Difference in % = improvement (+) or reduction (-) of the yields forecast derived from the VEGETATION data in comparison with the NOAA1 data and the ARTEMIS-FAO2 data. N = number of points used to establish the relationship.
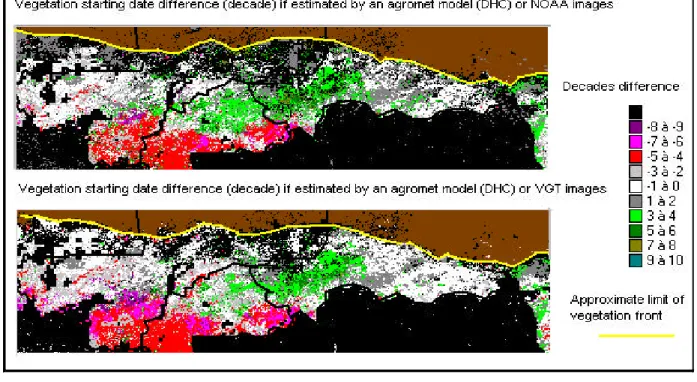
Starting date of the vegetation season
In Sahel, the starting date of the vegetation season can approximately be assimilated with the sowing date (Rasmussen 1992 ; Groten 1993). It is therefore possible to recover, by remote sensing, the likely periods for sowing over a huge area such as Sahel. To confront this approach with an agrometeorological method which will be taken as a reference, the results of an agrometeorological indicator have been used. This indicator fixes the sowing date following a criteria established in the DHC_CP software : 10 mm of rainfall over a 10-day period. The results of the confrontation are presented at the figure 2 where the two remote sensing sources are compared with a map calculated with the agrometeorological approach.
Figure 2 : Comparison between the sowing dates estimated by remote sensing (NOAA and VEGETATION) and DHC_CP (agrometeorological model)
On figure 2, white and gray areas represents zones where a good correlation between both approaches can be considered. These zones cover a larger area with the results derived from the VEGETATION images. This shows the better capacities of this sensor to detect the starting dates of the vegetation period. In this particular case, the use of remote sensing is particularly interesting. A good example is given on the area around the Niger River in Mali which is highlighted by its red color, underlining a 40 to 50 days difference between the satellite data and the agrometerological approach. This difference is clearly due to the fact that the pixel resolution is of 1 km for the remote sensing information compared to the 5 km pixel used in the agrometerological model. Such details are therefore lost in the model calculation. The red areas in southern Mali and Burkina Faso result from an artifact. As a matter of fact, the agrometerological model starts its simulations in May while satellite data are available since April. Therefore, as the vegetation starts growing in April in the Sudanese belt, all these red areas have not to be considered in the comparative analysis.
Another interesting point to notice is the presence of the green color extending from central Burkina Faso to central Niger. This green color indicates that the agrometerological model has derived a starting date of the vegetation season before it could be observed by remote sensing. This difference can be explained by the fact that early rainfall exceeding 10 mm on a 10-day period have been followed by a dry spell. Therefore, the vegetation did not start its seasonal cycle at that date but several weeks afterwards as seen on the satellite data. This
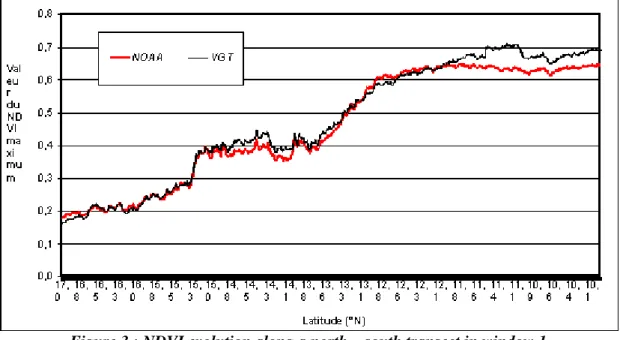
NDVI 0.35 and 0.4 followed by a faster increase of the AVHRR-NDVI between 0.4 and 0.6 that leads to a status where NOAA-NDVI is above VGT-NDVI around 0.6. Above 0.62, whereas VGT continue increasing, the AVHRR sensor seems to saturate. Along this 770 km transect, the NDVI data range is 17% larger for VGT than NOAA.
Figure 3 : NDVI evolution along a north – south transect in window 1.
Pixel location accuracy
The area of the Niger River between Tombouctou and Gao was retained for a particular analysis of the pixel positioning. This region with very few vegetation allows an easy recovering of the river pixels. Figure 4 shows for the two sensors respectively the mean and the standard deviation of a set of 21 images from the first decade of April 1998 to the last decade of October 1998.
NOAA-AVHRR VEGETATIO N
Figure 4 : Pixel location around the Niger River
Mean values of the pixel time series provide equivalent images with the two sensors. Especially, the Niger River width does not appear significantly different (e.g. brown color). Both NOAA and VGT give an estimated river width of about two to three pixels. On the other hand, the standard deviation image of the images series presents a systematic higher value for NOAA. A possible explanation of this scattering increase in the pixel series might be found in the change, with the different decades, of the geographical coordinates of a same area. MEAN
However, if it was correct, pixels of the river with NOAA images should present a higher difference of standard deviation with the standard deviation of the neighbors pixels. This is not checked : the differences of standard deviation between river pixels and their direct neighbors pixels are similar for the two sensors. This study of the pixel location accuracy should be improved but, at the present time, it does not underline a sensible advantage of VGT compared to NOAA.
CONCLUSIONS
The VEGETATION instrument demonstrated its higher capacities for vegetation monitoring in the Sahelian region within the scope of agricultural campaign monitoring and food early warning systems in comparison with the NOAA-AVHRR sensor presently used for this topic. These potentialities should now be used to replace NOAA images in the different monitoring systems. Moreover, we think that VGT should be used for other applications than those presently run by NOAA. Especially, it should be necessary to look at the potentialities of the sensor in the monitoring of small areas (< 100 km²). It should also be worth improving the integration of remote sensing information inside agrometeorological models in order to valorize this new type of information in a quantitative way.
REFERENCES BIBLIOGRAPHIQUES
BOURNEUF E., CHAMPAGNE O., GIRARD X., PAGNOUX A. & VASSEUR L., 1998. Diagnostic hydrique des Cultures, version 2.3 Centre Agrhymet, Niamey.
DIOP M., HOUNDENOU C. & RICHARD Y., 1996. Variabilité des dates de début et de fin de l’hivernage au Sénégal (1950-1991). Publications de l’Association Internationale de Climatologie, 9 : 430-436. EIDENSHINK J. C. & FAUNDEEN J. L., 2000. 1-km AVHRR global land data set : first stages in implementation, U.S. Geological Survey, EROS Data Center, Sioux Falls, South Dakota 57198, U.S.A., http://edcdaac.usgs.gov/1KM/paper.html#proc2.htm
FAO, 1999, Sahel : situation météorologique et état des cultures en 1999, rapport n° 3 – 11 août 1999,
http://www.fao.org/giews/french/smiar.htm.
GROTEN S.M.E., 1993, NDVI-crop monitoring and early yield assessment of Burkina Faso, Int. J. Remote Sensing, vol 14, n°8, pp1495-1515.
RASMUSSEN M.S., 1992, Assessment of millet yields and production in nothern Burkina Faso using integrated NDVI from AVHRR, Int. J. Remote Sensing, vol 13, n°18, pp3421-3442.
Spot-Image, 1999, VEGETATION User guide,
http://www.spotimage.fr/data/images/vege/VEGETAT/book_1/e_frame.htm
This research is supported by the Services Fédéraux des Affaires Scientifiques Techniques et Culturelles de Belgique under contract acronym T4/19/54.