Accuracy and Performance of Continuous Glucose Monitors in Athletes
Felicity Thomas,* Christopher G. Pretty,* Matthew Signal,* Geoffrey Shaw,* J. Geoffrey Chase*
* Department of Mechanical Engineering, University of Canterbury, Private Bag 4800, Christchurch 8140, New Zealand
** Department of Intensive Care, Christchurch Hospital, Private Bag 4710, Christchurch, New Zealand
Felicity Thomas** [email protected] Chris Pretty [email protected] Matthew Signal [email protected] Geoffrey M Shaw [email protected] J. Geoffrey Chase [email protected] ** Corresponding author
Conflicts of Interest: The authors declare that they have no conflicts of interests. Funding was provided from post-graduate study grants from the University of Canterbury
Acknowledgements: No acknowledgements
Abstract: Continuous glucose monitoring (CGM) devices, with their 1-5 minute measurement interval, allow blood glucose dynamics to be captured more frequently and less invasively than traditional measures of blood glucose concentration (BG). These devices are primarily designed for the use in type 1 and type 2 diabetic patients to aid BG regulation. However, because of their increased measurement frequency and reduced invasiveness CGM devices have been recently applied to other subject cohorts, such as intensive care patients and neonates. One unexamined cohort is athletes. Continuous monitoring of an athlete’s BG has the potential to increase race performance, speed recovery, and aid training, as BG can reflect metabolic and inflammatory conditions. However, before these benefits can be realized the accuracy and performance of CGM devices in active athletes must be evaluated.
Two Ipro2 and one Guardian Real-time CGM devices (Medtronic Minimed, Northridge, CA, USA) were inserted into 10 subjects (resting HR < 60 beats per minute (bpm), training 6-15hrs per week). For each participant a fasting continuous exercise test was carried out until failure, ~90mins, and glucoses boluses were given at 30mins (0.5g/kg) and failure (1g/kg). Reference BG measurements were taken every 10min for the first 60min, every 5min until failure + 30min and every 10min until failure + 60min with an Abbott Optimum Xceed glucometer. Pre-glucose bolus, all sensors perform better compared to results seen in diabetic cohorts with median mean absolute relative difference (MARD) of 9.7%, 9.6% and 11.1% for the two Ipro2’s and the Real-time, respectively. However, there is increased error post-bolus likely due to the gradient of BG change being higher, so the delay in transport to interstitial fluid and sensor results in a larger discrepancy from reference values. CGM devices agree very well with each other during rigorous exercise with median cross-correlation coefficients between 0.88 and 0.97 for the different sensor pairings. This good correlation between all three signals suggests the error between glucose measured by CGM and from blood is not
random, but likely due to transport/uptake effects. As the interstitial fluid is the medium from which glucose enters muscle cells, this CGM value might be more useful than BG in determining glucose availability for athletes.
1. INTRODUCTION
Continuous glucose monitoring (CGM) devices, with their 1-5 minute measurement interval, allow blood glucose concentration (BG) dynamics to be captured more frequently and less invasively than traditional measures of BG. CGM devices typically consist of a small pager-like monitoring device that receives a signal from a sensor inserted into the subcutaneous layer. The sensor creates a signal using
the glucose oxidase reaction and produces a current proportional to the glucose concentration in the surrounding interstitial fluid. Calibration algorithms convert the signal into a BG value by comparing it to calibration BG measurements, which are entered into the monitor by the user every ~6-8hrs.
These devices are primarily designed for the use in type 1 and type 2 diabetic individuals to aid BG regulation and are well studied in this cohort [1, 2]. However, because of the increased measurement frequency and reduced invasiveness they have recently been applied to other cohorts, such as
intensive care patients and neonates with varying success [3-10]. Another cohort where CGM may be beneficial is athletes. This cohort is yet to be thoroughly investigated but optimisation of an athlete’s BG has the potential to increase race performance, speed recovery, and aid training [11-15].
In particular, there is ongoing research to improve carbohydrate delivery and oxidation, resulting in
less accumulation of carbohydrate in the gastrointestinal track to decrease gastrointestinal problems during prolonged exercise [11]. CGM data could aid optimal carbohydrate delivery by allowing an athlete to know the best time and the amount of carbohydrate to consume. However, before these benefits can be realised, the accuracy and performance of CGM devices in active, trained athletes
must be evaluated, which has not been done before and is a very different cohort to those with metabolic dysfunction. Hence, the aim of this paper is to characterise the accuracy and performance of CGM in athletes while exercising in a manner representative of an intense, endurance event or
2. SUBJECTS & METHODS 2.1 Subjects and Experiments
Ten fit, healthy subjects were recruited under informed written consent for this study. Table 1 summarizes the cohort demographics. Seven out of the ten participants cycled regularly and all
subjects trained >6 hours per week in a range of endurance based sports, predominantly running and cycling. The research procedures and use of data were approved by the University of Canterbury Ethics Committee.
Table 1. Cohort demographics of the participants. Data are presented as median [interquartile range] where appropriate Number 10 Age (yr) 28 [23 37] Gender (M/F) 7/3 BMI (kg/m2) 22 [21 24] Resting HR (bpm) 55 [53 56] VO2max (mL/kg/min) 46 [39 59]
Trained Cyclist (Y/N) 7/3
Length of CGM data (hr) 140 [105 141]
Two Ipro2 and one Guardian Real-time CGM devices (Medtronic Minimed, Northridge, CA, USA) were inserted into the abdomen of each athlete ~24 hours prior to the first ‘fasted exercise test’. The CGM device remained in each subject for 4 - 6 days. For all athletes, the Ipro CGM devices were both
inserted in to the left side of the abdomen and the Guardian in the right side. These devices are referred to as sensor 1 (SG1), the lower left abdomen sensor, sensor 2 (SG2), the upper left abdomen sensor and real-time sensor, the right abdomen sensor (SGrealtime).
Figure 1: Photo showing the locations of each CGM devices
During the 6 days of CGM:
• Blood glucose was measured 4 times per day prior to meals and sleeping. These
measurements were used to calibrate the device (calibration BG)
• All meals and snacks were recorded and carbohydrate intake calculated
• Any additional exercise was also recorded and energy expenditure estimated
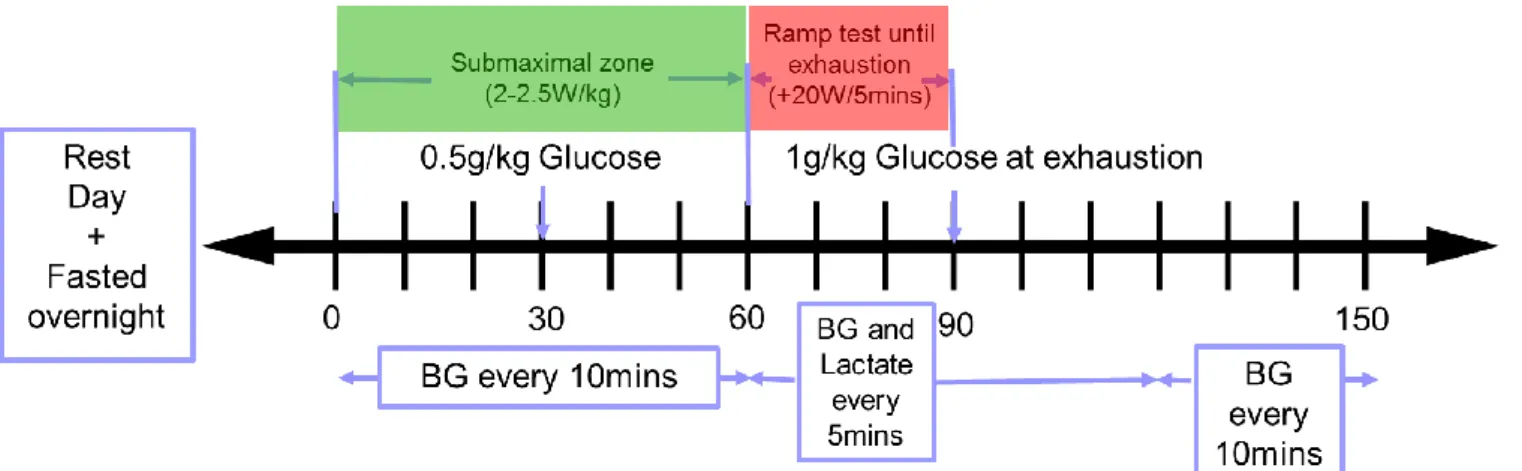
Figure 2: Schematic of exercise trial protocol
SG1
SG2
SGrealtime
Fasting exercise tests were carried out as shown in Figure 2. Subjects were required not to exercise the day before the test. On the day of testing, the exercise protocol typically began at 8am and is
defined:
• 0-60min: Cycling on a stationary trainer (Cyclus 2, RBM elektronik-automation GmbH, Lepzig,
Germany) after overnight fasting in the submaximal endurance HR zone <70%VO2max
resulting in a resistance set to 2W/kg for female and untrained cyclists or 2.5W/kg.
• 30min: Consume a 0.5g/kg of body weight (30-45g) glucose drink
• 60 – exhaustion (~90min): Steadily increase effort until exhaustion by increasing required
power by 20W every 5 minutes.
• Exhaustion: Consume a 1g/kg of body weight (60-90g) glucose drink
Reference BG measurements:
• 0-60min: Every 10min
• 60 – exhaustion+ 30min (~120min): Every 5min
• Exhaustion+30min (~120min) - exhaustion+60min (~150min) : Every 10min
Reference measurements were not used for calibration.
Other measurements:
- Body weight, BMI, Body composition Analyser (InBody230, InBody Bldg, Seoul, Korea)
- Indirect calorimetry (MetaLyzer 3B - R2, CORTEX Biophysik GmbH, Lepzig, Germany)
Reference and calibration BG measurements were taken using capillary finger stick measurements
and the Abbott Optimum Xceed (Abbott Diabetes Care, Alameda, CA) glucometer. The Abbott device has reported error of 5-10% [7, 16-18].
2.2 Analysis
To assess the accuracy of the CGM during exercise the mean absolute relative difference (MARD) was calculated between reference BG measurements collected during the fasting tests and the CGM trace:
𝑀𝐴𝑅𝐷 = 𝑚𝑒𝑎𝑛(𝑎𝑏𝑠 (𝐶𝐺𝑀−𝐵𝐺𝐵𝐺 )) ∗ 100 (Eq. 1)
MARDs were assessed during three different phases during the trial, 0-30min, 30min-exhuastion and exhaustion – exhaustion+60min. MARD was also calculated over the entire test. This consideration of different phases allowed an assessment of accuracy when glucose levels were rapidly changing, after
the each glucose bolus, and when they are relatively stable, during exercise.
To assess the agreement of the CGM devices during the exercise test, zero-lag cross-correlation was applied. Zero-lag cross-correction is the dot product applied to as shown in Equation 2 to two equal
length signals with no time shift, and yields a measure to measure agreement.
cos 𝜃 = ( 𝐴.𝐵
||𝐴||||𝐵||) Eq 2.
Where A = [a1, a2 …. an] represents the n x 1 vector of measurements from one CGM signal and B = [b1,
b2 …. bn] the n x 1 vector of measurements from the other. The resultant angle,𝜃, shows the trend
similarity between two vectors and its cosine has values from -1 and +1 demonstrating opposing to complete agreement. Thus, it uses the inner product definition to define how much of vector A is projected on to vector B, where 1 indicates equal vectors. This resulted value is referred to as the zero lag correlation co-efficient. All signals were first mean-centred to remove bias.
3. RESULTS & DISCUSSION
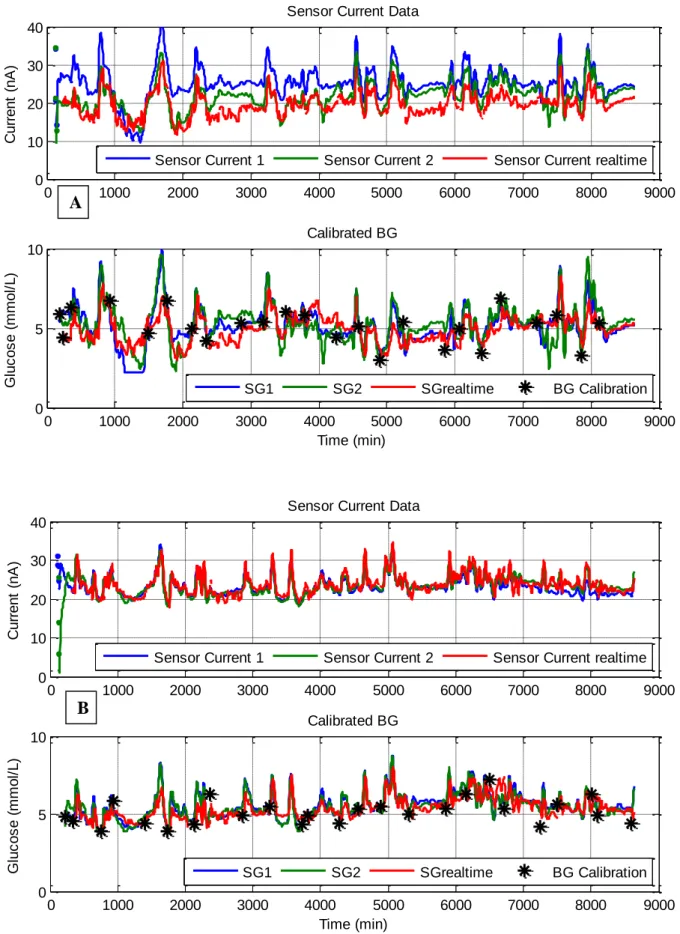
Figure 3 provides an example of the good sensor agreement seen over the 6 days of monitoring. Both sensor current and sensor glucose visually agree well across the entire 6 days of monitoring. The
results in Figure 4, Table 2 and Table 3 clearly show Ipro2 CGM devices, SG1 and SG2, are accurate during intense exercise. The MARD values in Table 2 and Table 3 are equivalent if not better than the
performance reported for CGM in diabetic subjects [15, 19-22] .
Bailey et al. [15] reported an overall MARD of 13.6% from a study using the same sensors in 90 type 1 diabetic subjects. Overall, the Ipro2 devices match this performance and perform better than
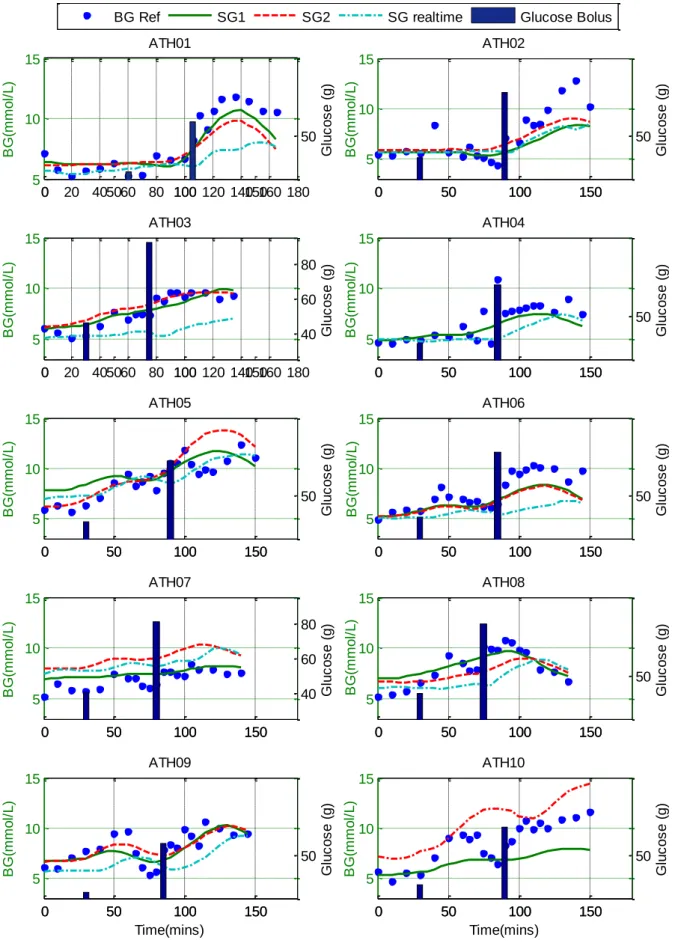
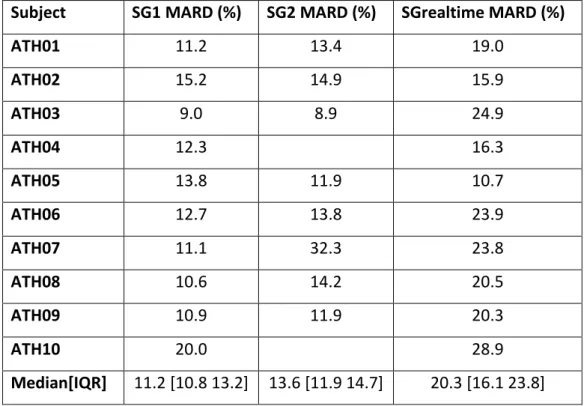
expected during 0 – 30min of steady state exercise with median MARD of 9.7% and 9.6% for SG1 and SG2, respectively. Even during times of rapid glucose change after the glucose boluses were given and changes in exercise intensity (Figure 4) the Ipro2 CGM devices prove accurate resulting in an overall median [IQR] MARD of 11.2 [10.8 13.2]% and 13.6 [11.9 14.7]%.
However, the Guardian real-time performance is mixed. The literature reports an overall MARD of 15-17.8% for Guardian CGM in diabetic individuals [20-22]. During the first 30min of exercise the Guardian out-performs the expected result with a median [IQR] MARD of 11.1 [7.2 16.0] %. However, across the
entire test the Guardian devices only achieved a median [IQR] MARD of 20.3 [16.1 23.8] %. This result indicates the Guardian struggles to track the fast changing glucose dynamics once the glucose boluses are taken and exercise intensity changes.
The Guardian device is calibrated in real-time and provides a real time approximation of blood glucose
levels on a monitor that communicates wirelessly with the sensor. This real-time approximation means that the device can only use the previous and current calibration measurements to calibrate the current signal from the interstitial fluid. In comparison, the Ipro2 devices (SG1 ad SG2) store all
current data on the sensor which is then downloaded at the end of monitoring and calibrated retrospectively. Thus, both future and past measurements can be used for calibrating the iPro2 signal. However, to generate a real-time control algorithm for athlete nutrition a real time device like the
guardian would be necessary. However these issues could be offset if glucose ingestion, such as from an energy drink, was known.
Figure 3: Examples of current and sensor glucose data captured over the 6 days of monitoring. Subject ATH03 is presented in A and ATH06 in B.
0 1000 2000 3000 4000 5000 6000 7000 8000 9000 0 5 10 Calibrated BG G lu c o s e ( m m o l/ L ) Time (min) 0 1000 2000 3000 4000 5000 6000 7000 8000 9000 0 10 20 30 40 C u rr e n t (n A )
Sensor Current Data
Sensor Current 1 Sensor Current 2 Sensor Current realtime
SG1 SG2 SGrealtime BG Calibration 0 1000 2000 3000 4000 5000 6000 7000 8000 9000 0 5 10 Calibrated BG G lu c o s e ( m m o l/ L ) Time (min) 0 1000 2000 3000 4000 5000 6000 7000 8000 9000 0 10 20 30 40
Sensor Current Data
C u rr e n t (n A )
Sensor Current 1 Sensor Current 2 Sensor Current realtime
SG1 SG2 SGrealtime BG Calibration
A
Figure 4: Blood glucose reference values. CGM values and glucose bolus data for each athlete. Ath01-Ath10 in descending order as reading from right to left.
0 20 40 60 80 100 120 140 160 180 5 10 15 B G (m m o l/ L ) ATH01 0 50 100 150 50 G lu c o s e ( g ) 0 50 100 150 5 10 15 B G (m m o l/ L ) ATH02 0 50 100 150 50 G lu c o s e ( g ) 0 20 40 60 80 100 120 140 160 180 5 10 15 B G (m m o l/ L ) ATH03 0 50 100 150 40 60 80 G lu c o s e ( g ) 0 50 100 150 5 10 15 B G (m m o l/ L ) ATH04 0 50 100 150 50 G lu c o s e ( g ) 0 50 100 150 5 10 15 B G (m m o l/ L ) ATH05 0 50 100 150 50 G lu c o s e ( g ) 0 50 100 150 5 10 15 B G (m m o l/ L ) ATH06 0 50 100 150 50 G lu c o s e ( g ) 0 50 100 150 5 10 15 B G (m m o l/ L ) ATH07 0 50 100 150 40 60 80 G lu c o s e ( g ) 0 50 100 150 5 10 15 B G (m m o l/ L ) ATH08 0 50 100 150 50 G lu c o s e ( g ) 0 50 100 150 5 10 15 Time(mins) B G (m m o l/ L ) ATH09 0 50 100 150 50 G lu c o s e ( g ) 0 50 100 150 5 10 15 Time(mins) B G (m m o l/ L ) ATH10 0 50 100 150 50 G lu c o s e ( g )
Table 2: MARD results for each athlete and sensor combination for the entire duration of the test. The gaps in column three represent where sensor failures prevented the collection of CGM data.
Subject
SG1 MARD (%)
SG2 MARD (%)
SGrealtime MARD (%)
ATH01
11.2
13.4
19.0
ATH02
15.2
14.9
15.9
ATH03
9.0
8.9
24.9
ATH04
12.3
16.3
ATH05
13.8
11.9
10.7
ATH06
12.7
13.8
23.9
ATH07
11.1
32.3
23.8
ATH08
10.6
14.2
20.5
ATH09
10.9
11.9
20.3
ATH10
20.0
28.9
Median[IQR]
11.2 [10.8 13.2] 13.6 [11.9 14.7]
20.3 [16.1 23.8]
Table 3: MARD presented as median [IQR] of the cohort for each stage during the exercise test.
0 – 30min
30min – Exhaust
Exhaust – Exhaust+60min
SG1
9.7 [6.0 17.8]
11.3 [8.9 13.8]
11.4 [8.5 15.7]
SG2
9.6 [7.3 17.5]
12.5 [10.1 17.4]
17.0 [12.1 20.3]
SGrealtime
11.1 [7.2 16.0]
19.9 [16.9 23.5]
21.1 [18.2 27.0]
More accurate results during steady state exercise compared to published results in diabetes cohorts
are likely due to interstitial fluid not being actively pumped like blood. Interstitial fluid relies on muscle movement to circulate and mix. Thus, it can be expected that during exercise more accurate results are seen as the rigorous movement and increased overall blood flow allows rapid mixing and
equilibrium between the blood and interstitial fluid, as well as more accurate reference BG measurements due to high skin temperatures and increased circulation, where Haupt et al. [23] and King, et al. [24] suggest lower skin temperatures lead to BG meters reading lower than expected
However, as evident with the real-time calibrated device, rapid mixing between the intestinal and blood is not enough to ensure ideal performance when large disturbances, such as glucose boluses,
are added to the system. This increased error is likely due to the gradient of BG change being higher, so the delay in transport to interstitial fluid and sensor results in a larger discrepancy in measured values compared to a blood-based reference.
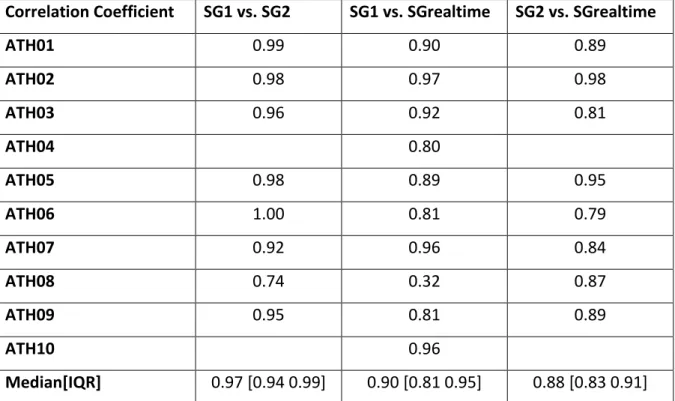
The zero-lag correlation between all three sensors is very good, as seen in Table 4. SG1 and SG2 have a median [IQR] correlation coefficient of 0.97 [0.94 0.99]. It is expected that these signals would correlate the best as they are the same device inserted in the same side of the abdomen. Both SG1 and SG2 also correlate very well with the SGrealtime, with median correlation coefficients of 0.90 and
0.88 respectively. This good correlation between all three signals suggests that the error seen between glucose concentrations measured by CGM and from blood is not random, but likely due to effects such as transport delays and local glucose uptake. As the interstitial fluid is the medium from which glucose
enters muscle cells, this CGM value might be more useful than BG in determining glucose availability for athletes.
Table 4: Correlation coefficient for each sensor combination using the CGM data generated during the exercise test.
Correlation Coefficient
SG1 vs. SG2
SG1 vs. SGrealtime
SG2 vs. SGrealtime
ATH01
0.99
0.90
0.89
ATH02
0.98
0.97
0.98
ATH03
0.96
0.92
0.81
ATH04
0.80
ATH05
0.98
0.89
0.95
ATH06
1.00
0.81
0.79
ATH07
0.92
0.96
0.84
ATH08
0.74
0.32
0.87
ATH09
0.95
0.81
0.89
ATH10
0.96
Median[IQR]
0.97 [0.94 0.99]
0.90 [0.81 0.95]
0.88 [0.83 0.91]
3.1 Limitations
This study is a proof of concept demonstration and thus the relatively small data set is a limitation. These tests were trialled in 10 athletes and results are likely to vary between individuals. However, there is a clear difference in signal quality between retrospective and real time devices, as well as between steady state exercise and periods of glucose disturbance. These differences also provide
insight into how these devices might be more optimally used in the target, more sedentary cohort. Finally, the results justify investment in further research in to CGM and its use to optimise metabolism in athletic subjects.
4. CONCLUSIONS
Optimisation of an athlete’s BG via intra-event nutrition has the potential to increase race performance, speed recovery and aid training. During steady state exercise, all sensors perform better than results reported for diabetes cohorts, with median MARD of 9.7%, 9.6% and 11.1% for SG1, SG2 and SGrealtime, respectively. However, there is increased error after a glucose bolus likely due to the
gradient of BG change being higher, so the delay in transport to interstitial fluid and sensor results in a larger discrepancy to measured blood based reference values. CGM devices agree very well with each other during rigorous exercise with median zero-lag cross-correlation coefficients between 0.88
and 0.97 for the different sensor pairings. This good correlation between all three signals suggests the error between glucose measured by CGM and from blood is not random, but likely due to transport/uptake effects differing the blood and CGM values. As the interstitial fluid is the medium from which glucose enters muscle cells, this CGM value might be more useful than BG in determining
REFERENCES
1. Gandhi, G.Y., et al., Efficacy of continuous glucose monitoring in improving glycemic control and reducing hypoglycemia: a systematic review and meta-analysis of randomized trials. J Diabetes Sci Technol, 2011. 5(4): p. 952-65.
2. Hoeks, L.B., W.L. Greven, and H.W. de Valk, Real-time continuous glucose monitoring system for treatment of diabetes: a systematic review. Diabet Med, 2011. 28(4): p. 386-94.
3. Chee, F., T. Fernando, and P.V. van Heerden, Closed-loop glucose control in critically ill patients using continuous glucose monitoring system (CGMS) in real time. IEEE Trans Inf Technol Biomed, 2003. 7(1): p. 43-53.
4. Holzinger, U., et al., Real-time continuous glucose monitoring in critically ill patients: a prospective randomized trial. Diabetes Care, 2010. 33(3): p. 467-72.
5. Brunner, R., et al., Accuracy and reliability of a subcutaneous continuous glucose-monitoring system in critically ill patients. Critical Care Medicine, 2011. 39(4): p. 659-664.
6. Rabiee, A., et al., Numerical and clinical accuracy of a continuous glucose monitoring system during intravenous insulin therapy in the surgical and burn intensive care units. J Diabetes Sci Technol, 2009. 3(4): p. 951-9.
7. Signal, M., Continuous Glucose Monitoring and Tight Glycaemic Control in Critically Ill Patients in Bioengineering 2013, University of Canterbury University of Canterbury.
8. Signal, M., et al., Continuous glucose monitors and the burden of tight glycemic control in critical care: can they cure the time cost? J Diabetes Sci Technol, 2010. 4(3): p. 625-35.
9. Beardsall, K., et al., The continuous glucose monitoring sensor in neonatal intensive care. Archives of Disease in Childhood-Fetal and Neonatal Edition, 2005. 90(4): p. F307-F310.
10. Harris, D.L., et al., Continuous Glucose Monitoring in Newborn Babies at Risk of Hypoglycemia. Journal of Pediatrics, 2010. 157(2): p. 198-202.
11. Jeukendrup, A.E., Carbohydrate intake during exercise and performance. Nutrition, 2004. 20(7-8): p. 669-77.
12. Achten, J., et al., Higher dietary carbohydrate content during intensified running training results in better maintenance of performance and mood state. J Appl Physiol (1985), 2004. 96(4): p. 1331-40. 13. Koopman, R., et al., Combined ingestion of protein and carbohydrate improves protein balance during
ultra-endurance exercise. Am J Physiol Endocrinol Metab, 2004. 287(4): p. E712-20.
14. Halson, S.L., et al., Effects of carbohydrate supplementation on performance and carbohydrate oxidation after intensified cycling training. J Appl Physiol (1985), 2004. 97(4): p. 1245-53.
15. Bailey, T.S., et al., Accuracy and acceptability of the 6-day Enlite continuous subcutaneous glucose sensor. Diabetes Technol Ther, 2014. 16(5): p. 277-83.
16. Abbott, Abbott Optium Test-Strip Packet Insert. 2010, Abbott Diabetes Care Ltd UK
17. Thomas, F., et al., Continuous Glucose Monitoring in Newborn Infants: How Do Errors in Calibration Measurements Affect Detected Hypoglycemia? J Diabetes Sci Technol, 2014. 8(3): p. 543-550.
18. Thomas, F., et al., Glucometer Performance in the Intensive Care Unit, in 14th Annual Diabetes Technology Meeting (DTM). 2014: Bethesda, MD.
19. Keenan, D.B., et al., Accuracy of the Enlite 6-day glucose sensor with guardian and Veo calibration algorithms. Diabetes Technol Ther, 2012. 14(3): p. 225-31.
20. Kovatchev, B., et al., Comparison of the numerical and clinical accuracy of four continuous glucose monitors. Diabetes Care, 2008. 31(6): p. 1160-4.
21. Matuleviciene, V., et al., A clinical trial of the accuracy and treatment experience of the Dexcom G4 sensor (Dexcom G4 system) and Enlite sensor (guardian REAL-time system) tested simultaneously in ambulatory patients with type 1 diabetes. Diabetes Technol Ther, 2014. 16(11): p. 759-67.
22. Calhoun, P., et al., Performance comparison of the medtronic sof-sensor and enlite glucose sensors in inpatient studies of individuals with type 1 diabetes. Diabetes Technol Ther, 2013. 15(9): p. 758-61. 23. Haupt, A., et al., The effects of skin temperature and testing site on blood glucose measurements taken
by a modern blood glucose monitoring device. Diabetes Technol Ther, 2005. 7(4): p. 597-601.
24. King, J.M., C.A. Eigenmann, and S. Colagiuri, Effect of ambient temperature and humidity on performance of blood glucose meters. Diabet Med, 1995. 12(4): p. 337-40.
![Table 1. Cohort demographics of the participants. Data are presented as median [interquartile range]](https://thumb-eu.123doks.com/thumbv2/123doknet/5470279.129857/4.892.287.610.448.784/table-cohort-demographics-participants-data-presented-median-interquartile.webp)