XRF majoR and tRace element deteRmination
in Fe-ti oXide mineRals
Jean-Clair DUCHESNE & Guy BOLOGNE
(1 figure and 8 tables)
Department of Geology, University of Liège, B20, 4000 Sart Tilman
aBstRact. An XRF method describes the bulk composition (host + exsolved phases) analysis of magnetite and ilmenite grains obtained by physical methods of separation. Fe, Ti, Mn, Mg, Al, Ca, and Si are measured on glass discs (1:20 dilution in Li borate) and V, Cr, Ni, Co, Cu, Zn, S are determined on pressed pellets of ca. 1.5 g of magnetite, and the same elements plus Zr and Nb on ilmenite 1.5 g-pressed pellets. When necessary, matrix effects are corrected with the Compton line (absorption) or by measuring the effect of Ti on V and Cr intensities (enhancement). A variety of reference samples are used to assess the accuracy of the method. For Fe, Ti and Mg the accuracy ranges between 0.6% and 3.2%, and for V and Cr between 5.6 and 7.6%. Detection limits and reproducibility are acceptable for most geochemical studies. The method meets the current needs of the geochemical interpretation of Fe-Ti oxide minerals and deposits.
KeYWoRds: ilmenite, magnetite, titanomagnetite, trace element geochemistry, Fe-Ti deposits
introduction
XRF (X-ray fluorescence spectrometry) is a widely used technique for the analysis of geological material (Potts, 1987). Since Norrish & Hutton (1969), major elements in silicate rocks are commonly determined by analysis on glass discs made up by melting and dissolving the sample powder in borate flux. This method of sample preparation permits to overcome particle size and mineralogical effects, and allows careful matrix corrections due to inter-element absorption and enhancement. This method has been used in our laboratory for more than 30 years (Bologne & Duchesne, 1991). On the other hand, trace elements in silicate rocks are preferably measured on compressed powder pellets, particularly for heavy elements (Z>26) whose matrix corrections are monitored by the Compton scattered tube line (Reynolds, 1967). Glass discs can also be used for trace elements but due to the dilution of the sample in the glass the method is less sensitive than on crude powder pellets (Enzweiler & Webb, 1996). The large number of reference samples now available (e.g. Govindaraju, 1994) permits to ascertain the accuracy of the results and the technological developments of modern instruments bring the precision and reproducibility of the determination far beyond the required ranges for usual petrogenetic interpretations.
The XRF analysis of minerals can in principle be performed by the same approach on glass disc and powder pellets. In practice these methods are, however, more difficult to implement because of: (1) the amplitude of the inter-element effects due to the large variation of element contents; indeed most minerals are solid solutions in which some elements can vary from zero to several tens percents; (2) the lesser number- if not the lack- of reference samples of good quality, covering the number of interesting elements and the range of possible major and trace element
variations, the latter varying frequently over several orders of magnitude; (3) the high accuracy needed for stoechiometric consideration and/or for industrial purposes; (4) the small quantities generally available for analysis, particularly when the minerals are obtained by physical methods of separation from rock samples.
We present in this work the analysis methods for Fe-Ti oxide minerals that we have implemented to study the petrology and geochemistry of these minerals. Ilmenite is a solid solution between Fe2O3 (hematite), FeTiO3 (ilmenite sensu stricto) and MgAl2O4 (spinel). The major elements vary up to 62%TiO2 (on altered grains); MgO from 0 to 4.5% or more (e.g. Charlier et al., 2008). Magnetite is built up with a mixture of Fe3O4 (magnetite sensu stricto), Fe2TiO4 (ulvöspinel), FeTiO3 (ilmenite) and MgAl2O4 (spinel) in various proportions. TiO2 can vary from say 0.5% up to 28% (see e.g. Duchesne et al., 2006), the V content from a few ppm to the percent level (Charlier et al., 2007; Duchesne et al., 2006)
For logistical consideration we try to achieve the highest accuracy in a minimum time which is adapted for each element to its geochemical interest or industrial value. In other words we focus on the accuracy of major element determination because they are crucial in determining the fO2-T conditions of equilibrium following e.g. the QUILF method (Andersen et al., 1993) or Lattard’s approach (Lattard et al., 2005; Sauerzapf et al., 2008). These elements are also important in assessing the economic value of an ilmenite ore. Some elements, such as Mg, Ca, Al and Cr, are polluting elements in the industrial processing of ilmenite (e.g. Nair et al., 2002). For the trace elements, Cr and V are excellent tracers of petrogenetic processes and are thus worth being more accurately determined (Duchesne et al., 2007; Charlier et al., 2008).
experimental
Equipment
Analysis was performed on an ARL 9400XP equipped with a Rh anode, end window X-ray tube. The analysis conditions are given in Table 1. Overlap corrections were applied to account for the overlap of TiKβ on VKα, VKβ on CrKα, and SrKβ on ZrKα (Table 1), either by measuring the contribution of the interfering element (Sr, Cr) or by choosing an appropriate background (V), assuming the symmetry of the TiKβ peak profile. Ti and Mn are determined on glass discs and pellets. This permits to run the two methods independently if necessary. Ti-contents measured on magnetite pellets are used to correct matrix effects on V and Cr (see below) without necessarily measuring major elements on glass discs.
Sample preparation
Glass discs
The powdered samples are heated in a porcelaine crucible at 1000°C in a muffle furnace for 2 hours. 0.2 g of oxidized powdered sample and 4 g of X-Ray flux (50% Lithium tetraborate and 50% Lithium metaborate (Socachim) are
mixed in a Pt-5%Au alloy (Claisse Bis!) crucible and fused in a Claisse fluxer apparatus with continuous swirling at ca. 1000°C for 15 min. The melt is poured into a platinum mould (28 mm in diameter) and, on cooling, the disc spontaneously separates from it. The glass disc is 2 mm thick and shows a shiny surface. It is important to note that the disc cannot be indefinitely used; after a few weeks a change in count rate for iron is indicative of segregation (Norrish & Hutton, 1969).
Pressed pellets
The powdered sample (ca. 1.5 g) is mixed with a few drops of Elvacite (dissolved in toluene) and pressed as 20 mm-diameter pellets under 4.8 tcm-2. The critical thickness
of the sample for the NbKα line and densities of the Fe-Ti oxides (4.7 to 5.2) being ca. 0.65 mm (Potts, 1987), the minimum weight of sample is 1 g. For easier handling, the pellet is stuck on a cellulose disc of the same diameter.
Reference samples
A major concern in the analyses of Fe-Ti oxide minerals is the paucity of reference material covering the range of investigated contents for all elements. The list of the
Element X-ray line Count time (s)
Collimator Diffracting crystal Measuring angle Detector
glass disc pellet peak background
Mg Kα1,2 15 0,60 AX06 19,92 21.32, 18.50 FPC Al Kα1,2 15 0,60 PET 144,63 FPC Si Kα1,2 15 0,60 PET 109,02 FPC Ca Kα1,2 15 0,60 LiF200 113,11 FPC Ti Kα1,2 15 10°° 0,25 LiF200 86,14 85,00 FPC Mn Kα1,2 15 0,25 LiF200 62,96 63,36 FPC Fe Kα1,2 15 0,25 LiF220 57,51 58,21 FPC V Kα1 150 0,25 LiF220 123,06 124,82 FPC Cr § Kα1 150 0,25 LiF220 107,06 108,59 FPC S Kα1,2 15 0,25 Ge111 110,67 108,77 FPC Co Kα1 15 0,15 LiF220 77,83 78.43, 77.23 FPC Ni* Kα1 20 0,25 LiF220 70,22 71,20 SC Cu* Kα1 20 0,25 LiF220 65,49 66,20 SC Zn Kα1 15 0,15 LiF220 60,52 59,90 SC Zr** Kα1 15° 0,15 LiF220 32,04 31,53 SC Nb Kα1 15° 0,15 LiF220 30,38 29,86 SC Rh*** Kα1 15 0,15 LiF220 26,51 SC
The tube is operated at 50 kV and 50 mA on pellets and at 30 kV and 80 mA on glass discs. Pulse height discrimination applied.
* measured with Fe filter °° measured on magnetite for correction’s needs ° on ilmenite only ** ZrKα = ZrKα1 - (ZrBG*0.9878) - 0.0480*(SrKα1-SrBG)
§ CrKα = CrKα1 - CrBG - 0.0413*(VKα1-VBG) *** Compton scattered tube line
samples that are used is given Table 2. A few international reference samples do exist such as SARM 12 (magnetite), SARM 59 (ilmenite), and SARM 46 (stream sediment). Some samples, used for industrial purposes and validated by several industrial analytical laboratories, were provided by Titania AS (magnetites STD-65 and -89, ilmenites ILM-88 and -144), by a commercial company (ilmenite ILM-6703), and by the Panzhihua Iron and Steel company (magnetite S-102 and a crude magnetite ore S-104). A series of synthetic ilmenite samples (GP) were melted, ground and doped with various elements at the Quebec Iron & Titanium Corporation laboratory at Sorel. Finally three “in house” magnetite standards (M146, 64-96; 66-33) and an ilmenite (I66-16) were determined for some specific elements by a variety of methods, including ES and XRF.
Matrix corrections
For the major element analysis on glass disc, we have observed that diluting and fusing the sample in Li-borate in the proportion 1:20 give a homogeneous and translucent glass disc, and is sufficient to overcome matrix corrections. This method also cancels mineralogical effects and thus permits the use of synthetic standard samples made up of pure Fe2O3 and TiO2 chemicals to calibrate Fe and Ti determinations. For the minor element analysis on pressed pellets, we account for mass absorption effects with the Compton scattered tube line for Nb, Zr, Ni and Zn. No
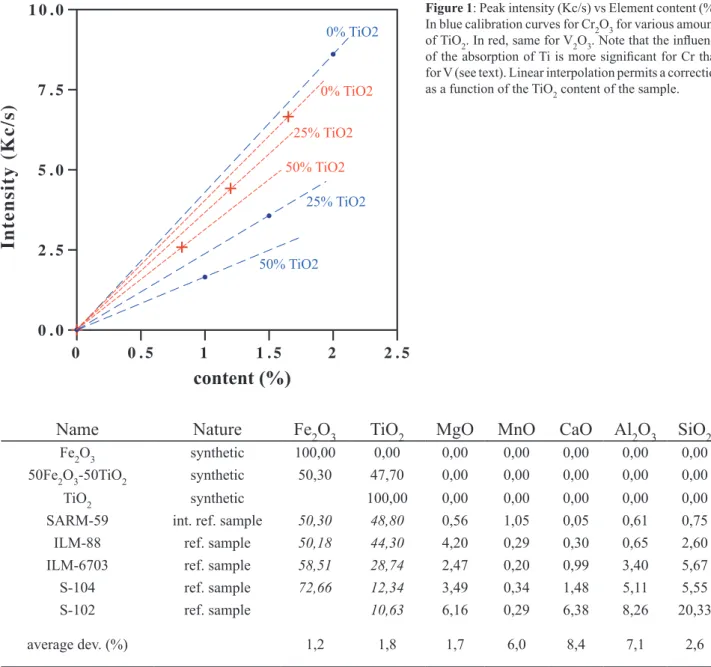
corrections were applied to Co. For V and Cr, we account for absorption and enhancement effects due to Fe and Ti contents. The matrix corrections are different between the two elements. Indeed, the absorption edge of the Ti K-lines is at 2.4970 Å, thus shorter than the VKα line (2.5036 Å), but larger than the CrKα line (2.2897 Å). The matrix effect on Cr thus includes intensity enhancement due to Fe and absorption due to Ti, while on V only the enhancement of Fe has to be corrected. Fig. 1 illustrates the matrix effects due to Ti and Fe on the V and Cr peak intensities.
Results
Accuracy
The accuracy of a particular element determination depends on the preparation method and on the reference samples used for calibration.
Glass discs
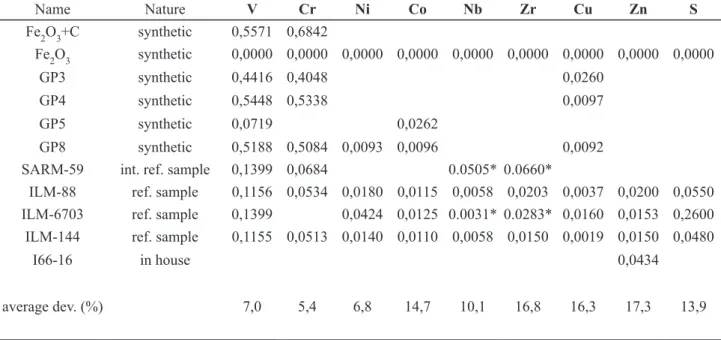
For Fe and Ti, two synthetic samples made up of pure Fe2O3 and TiO2 and a 1:1 mixture of Fe2O3 and TiO2 are used to calibrate the determinations. A series of reference samples have been measured by that method. The relative average deviations to the ‘recommended’ values (Tables 3 and 4) are 1.2% and 0.6% for Fe2O3 in ilmenite and magnetite, respectively, and 1.8% and 3.2% and for TiO2
Ilmenite
SARM-59 South African Bureau of Standards, Ilmenite (RBM) ILM-6703: AG Der Dillinger Hüttenwerke, Ilmenite X6703181002-1 ILM-88: Titania AS Standard n°88 (ilmenite 16716)
ILM-144: Titania AS Tellness standard ilmenite- average production 1990 (16716 G/91)
GP3-8: Synthetic ilmenite made up by G. Pouliot and M. Bergeron in 1979 at QIT (Sorel, Quebec) S-104: GBW 07226 Ore concentrate, Panzhihua Iron & Steel research Institute, China
S-102: GBW 07221 Crude ore, Panzhihua Iron & Steel research Institute, China
I66-16: Ilmenite separated from the Rödemyr deposit (Rogaland anorthosite province, Norway), analysed by XRF at the University of Liège
Magnetite
SARM-12 and 46: South African Bureau of Standards Phalaborwa magnetite and stream sediment, respectively STD-65: Titania AS Standard n°65 (magnetite V4 1)
STD-89: Titania AS Standard n°89 (magnetite 16717)
S-104: GBW 07226 Ore concentrate, Panzhihua Iron & Steel research Institute, China S-102: GBW 07221 Crude ore, Panzhihua Iron & Steel research Institute, China
M146: Magnetite separated from the Storgangen deposit (Rogaland anorthosite province, Norway), analysed by XRF at the University of Liège
M64-96: Magnetite separated from the Kydlandsvatn deposit (Rogaland anorthosite province, Norway), analysed by AES and XRF at the University of Liège
M66-33: Magnetite separated from the Hesnes deposit (Rogaland anorthosite province, Norway), analysed by XRF at the University of Liège
M66-16: Magnetite separated from the Rödemyr deposit (Rogaland anorthosite province, Norway), analysed by XRF at the University of Liège
__________________________________________________________________________________________________________
0 . 0 2 . 5 5 . 0 7 . 5 1 0 . 0
In
te
ns
it
y
(K
c/
s)
0 0 . 5 1 1 . 5 2 2 . 5Content
content (%)
0% TiO2 25% TiO2 50% TiO2 0% TiO2 25% TiO2 50% TiO2Figure 1: Peak intensity (Kc/s) vs Element content (%).
In blue calibration curves for Cr2O3 for various amounts of TiO2. In red, same for V2O3. Note that the influence of the absorption of Ti is more significant for Cr than for V (see text). Linear interpolation permits a correction as a function of the TiO2 content of the sample.
Name
Nature
Fe
2O
3TiO
2MgO
MnO
CaO
Al
2O
3SiO
2Fe2O3 synthetic 100,00 0,00 0,00 0,00 0,00 0,00 0,00
50Fe2O3-50TiO2 synthetic 50,30 47,70 0,00 0,00 0,00 0,00 0,00
TiO2 synthetic 100,00 0,00 0,00 0,00 0,00 0,00
SARM-59 int. ref. sample 50,30 48,80 0,56 1,05 0,05 0,61 0,75
ILM-88 ref. sample 50,18 44,30 4,20 0,29 0,30 0,65 2,60
ILM-6703 ref. sample 58,51 28,74 2,47 0,20 0,99 3,40 5,67
S-104 ref. sample 72,66 12,34 3,49 0,34 1,48 5,11 5,55
S-102 ref. sample 10,63 6,16 0,29 6,38 8,26 20,33
average dev. (%) 1,2 1,8 1,7 6,0 8,4 7,1 2,6
in italics, recommended value of the reference sample which is measured as an ordinary sample to estimate the accuracy (average deviation)
table 3: Calibration samples for major-element determination of ilmenite (glass discs)
Name
Nature
Fe
2O
3TiO
2MgO
MnO
CaO
Al
2O
3SiO
2Fe2O3 synthetic 100,00 0,00 0,00 0,00 0,00 0,00 0,00
50Fe2O3-50TiO2 synthetic 50,30 47,70 0,00 0,00 0,00 0,00 0,00
SARM-12 int. ref. sample 95,22 0,72 2,80 0,220 1,09 0,77 0,34
STD-65 ref. sample 85,80 3,46 2,90 0,031 0,40 2,00 4,30
STD-89 ref. sample 86,09 4,50 2,60 0,036 0,45 2,20 4,11
S-104 ref. sample 72,66 12,34 3,49 0,336 1,48 5,11 5,55
S-102 ref. sample 10,63 6,16 0,288 6,38 8,26 20,33
average dev. (%) 0,6 3,2 1,7 6,4 2,6 12,3 5,4
in italics, recommended value of the reference sample which is measured as an ordinary sample to estimate the accuracy (average deviation)
in ilmenite and magnetite, respectively. The other elements (Mg, Mn, Ca, Al and Si) were calibrated with several reference samples and the obtained accuracies range from 1.7% to 12.3% (Tables 3 and 4). We prefer using “natural” samples for calibration because in our experience it is a more reliable method than using “synthetic” mixtures of chemical compounds.
The overall accuracy of the glass disc determinations is very satisfactory. The best accuracy is obtained for Fe, Ti
and Mg, elements that are crucial to assess the solid solution stoechiometry of the minerals.
Pressed pellets
Tables 5 and 6 show the reference sample values that are used to calibrate the trace element determinations. Estimates of the accuracy of the determination are obtained by averaging the relative deviations to the “recommended” values. V and Cr are calibrated with
Name Nature V cr ni co nb Zr cu Zn s Fe2O3+C synthetic 0,5571 0,6842 Fe2O3 synthetic 0,0000 0,0000 0,0000 0,0000 0,0000 0,0000 0,0000 0,0000 0,0000 GP3 synthetic 0,4416 0,4048 0,0260 GP4 synthetic 0,5448 0,5338 0,0097 GP5 synthetic 0,0719 0,0262 GP8 synthetic 0,5188 0,5084 0,0093 0,0096 0,0092
SARM-59 int. ref. sample 0,1399 0,0684 0.0505* 0.0660*
ILM-88 ref. sample 0,1156 0,0534 0,0180 0,0115 0,0058 0,0203 0,0037 0,0200 0,0550 ILM-6703 ref. sample 0,1399 0,0424 0,0125 0.0031* 0.0283* 0,0160 0,0153 0,2600 ILM-144 ref. sample 0,1155 0,0513 0,0140 0,0110 0,0058 0,0150 0,0019 0,0150 0,0480
I66-16 in house 0,0434
average dev. (%) 7,0 5,4 6,8 14,7 10,1 16,8 16,3 17,3 13,9
* determined by XRF with international reference samples of silicate rocks
table 5: Calibration samples for trace-element determination of ilmenites (pellets)
Name Nature V cr ni co cu Zn s tio2
Fe2O3+A synthetic 1,1209
Fe2O3+C synthetic 1,3685 0,0000 50,00
Fe2O3+B synthetic 25,03
Fe2O3 synthetic 0,0000 0,0000 0,0000 0,0000 0,00
SARM-46 int. ref. sample 0,0225 0,0559 0,0056 0,0566 0,5900 0.17* 0,60
SARM-12 int. ref. sample 0,0520 0,0021 0,0281 0,0223 0,0502 0,0141 0,0695 0,72
S-104 ref. sample 0,3124 0,0240 0,0140 0,0200 0,0210 12,34 STD-65 ref. sample 0,3533 0,7458 0,0800 0,0106 0,0100 0,1500 0,6600 3,46 STD-89 ref. sample 0,3601 0,6760 0,0826 0,0115 0,0090 0,1340 0,4100 4,50 M146 in house 0,5299 0,5953 0,50 M64-96 in house 0,7337 0,2668 1,00 M66-16 in house 0,50 M66-33 in house 7,00 average dev. (%) 7,4 6,2 9,3 8,1 8,9 8,7 28,8 14,3
in italics, recommended value of the reference sample which is measured as an ordinary sample to estimate the accuracy (average deviation)
relatively large numbers of samples and the method gives accuracies of 5.6-7.6%, which is satisfactory inasmuch as the recommended values are far from ‘perfect’. The other elements are calibrated with a lower number of samples and consequently the accuracies are more difficult to estimate and thus less reliable. It should be noted that parts of the Ni, Co, and Cu contents may possibly be brought by traces of sulphides (S) which might be heterogeneously dispersed in the samples. This can explain the lower accuracy of the determination and consequently the lower geochemical interest of these elements as petrogenetic indicators than V and Cr. Note that a less accurate determination of Ti is obtained on pressed pellets of magnetite than on glass discs. This value is nevertheless sufficiently accurate to correct the matrix effects on V and Cr in case a glass disc determination is not performed/available.
We have noted that in the determination of low contents of V and Cr in ilmenite we sometimes obtain negative values, which means that the background intensity is higher than the blank intensity. To measure contents close to the detection limit, it is thus crucial to use a blank of “spec pure” ilmenite, specially synthetized for this purpose (Duchesne & Bologne, work in progress).
Element ilmenite magnetite
pellet glass disc pellet glass disc
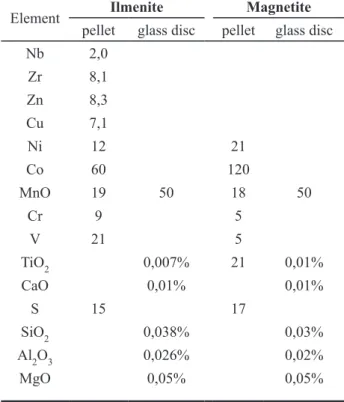
Nb 2,0 Zr 8,1 Zn 8,3 Cu 7,1 Ni 12 21 Co 60 120 MnO 19 50 18 50 Cr 9 5 V 21 5 TiO2 0,007% 21 0,01% CaO 0,01% 0,01% S 15 17 SiO2 0,038% 0,03% Al2O3 0,026% 0,02% MgO 0,05% 0,05%
table 7: Detection limits for major and trace elements (ppm
or %) on pellets and glass discs
magnetite
Range Average s s% LD (ppm) TiO2 0.2-25 % 11,50 0,10 0,85 21 MnO 0.003-0.38 % 0,18 0,002 0,98 18 V 0.27-2.30 % 0,57 0,01 1,2 5 Zn 500-1500 ppm 827 66 7,9 18 Cu 20-700 ppm 179 20 11,4 12 S 0.17-4.8 % 2,7 0,3 12,2 17 Cr 60-1600 ppm 234 30 12,8 5 Co 110-390 ppm 181 34 18,1 120 Ni 10-500 ppm 125 40 31,4 27ilmenite
Range Average s s% LD (ppm) MnO 0.3-0.5 % 0,47 0,002 0,5 19 S 0.02-2 % 0,22 0,002 1,0 15 Nb 16-22 ppm 19 0,28 1,4 2 V 0.01-0.32 % 0,1070 0,0026 2,4 21 Zr 40-650 ppm 178 7 3,7 8 Zn 20-190 ppm 78 6,2 6,4 6 Cu 10-220 ppm 33 6 19,4 7 Co <LD-150 ppm 59 21 36,0 60 Ni <LD-86 ppm 33 8 25,8 12Cr <LD-220 ppm 47 17 35,6 9 table 8: Reproducibility of major and trace element determinations on pellets
Detection limit
The instrumental detection limit LD for trace elements measured on pellets is calculated from the background count rate using: LD = (3√2B/T)/S where B = background count rate (in c/sec), T is the count time and S is the sensitivity net c/sec/concentration units. For elements involving ratios of line intensity to Compton scattered tube line intensity, the LD includes the error of this contribution. The results are given in Table 7. They meet the aims of the method and are thus satisfying. Note the relatively low LD of V and Cr due to the longer counting times (150 s vs. 15 s). Co, however, has an LD far larger than the other elements in both minerals. This is due to the proximity of the analytical line CoKα to the relatively very intense FeKß line, which increases the background intensity and reduces the peak/background ratio.
Precision
The precisions s of the element determination on pressed pellets have been evaluated on two series of samples measured at different days, and using s = √(Σw2/2k) where
w is the range, or difference between duplicates, and k the number of samples (Table 8). This method covers the whole interval of concentrations and is sufficient to give a good estimate of the standard deviation (Davies & Goldsmith, 1986). Excellent reproducibilities (<1.5%) are obtained for Ti, Mn and V in magnetite and Mn, S and Nb in ilmenite. Zn in both minerals and V and Zr in ilmenite are measured with s <10%. The reproducibility increases rapidly when the average content approaches the detection limit (see e.g. Ramsey et al., 1995), as observed in the present case for Co and Ni in both minerals and Cr in ilmenite.
discussion
The principal aim of the present work is to show the strengths and weaknesses of a simple method of mineral analysis. The major strength of the method is to permit the analysis of relatively small quantities of the whole mineral, that is the host mineral and its various exsolved phases, an objective that cannot be easily attained with an electron microprobe, even with a defocused beam. This method can be highly recommended for the analysis of major elements and particularly for Fe and Ti. Moreover, the method is easy to implement with few synthetic reference samples and a few natural reference samples. This is very convenient to overcome the limited life of the glass discs.
For trace elements, whether determined on glass discs or on pellets, the weakness of the method is that the accuracy strongly depends on the availability of reference samples. For elements such as e.g. S it suffers from the small number of reference samples and of their relatively low quality. However, for V and Cr, the method provides low detection limits and excellent accuracy and precision that meet the needs of most geochemical interpretation.
acknowledgements
The authors thank Robert Maquil for his help in implementing the method in the “Collectif Interinstitutionnel de Géochimie Instrumentale” (1974-2002) supported by the Belgian FNRS. The final version of the paper has greatly benefited from the review of A. Herbosh. M. Dusar is thanked for the editorial handling.
References
ANDERSEN, D. J., LINDSLEY, D. H. & DAVIDSON, P. M., 1993. QUILF: a Pascal program to assess equilibria among Fe-Mg-Ti oxides, pyroxenes, olivine, and quartz. Comput. Geosci., 19(9): 1333-1350.
BOLOGNE, G. & DUCHESNE, J. C., 1991. Analyse des roches silicatées par spectrométrie de fluorescence X: précision et exactitude. Belgian Geol. Survey Prof. Paper, 249: 1-11.
CHARLIER, B., SKÅR, Ø., KORNELIUSSEN, A., DUCHESNE, J.-C., & VANDER AUWERA, J. (2007). Ilmenite composition in the Tellnes Fe-Ti deposit, SW Norway: fractional crystallization, postcumulus evolution and ilmenite-zircon relation. Contributions to Mineralogy and Petrology 154, 119-134.
CHARLIER, B., SAKOMA, E., SAUVÉ, M., STANAWAY, K., VANDER AUWERA, J. & DUCHESNE, J. C., 2008. The Grader layered intrusion (Havre-Saint-Pierre anorthosite, Quebec) and genesis of nelsonite and other Fe-Ti-P ores (doi: 10.1016/j.lithos.2007.08.004). Lithos, 101: 359-378.
DAVIES, O. L. & GOLDSMITH, P. L., 1986. Statistical methods in research and production. John Wiley and Sons.
DUCHESNE, J. C., CHARLIER, B. & VANDER AUWERA, J., 2007. Empirical calibration of the V partitioning between magnetite and ilmenite as an oxybarometer (abstract). Eos Trans. AGU, 88 (52), Fall Meet. Suppl. Abstract V54A-08.
DUCHESNE, J. C., SHUMLYANSKYY, L. & CHARLIER, B., 2006. The Fedorivka layered intrusion (Korosten Pluton, Ukraine): an example of highly differentiated ferrobasaltic evolution. Lithos, 89: 353-356.
ENZWEILER, J. & WEBB, P. C., 1996. Determination of trace elements in silicate rocks by X-ray fluorescence spectrometry on 1:5 glass discs: comparison of accuracy and precision with pressed powder pellet analysis. Chem. Geol., 130: 195-202.
GOVINDARAJU, K., 1994. 1994 Compilation of working values and sample description for 383 geostandards. Geostandards Newsletters, 18: 1-158.
LATTARD, D., SAUERZAPF, U. & KÄSEMAN, M., 2005. New calibration data for the Fe-Ti oxide thermo-oxybarometers from experiments in the Fe-Ti-O system at 1 bar, 1000-1300°C and a large range of oxygen fugacities. Contrib. Miner. Petrol, 149: 735-754.
NAIR, A. G., DAMODARAN, K. & SURESH BABU, D., 2002. Qualitative assessment of ilmenite from Chavara deposit, Southwest Coast of India (abstract M51B-01) American Geophysical Union, Spring Meeting 2002. NORRISH, K. & HUTTON, J. T., 1969. An accurate X-ray spectrographic method for the analysis of a wide range of geological samples. Geochim. Cosmochim. Acta, 33: 431-453.
POTTS, P. J., 1987. X-ray fluorescence analysis: principles and practice of wavelength dispersive spectrometry. In Potts, P. J. (ed.) A handbook of silicate rock analysis. Blackie & son Ltd : 226-285.
RAMSEY, M. H., POTTS, P. J., WEBB, P. C., WATKINS, P., WATSON, J. S. & COLES, B. J., 1995. An objective assessment of analytical method precision: comparison of ICP-AES and XRF for the analysis of silicate rocks. Chem. Geol., 124: 1-19.
REYNOLDS, R., 1967. Estimation of mass absortion coefficients by Compton scatterring: improvement and extensions of the method. Amer. Mineral., 52: 1493-1502.
SAUERZAPF, U., LATTARD, D., BURCHARD, M. & ENGELMAN, R., 2008. The titanomagnetite-ilmenite equilibrium: new experimental data and thermo-oxybarometric application to the crystallization of basic to intermediate rocks. J. Petrol., 00: 1-25.
Manuscript received 15.10.2008; accepted in revised form 14.10.2009; available online 01.02.2009