1
Performance evaluation of the General Electric
1
eXplore CT 120 micro-CT using the vmCT
2
phantom.
3 4
M.A. Bahri1*, G. Warnock1, A. Plenevaux1, P. Choquet2, A. Constantinesco2, E. Salmon1, A. Luxen1 and 5
A. Seret1,3 6
7 1
ULg-Liège University – Cyclotron Research Centre - Liège - Bat. 30, Allée du 6 aout, 8 – Belgium.
8 2
Biophysique et Médecine Nucléaire, Hôpitaux universitaires de Strasbourg, Strasbourg, France.
9 3
ULg-Liège University - Experimental Medical Imaging, Liège, Belgium.
10 11 12
* Corresponding author. Tel.: +32 4 366 23 35; fax: +32 4 366 29 46. 13
E-mail address: M.Bahri@ulg.ac.be (M.A. Bahri). 14
2
Abstract
1
The eXplore CT 120 is the latest generation micro-CT from General Electric. It is equipped with a 2
high power tube and a flat panel detector. It allows high resolution and high contrast fast CT 3
scanning of small animals. The aim of this study was to compare the performance of the eXplore 4
CT 120 with the one of the eXplore Ultra, its predecessor for which the methodology using the 5
vmCT phantom was already described [1]. 6
The phantom was imaged using typical rat (fast scan or F) or mouse (in vivo bone scan or H) 7
scanning protocols. With the slanted edge method, a 10% modulation transfer function (MTF) was 8
observed at 4.4 (F) and 3.9-4.4 (H) mm-1
corresponding to 114 µm resolution. A fairly larger MTF 9
was obtained with the coil method with the MTF for the thinnest coil (3.3 mm-1
) equal to 0.32 (F) 10
and 0.34 (H). The geometric accuracy was better than 0.3%. There was a highly linear (R2
> 0.999) 11
relationship between measured and expected CT numbers for both the CT number accuracy and 12
linearity sections of the phantom. A cupping effect was clearly seen on the uniform slices and the 13
uniformity-to-noise ratio ranged from 0.52 (F) to 0.89 (H). The air CT number depended on the 14
amount of polycarbonate surrounding the area where it was measured: a difference as high as 15
approximately 200 HU was observed. This hindered the calibration of this scanner in HU. This is 16
likely due to the absence of corrections for beam hardening and scatter in the reconstruction 17
software. However in view of the high linearity of the system, the implementation of these 18
corrections would allow a good quality calibration of the scanner in HU. In conclusion, the eXplore 19
CT 120 achieved a better spatial resolution than the eXplore Ultra (based on previously reported 20
specifications) and future software developments to include beam hardening and scatter corrections 21
will make the new generation CT scanner even more promising. 22
23
Keywords: Micro-computed tomography (Micro-CT); Image quality; vmCT phantom. 24
3
I.
Introduction
1
Small-animal imaging systems have been used as translational research tools between 2
animal models and human clinical applications [2, 3]. Among the small-animal imaging modalities 3
available, micro-computed tomography (micro-CT) has the ability to provide highly detailed 4
anatomical information in a minimally invasive way and with very high spatial resolution [2]. 5
Micro-CT systems have been used for many qualitative and quantitative research studies including 6
the study of bone structure and density in osteoporosis and osteoarthritis [4] and of 7
microvasculature anatomy using contrast-enhanced imaging [5, 6]. 8
The results of such studies have been shown to be strongly dependent on system performance. 9
The proper characterization of system performance then becomes mandatory for clinical CT and 10
micro-CT scanners [7 - 9]. Recently, Du et al. [1] proposed a new phantom (vmCT) and a full 11
methodology for the evaluation of the performance of micro-CT systems. The phantom allows 12
quantitative assessment of multiple image-quality parameters of micro-CT systems in one single 13
scan, in terms of spatial resolution, geometric accuracy, CT number accuracy, linearity, noise and 14
image uniformity. Du et al. following the methodology described in [1] used the vmCT phantom to 15
evaluate the performance of the General Electric eXplore Ultra scanner (GE Healthcare, London, 16
ON, Canada). 17
The purpose of this work was to evaluate the performance of the latest generation micro-CT from 18
General Electric, the eXplore CT 120 scanner, using the same methodology and the same vmCT 19
phantom as described by Du et al.. Our results could also provide a starting point for comparison 20
with other small animal micro-CT devices. 21
22
II.
Materials and methods
23
1. Micro-CT system 24
The eXplore CT 120 is the latest generation micro-CT from General Electric. By using a 25
mammography x-ray tube and a CCD flat-panel detector, the system allows high resolution (80 µm 26
stated by the manufacturer) and high contrast rapid scanning in small animals. 27
The x-ray source and the detector are placed opposite to each other at a fixed distance of 450 28
mm on a gantry which rotates around a carbon fiber bed. Two beds were designed to cater for 29
mouse (25 mm width) and rat (75 mm width). The system is equipped with a high power rotating-30
anode x-ray tube with a focal spot of 600 mm and a 5 kW peak source power. The x-ray tube is 31
capable of target voltages ranging from 70 to 120 kVp, with a typical current range of 20-50 mA. 32
The only filtration used on the system is the inherent filtration of the tube housing (equivalent to 33
4 about 1.5 mm Al).
1
The detector has 3500 x 2300 pixel elements for an active area of 110 x 75 mm2
. The maximum 2
allowed transaxial field of view is 85 mm with an axial length of 55 mm per rotation and a total 3
scan length of 250 mm. The system operates with three different detector binning modes (1x1, 2x2, 4
and 4x4). Binning is a process of adding the values of neighboring pixels together to produce a new 5
pixel in a reduced-resolution image when a high resolution scan is not needed, improving the 6
signal-to-noise ratio. The typical anatomical scan (single field of view) offered by the scanner is 7
obtained within 45 s. During this scan time window 220-1200 views are acquired over a 192° (half 8
scan mode) or 360° (full scan mode) depending on the scan protocol. A Feldkamp’s filtered 9
backprojection algorithm is then used to reconstruct a 3D volume with 875 x 875 x 575 voxels at an 10
isotropic voxel size of 100 µm. 11
12
2. Phantom 13
The vmCT is a single phantom consisting of six separate modular sections (resolution coil 14
section, slanted edge section, geometric accuracy section, CT number evaluation section, linearity 15
section, uniformity and noise section), each designed to evaluate one aspect of image quality. The 16
sections are held together inside an acrylic tube with an inner diameter of 63 mm and an outer 17
diameter of 70 mm. The total length of the phantom is 54 mm which fits within the scanner axial 18
FOV, allowing all the quantitative information to be obtained from a single scan. 19
a) Spatial resolution: Spatial resolution was assessed qualitatively and quantitatively by analyzing 20
the coil and slanted-edge sections (Fig. 1.a and b) and calculating their MTF as described by Du et 21
al. [1]. For the resolution coil, the standard deviation (SD) in four regions of interest (ROI) placed 22
on each coil (top, bottom, left, right) was measured and corrected by the SD of the uniform region. 23
The MTF values were then calculated for each coil thickness using the average SD and the mean 24
absolute difference CT values measured for aluminum and plastic [1, 10]. For the slanted-edge 25
section, ten reconstructed transaxial slices were averaged to obtain an image of reduced noise. An 26
over-sampled edge spread function (ESF) was generated from the change-in-pixel intensity from air 27
to plastic in each row of the averaged image. The derivative of the ESF gives the line spread 28
function (LSF), from which the pre-sampled MTF of the detector is calculated by taking the 29
modulus of the Fourier transform [11, 12]. The slanted-edge was positioned at an angle of 30
approximately 5° to the y-axis (slanted-edge positioning is aided by the shape of the phantom). 31
This angle was also calculated by using the fit parameters of the detected edge on the image. A 32
smoothed MTF value was calculated using an ESF smoothed by a fourth-order, Gaussian-weighted, 33
moving polynomial fit [13]. 34
5 b) Geometric accuracy: Four beads were placed 35 mm apart at the corners of an ideal square 1
centered in the geometric accuracy section (Fig. 1.c), and one bead was placed at the center of the 2
square (24.75 mm from the other four). The distance in terms of number of pixels between two 3
neighboring beads was measured between the centers of the two beads. The true pixel size was then 4
obtained by dividing the known physical distance between beads by the measured number of pixels. 5
c) Linearity: ROIs were placed on the reconstructed image of the vials with varying iodine 6
concentration. The signal intensity and its SD measured on these ROIs were used to assess the 7
linearity of the system. The relationship between signal intensity and iodine concentration was 8
determined by linear regression analysis. 9
d) CT number: the CT number and the SD for air and each of the eight material samples (Table 2) 10
of the CT number section were measured. The measurements were taken in HU from a ROI placed 11
in the center of each material sample. The expected CT number for each material was given by the 12
manufacturer of the phantom. 13
e) Uniformity: Four peripheral ROIs and one central ROI were drawn on the uniformity section in 14
order to quantitatively assess the variation in signal intensity from the center to the periphery. The 15
average difference in signal intensity between the peripheral and the central regions (equation 1) 16
and the average measured SD (noise) were calculated. The uniformity-to-noise ratio was calculated 17
as the ratio between the average difference in signal intensity and the noise. 18
AvgSigDiff =1
4 i=1
(
CTROI center! CTROI peripheral (i))
4"
, 1 19 20 3. Measurements 21All measurements were made from reconstructed images of each section of the phantom. Two 22
different scanning protocols were used in this study (Table 1), recommended for rat (fast scan or F) 23
or mouse (in vivo bone scan or H). A set of bright- and dark-field images was collected to correct 24
for individual detector gain and offset in the raw projection data. Feldkamp’s filtered back-25
projection algorithm was used to reconstruct the projection into 3D volume data sets of 844 and 902 26
slices for F and H protocols, respectively [14]. Slice size was 789 x 744 and 745 x 745 pixels, 27
respectively. The voxel size used in these reconstructions was 100 x 100 x 100 µm3
. Data analysis 28
was performed using PMOD software (PMOD Technologies Ltd., Zurich, Switzerland) and Matlab 29 (http://www.mathworks.com, version 7.7). 30 31 <Table 1> 32
6
III.
Results
1
1. Spatial resolution 2
The MTF of the system was determined over frequencies ranging from 0 to 5 mm-1, based on the 3
analysis of the reconstructed images of the coil and slanted-edge sections as shown in figure 2. The 4
10% MTF for the slanted-edge was observed at approximately 4.4 mm-1
for the F scan (both with 5
and without smoothing of the edge spread function), corresponding to a resolution of 114 µm. For 6
the H scan, the MTF reached the 10% level at 3.9 (smoothed) and 4.4 (unsmoothed) mm-1 7
corresponding to a resolution of 128 and 114 µm. The ring artifact observed on the image of the 8
slanted edge section could be the source of the observed MTF fluctuation in H scans (Figure 2) 9
possibly explaining the different values obtained with and without ESF smoothing. 10
11
<Figures 1 and 2> 12
13
Even the thinnest coil (150 µm) was clearly seen on the reconstructed images of the resolution 14
coil section. A fairly larger MTF than that for the slanted edge method was obtained with the coil 15
section. The MTF for the thinnest coil was 0.32 (F) and 0.34 (H) at 3.3 mm-1
. The spatial resolution 16
of the system was not measured in the z-direction because the vmCT phantom is not designed for 17
this measurement. It is expected to be comparable to the in-plane resolution as the detector pixel 18 size is isotropic. 19 20 2. Geometric accuracy 21
The geometric accuracy of the system was evaluated based on the reconstructed image of the five 22
beads placed at known distances (Fig.1c). The nominal in-plane pixel spacing is 99.7±0.3 µm for 23
both F and H scans, which is within 0.3% of the manufacturer’s specification. The center of the 24
bead was detected manually, which may have increased the voxel spacing error. 25
26
3. Linearity 27
The linearity of the system was determined using the measured CT number in iodine solutions of 28
various concentrations (Fig. 3.a). A highly linear (R2
(H) > 0.9997; R2
(F) > 0.9998) relationship 29
between measured CT number and iodine concentration was observed (the resulting equation are 30
given in figure 3.c). The same behavior (R2(H) > 0.9998 and R2(F) > 0.9947) was also observed for 31
the CT number evaluation section (Fig. 3.b) for the measured vs. the expected CT number. 32
33
<Figure 3> 34
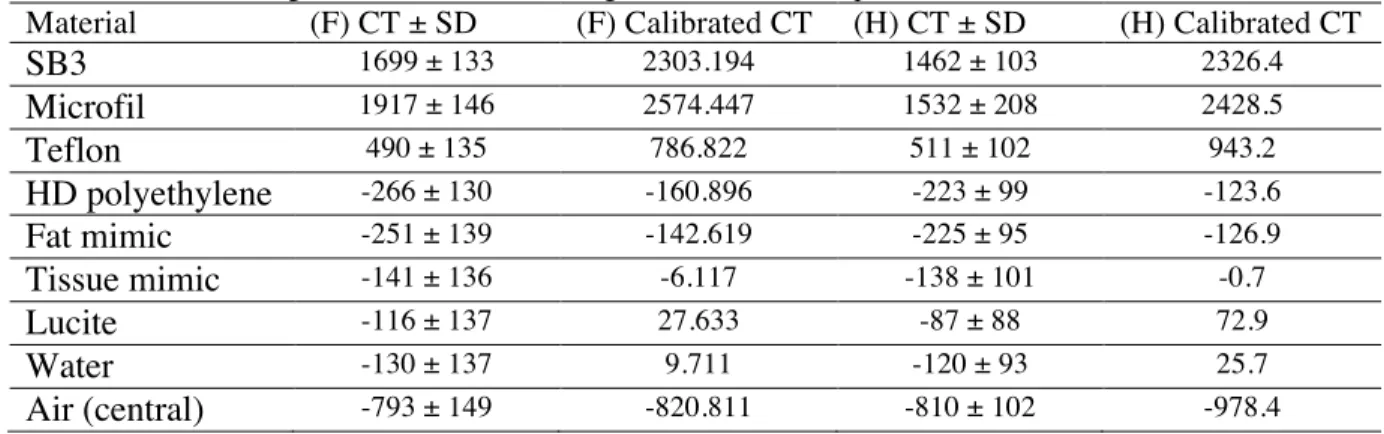
7 4. CT number evaluation
1
Table 2 shows the CT number of eight different materials measured from the images of the CT 2
number evaluation section (Fig. 3.b). These measurements can be used to calibrate the scanner in 3
order to provide values for pure materials, which may be required for quantitative analysis. 4
5
<Table 2> 6
7
As the scanner was not calibrated at the time of the measurements, CT numbers were tentatively 8
calibrated using formulas expressing the fit of the measured vs. the expected CT number for the 9
different materials. Instead of being 0 and -1000 HU, the calibrated value for solid water and the 10
small air hole at the center of the CT number evaluation section were 25.7 and -978 HU for the H 11
scan, and 9.7 and -820.11 HU for the F scan. In order to understand this discrepancy, the CT 12
number for air was measured in a hole drilled in different positions on three polycarbonate 13
phantoms. The measured air CT values (-937 HU for air at the center of the 30-mm diameter 14
phantom and -852 and -842 HU for air at and off the center of the 70-mm diameter phantom)were 15
found to be dependent on the amount of polycarbonate surrounding the air cylinder, hindering the 16
calibration of the system in HU. 17
18
5. Uniformity 19
The uniformity of the system’s signal response was measured on the polycarbonate uniformity 20
section. For both F and H scans, the central region exhibited a lower mean CT number and a higher 21
noise than the peripheral regions. The average difference in signal intensity values between the 22
peripheral and the central regions was 62.20 HU for F and 75.24 HU for H and is illustrated in 23
figure 4 where a clear cupping effect is observable on the radial signal profile of the uniform central 24
slice. The noise was 121.21 for F and 91.82 for H, respectively and the uniformity-to-noise ratios 25 were 0.52 (F) and 0.89 (H). 26 27 28 29 <Figure 4> 30 31 32 33 34 35 36 37 38
8
IV.
Discussion
1
In this study we used the vmCT phantom and related performance tests [1] to evaluate the 2
performance of the eXplore CT 120 scanner. Image-quality parameters that were evaluated, in only 3
a single acquisition, included: spatial resolution, geometric accuracy, CT number evaluation, 4
linearity, uniformity and noise. Visual inspection of the coiled bar pattern images indicated that the 5
thinnest bar of 0.15 mm, equivalent to 3.3 line pairs mm-1
, is clearly distinguishable. This result 6
reinforced the quantitative results obtained with the slanted edge, which indicated a 10% MTF at 7
4.4 (H) and 3.9-4.4 (F) mm-1
corresponding to an approximate spatial resolution of 0.114 mm. The 8
MTF values estimated at the four discrete spatial frequencies provided by the coiled bar pattern 9
were similar to those calculated with the slanted edge, with the exception of somewhat higher 10
values. This small difference in MTF values could be due to the different behavior of the used 11
methods toward noise and orientation. It has been reported that bar-pattern MTF is immune to noise 12
and is not influenced by tilt or orientation [10] which is not the case for the slanted edge method. It 13
would be interesting to compare the 10% MTF results from slanted edge section with those from a 14
coil with 0.1 mm bar thickness. This was not possible with the version of the vmCT phantom used, 15
as the thinnest coil had a bar thickness of 0.15 mm. With a spatial resolution of about 0.114 mm, the 16
eXplore CT 120 achieve almost two times better resolution than the eXplore Ultra (0.2 mm 17
measured by Du et al.). 18
The geometric accuracy of the system was evaluated and the nominal in-plane pixel spacing was 19
shown to be within 0.3% of the manufacturer’s specification. The geometric scaling factor could be 20
important in studies involving the measurement of organ volume, airway dimensions, or vessel 21
diameters. The eXplore CT 120 was observed to have a highly linear response over the range of 22
iodine solutions used. The same behavior was also observed for the CT evaluation section. 23
However, the fitted equation relating the CT signal to iodine concentration (Fig. 3.c) showed a 24
significant x-axis intercept, indicating the absence of system calibration at the time of the 25
experiment. An attempt to calibrate the system was made using the fitted equation relating the 26
measured CT number to the expected CT number in the CT number section. The calibrated CT 27
number values still revealed a discrepancy with the expected CT number values for solid water and 28
air. Supplementary scans were performed on three polycarbonate phantoms of different diameter, 29
with an air cylinder drilled either at the center or off-center of the phantom. These scans showed 30
that air CT values depended on the amount of polycarbonate surrounding the air cylinder. Beam-31
hardening and scatter are the most likely sources of this effect, which hinders the calibration of the 32
system in HU. 33
9 The signal uniformity and noise were evaluated using the uniformity section of the vmCT 1
phantom. Contrary to the results given by Du et al. for eXplore Ultra where almost identical CT 2
number and SD values were recorded for the central and peripheral, the eXplore CT 120 gave 3
different values for central and peripheral regions. Moreover, a cupping effect was observed on the 4
radial signal profile even though the uniformity-to-noise ratio ranged from 0.52 (F) to 0.89 (H). 5
Therefore, implementation of beam-hardening corrections to improve the uniformity of the system 6
over the entire field of view may be needed. 7
In conclusion, the eXplore CT 120 achieved a better spatial resolution than the eXplore Ultra but 8
suffered from low signal uniformity. Future software developments for beam hardening and scatter 9
corrections would make the new generation CT scanner even more promising. 10
11 12
Acknowledgements:
This work was supported by FRS-FNRS Belgium (Grant 3.4551.08F) and13
by grants from SPW DG06 (NEUROCOM n° 716747 and NEUREDGE n° 816859). 14
A. Plenevaux is a senior research associate from the FRS-FNRS Belgium, and M.A. Bahri is a 15
“Collaborateur logistique F.R.S.-FNRS”. 16
10
References
1 2
[1] L.Y. Du, J. Umoh, H.N. Nikolov, S.I. Pollmann, T.-Y. Lee and D.W. Holdsworth, Phys. Med. 3
Biol. 52 (2007) 7087-7108. 4
[2] S.J. Schambach, S. Bag, L. Schilling, C. Groden, M.A. Brockmann, Methods 50 (2010) 2-13. 5
[3] P.J. Greer, V.L. Villemagne, J. Ruszkiewicz, A.K. Graves, C.C. Meltzer, C.A. Mathis, J.C. 6
Price, Bull. 58 (2002) 429-438. 7
[4] B. Borah, G.J. Gross, T.E. Dufresne, T.S. Smith, M.D. Cockman, P.A. Chmielewski. M.W. 8
Lundy, J.R. Hartke, E.W. Sod, Anat. Rec. 265 (2001) 101-110. 9
[5] A. Lerman, E.L. Ritman, Herz, 24 (1999) 531-533. 10
[6] M.D. Bentley, S.M. Jorgensen, L.O. Lerman, E.L. Ritman, J.C. Romero, Anat. Rec. 11
(Hoboken) 290 (2007) 277-283. 12
[7] A. Seifert, M.J. Flynn, Proc. SPIE 4682 (2002) 407-413. 13
[8] N.L. Ford, M.M. Thornton, D.W. Holdsworth, Med. Phys. 30 (2003) 2869-2877. 14
[9] C.B. Chiarot, J.H. Siewerdsen, T. Haycocks, D.J. Moseley, D.A. Jaffray, phys. Med. Biol. 50 15
(2005) N287-297. 16
[10] R.T. Droege and R.L. Morin, Med. Phys. 9 (1982) 758-760. 17
[11] H. Fujita, K. Doi, M.L. Giger, Med. Phys. 12 (1985) 713-720. 18
[12] H. Illers, E. Buhr, S. Gunther-Kohfahl, U. Neitzel, Prot. Dosim. 114 (2005) 214-219. 19
[13] E. Samei, M.J. Flynn, Med. Phys. 25 (1998) 102-113. 20
[14] L.A. Feldkamp, L.C. Davis, J.W. Kress, J. Opt. Soc. Am. 1 (1984) 612-619. 21
11 Figure legends:
1 2
Fig. 1. micro-CT images (high resolution scan) of a) coil, b) slanted-edge and c) geometric accuracy 3
sections. 4
5
Fig. 2. Modulation transfer function (MTF) for F and H scanning protocols measured from the 6
slanted-edge section, as well as from the resolution coil section. 7
8
Fig. 3. a) and b) linearity and CT number sections, c) Plot of the CT number as measured in the 9
linearity section vs. the iodine concentration for H and F scanning protocols. 10
11
Fig. 4. Radial signal profile taken through the central slice of the uniform section obtained with the 12
high resolution scan. 13
12
Table 1. SCANNING PROTOCOLS
1
Protocol
Fast scan (F) 220 projections images were acquired over a rotation of 192° with an exposure time of 48 ms at 70 kVp and 32 mA.
In vivo bone scan (H) 360 projections images were acquired aver a full rotation of 360° with an exposure time of 60 ms at 100 kVp and 50 mA. 2
3
Table 2: Measured CT number of the air and the eight different materials used in the CT number evaluation section.
4
Data calibration was done using the fitted formula relating measured CT to expected CT numbers.
5
Material (F) CT ± SD (F) Calibrated CT (H) CT ± SD (H) Calibrated CT
SB3 1699 ± 133 2303.194 1462 ± 103 2326.4 Microfil 1917 ± 146 2574.447 1532 ± 208 2428.5 Teflon 490 ± 135 786.822 511 ± 102 943.2 HD polyethylene -266 ± 130 -160.896 -223 ± 99 -123.6 Fat mimic -251 ± 139 -142.619 -225 ± 95 -126.9 Tissue mimic -141 ± 136 -6.117 -138 ± 101 -0.7 Lucite -116 ± 137 27.633 -87 ± 88 72.9 Water -130 ± 137 9.711 -120 ± 93 25.7 Air (central) -793 ± 149 -820.811 -810 ± 102 -978.4 6
13 Figures: 1 2 Fig. 1 3 4 5 6 7 8 Fig. 2 9 10 11 12 Fig. 3 13 14 15 16 17 18
14 Fig. 4
1