THÈSE
THÈSE
En vue de l’obtention du
DOCTORAT DE L’UNIVERSITÉ DE TOULOUSE
Délivré par : l’Université Toulouse 3 Paul Sabatier (UT3 Paul Sabatier)
Présentée et soutenue le 15/06/2015 par : Adrian-Gabriel CHIFU
Adapting information retrieval systems to contexts: the case of query difficulty
Adaptation des systèmes de recherche d’information aux contextes: le cas des requêtes difficiles
JURY
Josiane MOTHE Professeure Directrice
Patrice BELLOT Professeur Rapporteur
Jacques SAVOY Professeur Rapporteur
Brigitte GRAU Professeure Examinateur
Florentina HRISTEA Maître de Conférences Examinateur
Florence SEDES Professeure Examinateur
École doctorale et spécialité :
MITT : Image, Information, Hypermedia Unité de Recherche :
Institut de Recherche en Informatique de Toulouse UMR 5505 Directeur de Thèse :
Josiane MOTHE Rapporteurs :
List of abbreviations 1
Acknowledgements 3
Abstract 5
Résumé 7
General introduction 9
1 Information retrieval framework 13
1.1 Relevance . . . 13
1.2 IR models . . . 15
1.2.1 Vector space model . . . 16
1.2.2 Okapi BM25 model . . . 17
1.2.3 Divergence from randomness model . . . 18
1.2.4 Language model . . . 20 1.3 Query expansion . . . 22 1.4 Evaluation . . . 24 1.4.1 Evaluation measures . . . 26 1.4.2 Statistical measures . . . 30 1.4.3 Benchmark collections . . . 31
1.4.4 TREC topics and queries . . . 32
1.4.5 TREC runs and participants . . . 33
1.4.6 Information Retrieval (IR) platforms . . . 34
1.4.6.1 Terrier . . . 34
1.4.6.2 Indri . . . 34
1.5 Conclusion . . . 35
2 Word sense discrimination and query ambiguity in information retrieval 37 2.1 Introduction . . . 38
2.3 Clustering-based WS discrimination . . . 44
2.3.1 Unsupervised WS discrimination with an underlying Naïve Bayes model . . . 45
2.3.1.1 The probability model of the corpus, the Bayes clas-sifier and parameter estimation . . . 45
2.3.2 Spectral clustering . . . 49
2.3.2.1 Spectral clustering method . . . 49
2.3.2.2 Using spectral clustering for unsupervised WS dis-crimination . . . 50
2.4 WS discrimination in IR . . . 51
2.4.1 Query WS discrimination . . . 52
2.4.2 Document re-ranking . . . 54
2.5 Evaluation framework . . . 55
2.5.1 Data collection features . . . 55
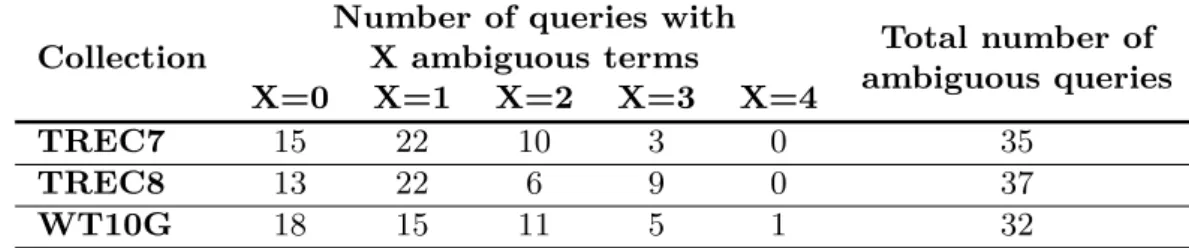
2.5.2 Ambiguous queries and ambiguous terms . . . 55
2.5.3 Evaluation measures . . . 55
2.5.4 Baselines . . . 56
2.5.5 WS discrimination settings . . . 57
2.6 Results . . . 57
2.6.1 Results using Naïve Bayes classification . . . 57
2.6.1.1 The filtering method for all the ambiguous queries . 58 2.6.1.2 The re-ranking method . . . 59
2.6.2 Results using spectral clustering . . . 62
2.7 Further analysis of the spectral clustering results . . . 68
2.7.1 Improvements in baseline precision intervals . . . 68
2.7.2 Detailed results after taking into account the number of am-biguous terms . . . 69
2.8 The spectral clustering method using automatically generated context 71 2.8.1 Automatic contextualization using pseudo relevance feedback 71 2.8.2 Experiments and results . . . 72
2.9 Conclusion . . . 73
3 Query difficulty prediction 75 3.1 Introduction . . . 76
3.2.1 Pre-retrieval predictors . . . 78
3.2.2 Post-retrieval predictors . . . 80
3.2.3 Predictor combinations . . . 82
3.3 The retained predictors . . . 84
3.3.1 WordNet Senses . . . 84
3.3.2 Inverse Document Frequency . . . 85
3.3.3 Standard Deviation . . . 85
3.3.4 Query Feedback . . . 85
3.4 Combinations of difficulty predictors . . . 86
3.5 Evaluation . . . 87
3.5.1 Parameter setup for predictors . . . 87
3.5.2 Prediction quality . . . 88
3.6 Results and discussion . . . 89
3.6.1 Variability in terms of predictor correlations . . . 89
3.6.2 Correlations of predictor combinations . . . 91
3.7 Conclusion . . . 92
4 Selective query expansion 93 4.1 Introduction . . . 93
4.2 Related work on selective query expansion . . . 96
4.3 SVM-based learning using query difficulty predictors . . . 99
4.3.1 Method overview . . . 99
4.3.2 Detailed query features . . . 100
4.3.3 Query classification . . . 100
4.4 Evaluation framework . . . 101
4.4.1 Test collections and retrieval parameters . . . 101
4.4.2 SVM configuration . . . 102
4.4.3 Evaluation method . . . 103
4.5 Results and discussion . . . 104
4.6 Conclusion . . . 105
5 Failure analysis: parameter optimization for a pseudo-relevance feedback model 107 5.1 Introduction . . . 108
5.3 Evaluation framework . . . 111
5.3.1 Data collections . . . 112
5.3.2 Baselines . . . 112
5.3.3 Retrieval parameters . . . 112
5.4 Optimization hypothesis without prior information . . . 113
5.4.1 Linear regression and SVM with query difficulty prediction features . . . 113
5.4.2 Pseudo-relevance information . . . 117
5.5 Hypothesis with prior information . . . 119
5.5.1 Jensen-Shannon divergence . . . 119
5.5.2 Logistic regression . . . 120
5.6 Other insights . . . 121
5.7 Conclusion . . . 123
6 Conclusion and future work 125 Conclusion and future work 125 6.1 Conclusion . . . 125
6.1.1 Word sense discrimination in information retrieval . . . 126
6.1.2 Query difficulty predictors and predictor combinations . . . . 127
6.1.3 Selective information retrieval based on query difficulty pre-dictors . . . 127
6.1.4 Parameter optimization for language modelling-based query expansion . . . 128
6.2 Future work . . . 129
6.2.1 Redefining difficulty . . . 129
6.2.2 Latent Dirichlet allocation for selective IR . . . 129
6.2.3 Features for learning in selective IR . . . 130
Author’s publication list 131
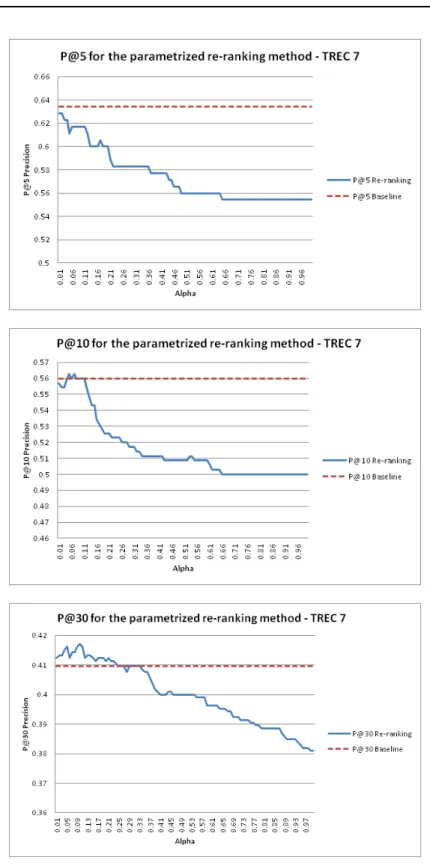
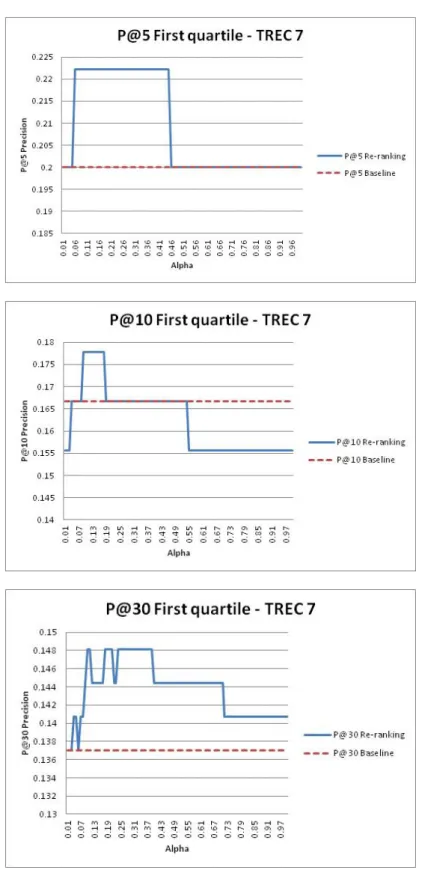
2.1 Precision after the first 5, 10 and 30 retrieved documents, compared to the baseline, for the parametrized method, over TREC7 . . . 60 2.2 Precision after the first 5, 10 and 30 retrieved documents, compared
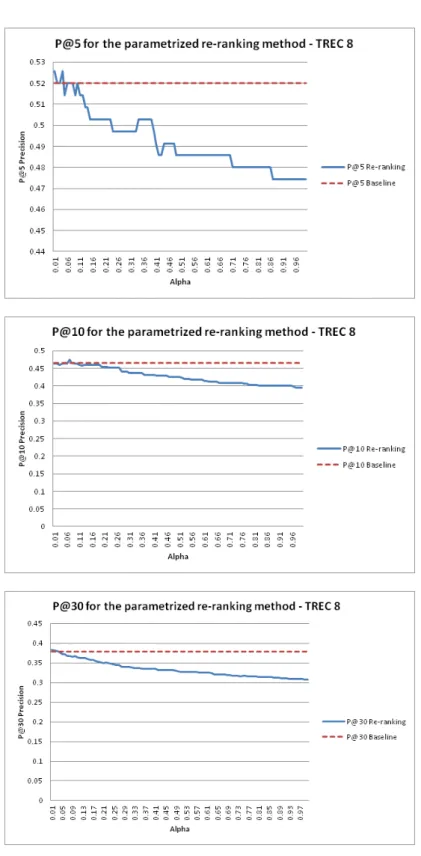
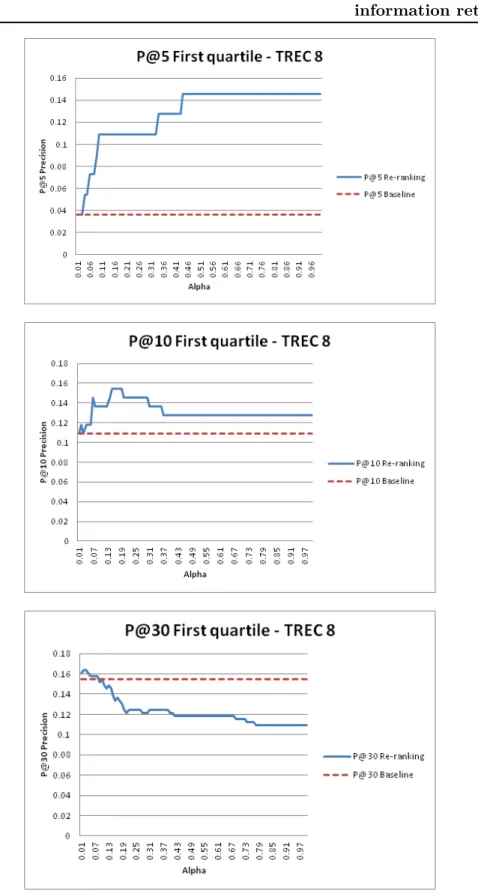
to the baseline, for the parametrized method, over TREC8 . . . 61 2.3 Precision after the first 5, 10 and 30 retrieved documents, obtained
for the lowest precision queries, compared to the baseline, for the parametrized method, over TREC8 . . . 63 2.4 Precision after the first 5, 10 and 30 retrieved documents, obtained
for the lowest precision queries, compared to the baseline, for the parametrized method, over TREC8 . . . 64 2.5 The results for the three test collections by the top levels of precision 66 2.6 P@5 by the intervals of performance corresponding to the TREC7,
TREC8 and WT10G collections . . . 69 5.1 The results for the three test collections by the top levels of precision 122 5.2 The results for the three test collections by the top levels of precision 123
1.1 Basic DFR models . . . 19
1.2 Main term-ranking functions based on the analysis of term distribu-tion in pseudo-relevant documents by [Carpineto 2012] . . . 23
1.3 Performance measure clusters with their corresponding population, by [Baccini 2012] . . . 29
1.4 Topic and document features from the data collections . . . 32
2.1 The number of ambiguous queries for the data collections . . . 56
2.2 Topic and document features from the data collections . . . 57
2.3 Number of part-of-speech elements from the ambiguous queries, for TREC7 and TREC8 . . . 58
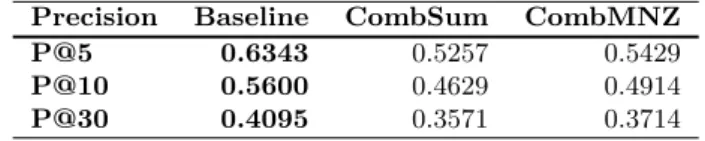
2.4 Baseline, CombSum and ComMNZ results for all the ambiguous queries (TREC7) . . . 59
2.5 Baseline, CombSum and ComMNZ results for all the ambiguous queries (TREC8) . . . 59
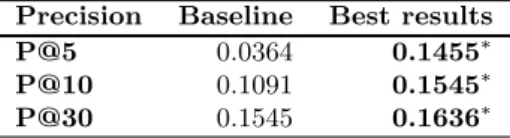
2.6 Baseline and best results for the lowest precision queries, over TREC7 (∗ marks statistically significant results, p-value < 0.05) . . . 62
2.7 Baseline and best results for the lowest precision queries, over TREC8 (∗ marks statistically significant results, p-value < 0.05) . . . 62
2.8 Comparison with the co-occurrence-based methods and with the Naïve Bayes-based method, by the top precisions, for the TREC7 collection (** represents p-value <10−6), compared to Best Run . . . 67
2.9 The number of improved queries, by the top precisions, for CMNZ-WB-SB-0.1 (Schütze) and Spectral Clustering-0.1 . . . . 68
2.10 The peak and average improvements for each baseline precision in-terval (∗∗ represents p-value <10−4) . . . 70
2.11 The peak improvements, by the number of ambiguous terms, for each top precision (∗∗ represents p-value < 10−4) . . . 70
2.12 TREC7, P@k for the considered runs . . . 72
2.13 TREC8, P@k for the considered runs . . . 73
2.14 WT10G, P@k for the considered runs . . . 73
3.1 Summary on query difficulty predictors . . . 82
3.3 Correlation coefficients between the reimplemented predictors and
the difficulty measure, for TREC7 and TREC8 . . . 86
3.4 Correlations between IDF and AP , per systems, for TREC7. The MAP for each system is also mentioned . . . 90
3.5 Correlations between IDF and AP , per systems, for TREC8. The MAP for each system is also mentioned . . . 90
3.6 Correlation coefficients between the proposed predictors and the dif-ficulty measure, for TREC7 and TREC8 . . . 91
4.1 The baseline MAP values, for each collection . . . 102
4.2 The learning feature list based on query difficuly predictors . . . 102
4.3 The mathematical expression for several SVM kernels . . . 103
4.4 The improvements in terms of MAP (*: p-value< 0.05; **: p-value< 0.001) . . . 104
4.5 The robustness analysis (*: p-value< 0.05; **: p-value< 0.001) . . . 105
5.1 Individual predictor correlation with Average Precision (AP), for Ro-bust and WT10G . . . 115
5.2 Linear regression feature weights, for Robust and WT10G collections 116 5.3 Correlation values in the case of regression, for different number of features, for train and test sets, over Robust and WT10G collections 117 5.4 SVM accuracy, for different number of features, for train and test sets, over Robust and WT10G collections . . . 117
5.5 Predicting λ using pseudo-qrels, over Robust, WT10G, TREC123 and TREC5 collections ("cons.q" stands for "considered queries") . . 118
5.6 Predicting λ knowing the AP of QL and RM1 . . . 120
5.7 Predicting λ using logistic regression with various feature models . . 121
IR Information Retrieval
IRS information retrieval system
TREC Text REtrieval Conference
QE Query Expansion
QF Query Feedback
TF Term Frequency
IDF Inverse Document Frequency
RI Robustness Index
AP Average Precision
MAP Mean Average Precision
DFR divergence from randomness
RM1 Relevance Model 1
RM3 Relevance Model 3
WN WordNet
API Application Programming Interface
PRF Pseudo Relevance Feedback
QL Query Likelihood
JSD Jensen-Shannon divergence
WS Word Sense
PRF pseudo-relevance feedback
The PhD thesis journey has come to its end. It has been an interesting, challenging and satisfying adventure. It has not been easy, but this enhances its beauty. First of all I would like to thank God for giving me power and patience. I was not alone during this period and I would like to address my acknowledgements to the people close to me. We have shared unforgettable moments, good or bad, happy or sad.
First of all, I would like to sincerely thank my adviser Josiane MOTHE whom has proven to be a great supervisor and manager. She is a precious mentor to me and she knew how to guide and motivate me. She has always treated me with patience and understanding. I am proud and happy to work with Josiane and she represents for me an example of determination, hard work, respect and optimism.
I also acknowledge my reviewers Patrice BELLOT and Jacques SAVOY for accepting to review my thesis and for their precious remarks.
The path for following a research career has been opened by Florentina HRIS-TEA, when I was a Master’s student. I am grateful to Prof. HRISTEA for many things. She has been a valued mentor, warmly guiding me and often giving me useful advice. But most important for me, I thank Prof. HRISTEA for offering me her friendship.
I thank my parents with all my heart. They gave me their unconditional love, all the time, no matter what. They fully supported me, they encouraged and trusted me with my decisions. They would do anything for my well being and I cannot thank them enough. I am happy that they are proud of me and I am completely proud with them.
I thank Mariannic for these years spent in her house at Ramonville. From my landlord at first, she quickly became my mother from France. Always with a good advice, positive thinking and a warm smile, she helped me feel like home, far from home. I cannot thank her enough.
I would like to thank Ionel DAVID for guidance, support, patience, life lessons and more. He unfortunately passed away before I could finish my PhD. He has introduced me to the art of acting since I was a child and he has always been by my side through important moments.
I would like to thank my teachers from university, especially Cristinel MORTICI, Emil LUNGU, Dinu TEODORESCU and Alin POHOATA for their guidance and precious discussions.
I would like to thank my friends from home for their support from distance: Mihai, Richard, Adina, Vlad, Andrei, Corina, Ioana, Georgiana, Andra and all that are not mentioned here.
moments spent together. Thank you, Dana, Madalina, Valentin, Laure, Cristina, Annette, Maria-Fernanda, Oana, Lavinia, Alexandra, Iulia, Andrei, Vali, Lavinia, Alex, Mihai.
I also would like to thank all people from IRIT for accepting me and helping me during my thesis, all my family members, colleagues and friends.
Special thanks to actual and former occupants of office 424. Thank you Léa, for being a good friend, colleague and for lending me your boyfriend to play drums in my band. Thank you Jonathan, for being such a good friend, confident, moral support and spiritual battery charger. Thanks, Anthony for being Anthony. Thank you Charlotte for the boost of good mood that you brought in our office. We have shared memorable moments and events together. Thanks Jeremy and Damien for being nice, good colleagues.
Infinite thanks for Alina, how has bravely endured my rhythm of life from the end of my thesis. She encouraged me, constantly supported and comforted me during this important period in my career. I thank Alina with all my heart for the great and unforgettable moments that she offered me.
I would like to address my most special thanks to my dear friend Radu. I have learned a lot from him, I respect him and I am happy to be his friend. Meeting Radu has been a life changing event. I owe him a lot of what I have become in the last few years. We have spent awesome moments together and I am looking forward for the moments to come. I also thank Andreea, his future wife, for being a good, supporting friend. She always knew how to bring joy and amusement when I was in trouble.
In the search engine environment, users submit queries according to their infor-mation needs. In response to a query, the system retrieves and displays a list of documents which it considers of interest to the user. The user analyzes the re-trieved results and decides what information is actually relevant to the information need. However, for some queries, the retrieved documents may not satisfy the user. Queries for which the search engine is not able to deliver relevant information are called difficult queries. Query difficulty represents the research context of this the-sis. More specifically, we aim at adapting the information retrieval systems with respect to query difficulty, in order to improve the quality of search.
Term ambiguity may be the cause of query difficulty. For example, the query "orange" is ambiguous, since the engine does not know whether it refers to the fruit, to the color, or to the telephone company. As a first contribution, we have developed a re-ranking method for retrieved documents, based on query term disambiguation, in order to obtain better retrieval performance. This method works best on difficult queries, result that motivates our research in query difficulty prediction.
If it was possible to anticipate the difficulty of a query, the difficult queries could be handled in a special manner in order to optimize retrieval results. This observation, corroborated with the findings of our first contribution, led us to our second contribution, on the query difficulty. State-of-the-art predictors are not accurate enough for real applications. Thus, we propose combinations based on linear interpolations of difficulty predictors to improve the prediction quality of individual predictors.
Retrieval results can also be improved by the query expansion process which adds terms to the original query. Even if the query expansion is effective on average over several queries, some of the queries may be degraded. It would be interesting to know how to expand each query in order to improve performance. Our third contri-bution is an automatic learning method to classify queries by two query expansion variants. Learning is done on features extracted from query difficulty predictors.
Our fourth and last contribution represents an analysis conducted on the pa-rameter optimization in the case of a query expansion model. The papa-rameter that we aim to optimize adjusts the impact of the original query in the expanded query. We test several hypotheses with and without prior information, such as learning, pseudo relevance judgments, logistic regression and similarity measures. The results show that this optimization remains a difficult problem.
Dans l’environnement des moteurs de recherche, les utilisateurs saisissent des re-quêtes en fonction de leurs besoins d’information. En réponse à une requête, le système récupère et affiche une liste de documents qu’il considère comme sus-ceptibles d’intéresser l’utilisateur. L’utilisateur consulte les documents retrouvés et décide quelles informations sont réellement pertinentes par rapport au besoin d’information. Toutefois, les documents retrouvés pour certaines requêtes peuvent ne pas être satisfaisants pour l’utilisateur. Les requêtes pour lesquelles le moteur de recherche n’arrive pas à délivrer l’information pertinente sont appelées difficiles. La difficulté des requêtes représente le contexte de recherche de cette thèse. Nous visons plus spécifiquement à adapter le système de recherche d’information par rapport aux requêtes difficiles, afin d’améliorer la qualité de la recherche.
L’ambiguïté des termes peut-être la cause de la difficulté. Par exemple, la requête "orange" est ambiguë, puisque le moteur ne sait pas si elle se réfère au fruit, à la couleur, ou à la compagnie téléphonique. Comme première contribution, nous avons développé une méthode de ré-ordonnancement des documents retrouvés basée sur la désambiguïsation des termes des requêtes, dans le but d’obtenir de meilleurs résultats de recherche. Cette méthode fonctionne mieux sur les requêtes difficiles, résultat qui motive nos recherches dans la prédiction de la difficulté.
S’il était possible pour d’anticiper la difficulté d’une requête, les requêtes diffi-ciles pourraient être traitées d’une manière particulière pour optimiser les résultats de recherche. Cette observation, complétée par les conclusions de notre première contribution, nous a menés vers notre deuxième contribution, sur la prédiction de la difficulté des requêtes. Les prédicteurs de l’état de l’art ne sont pas suffisam-ment précis pour des applications réelles. Ainsi, nous proposons des combinaisons basées sur des interpolations linéaires des prédicteurs de difficulté afin d’améliorer la qualité de prédiction.
Les résultats de recherche peuvent aussi être améliorés par l’expansion de re-quête, procédé qui rajoute des termes à la requête initiale. Même si l’expansion de requêtes est efficace en moyenne sur plusieurs requêtes, certaines requêtes peuvent être dégradées. Il serait donc intéressant de savoir comment réaliser cette expansion, pour chaque requête afin d’obtenir de meilleures performances de recherche. Notre troisième contribution est une méthode automatique d’apprentissage pour classifier les requêtes selon deux variantes d’expansion de requêtes. L’apprentissage est fait sur des caractéristiques extraites à partir des prédicteurs de difficulté.
Enfin, notre quatrième contribution représente une analyse portée sur l’optimi-sation d’un paramètre afin d’améliorer un modèle d’expansion des requêtes. Ce paramètre ajuste l’importance de la requête initiale dans le modèle étendu de re-quête. Nous vérifions plusieurs hypothèses sans et avec information a priori, comme l’apprentissage, les pseudo jugements de pertinence, la régression logistique et les
mesures de similarité. Les résultats montrent que cette optimisation reste un prob-lème difficile.
The field of information retrieval (IR) studies the mechanisms to find relevant infor-mation in one or more document collections, in order to satisfy a user’s inforinfor-mation need. For an IR system, the information to find is represented by "documents" and the information need takes the form of a "query" formulated by the user.
The performance of an IR system depends on queries. Queries for which IR systems fail (little or no relevant documents retrieved) are called in the literature "difficult queries". This difficulty may be caused by term ambiguity, unclear query formulation, the lack of context for the information need, the nature and structure of the document collection, etc.
This thesis aims at adapting IR system to contexts, particularly in the case of difficult queries. The manuscript is organized into five main chapters, besides acknowledgements, general introduction, conclusions and perspectives.
The first chapter is an introduction to IR. We develop the concept of relevance, the retrieval models from the literature, the query expansion and the evaluation framework used in the experiments, which were used to validate our proposals. Each of the following chapters presents one of our contributions.
Each of the following chapters raises the research problem, indicates the related work, our theoretical proposals and their validation on benchmark collections.
In chapter two, we present our research on treating the ambiguous queries. The query term ambiguity can indeed lead to poor document retrieval of documents by the search engine. In the related work, the disambiguation methods that yield good performance are supervised [Zhong 2012], however such methods are not ap-plicable in a real IR context, as they require the information which is normally unavailable. Moreover, in the literature, term disambiguation for IR is declared under optimal [Sanderson 1994], [Guyot 2008]. In this context, we propose an un-supervised query disambiguation method and show its effectiveness. Our approach is interdisciplinary between the fields of natural language processing and IR. The goal of our unsupervised disambiguation method is to give more importance to the documents retrieved by the search engine that contain the query terms with the specific meaning identified by disambiguation. This document re-ranking offers a new document list that contains more relevant documents to the user. We evaluated this document re-ranking method after disambiguation using two different classifi-cation techniques (Naïve Bayes [Chifu 2012] and spectral clustering [Chifu 2015], over three document collections and queries from the TREC competition (TREC7, TREC8, WT10G). We have shown that the disambiguation method we proposed works specifically well in the case of poorly performing queries (7.9% improvement compared to state-of-the-art methods).
Indeed, if term ambiguity is a difficulty factor, it is not the only one. We completed the range of difficulty predictors by relying on the state-of-the-art predictors that are divided in two main categories: pre-retrieval and post-retrieval predictors. Post-retrieval predictors need the results of the Post-retrieval process, such as document scores, or retrieved document ranks. The existing predictors are not sufficiently effective and stable to be used in concrete applications and therefore we introduce two new difficulty prediction measures that combine predictors by interpolating the value of a pre-retrieval predictor with the value of a post-retrieval predictor. Other researchers such as [Hauff 2009] or [Kurland 2012], have studied predictor combinations, but in different manners. We also propose a robust method to evaluate difficulty predictors. Using predictor combinations, on TREC7 and TREC8 collections, we obtain an improvement of 7.1% in terms of prediction quality, compared to the state-of-the-art [Chifu 2013].
In the fourth chapter we focus on the application of difficulty predictors. Specifi-cally, we proposed a selective IR approach, that is to say, predictors are employed to decide which search engine, among many, would perform better for a query. In the literature, various applications employed learning based on predictors in different domains, such as cross-language Information Retrieval [Lee 2014], or query routing in the case of domain specific collections [Sarnikar 2014]. Our decision model is learned by SVM (Support Vector Machine). We tested our model on TREC bench-mark collections (Robust, WT10G, GOV2). The learned model classified the test queries with over 90% accuracy. Furthermore, the research results were improved by more than 11% in terms of performance, compared to non-selective methods [Chifu 2014].
In the last chapter, we treated an important issue in the field of IR: the query expansion by adding terms. It is very difficult to predict the expansion parameters or to anticipate whether a query needs the expansion or not. We present our contri-bution to optimize the lambda parameter in the case of RM3 (a pseudo-relevance model for query expansion), per query. Lv et. al [Lv 2009] tried to solve the same optimization problem by the means of regression, without obtaining conclusive re-sults. We manage to overcome their results, but our methods that surpass their performance require prior information. We tested several hypotheses, both with and without prior information. We are searching for the minimum amount of in-formation necessary in order for the optimization of the expansion parameter to be possible. The results are not satisfactory, even though we used a wide range of methods such as SVM, regression, logistic regression and similarity measures. Some improvements with respect to baselines are noticeable. However, these im-provements are not important enough to declare the problem as solved. Therefore, these findings may reinforce the conclusion regarding the difficulty of this optimiza-tion problem. The research was conducted not only during a three months research mobility at the Technion Institute in Haifa, Israel, in 2013, but thereafter, keep-ing in touch with the team of Technion. In Haifa, we worked with Professor Oren Kurland and PhD student Anna Shtok.
In conclusion, in this thesis we propose new methods to improve the perfor-mance of IR systems, based on the query difficulty. The results of the methods proposed in chapters two, three and four show significant improvements and open perspectives for future research. The analysis in chapter five confirms the difficulty of the optimization problem of the concerned parameter and encourages thorough investigation on selective query expansion settings.
In order to ease the reading, the lists of abbreviations, figures and tables are integrated at the beginning of this manuscript.
Information retrieval framework
Contents
1.1 Relevance . . . . 13 1.2 IR models . . . . 15
1.2.1 Vector space model . . . 16 1.2.2 Okapi BM25 model . . . 17 1.2.3 Divergence from randomness model . . . 18 1.2.4 Language model . . . 20 1.3 Query expansion . . . . 22 1.4 Evaluation . . . . 24 1.4.1 Evaluation measures . . . 26 1.4.2 Statistical measures . . . 30 1.4.3 Benchmark collections . . . 31 1.4.4 TREC topics and queries . . . 32 1.4.5 TREC runs and participants . . . 33 1.4.6 IR platforms . . . 34
1.5 Conclusion . . . . 35
In this chapter we introduce the notions used throughout the entire manuscript. We start from the concept of relevance and its meaning. Thus, we discuss the con-cepts of relevance and evaluation in IR, the query expansion principles and models, we present the benchmark collections and the framework we used to implement our models.
1.1
Relevance
Humans have always been interested in knowing and their curiosity yielded the dis-coveries that lead to progress. A Latin aphorism says that "knowledge is power"1 and the key for this knowledge is information. However, with the amount of infor-mation exponentially growing around us, finding good inforinfor-mation has become a difficult task. The access to relevant information depends on the given task, on the
1
speed of retrieval, etc. In this context, computer science researchers from the field of Information Retrieval (IR) propose models in order to obtain information. "IR deals with the representation, storage, organization of, and access to information items" [Baeza-Yates 1999]. The organized information items and their representa-tion should provide easy access to relevant informarepresenta-tion. From the IR point of view, relevance would represent how well a retrieved document (or set of documents) satisfies the information need a user has.
Relevance also represents a concept that appears in other fields of study, such as logic, library, cognitive sciences and information science. A definition given by researchers in socio-cognitive area would sound as follows: "Something (A) is relevant to a task (T) if it increases the likelihood of accomplishing the goal (G), which is implied by T" [Hjörland 2002].
The relevance of retrieved information has always preoccupied scientists and, in the 1950s, with the appearance of the first IR systems [Mooers 1950], researchers underlined the issue of retrieving irrelevant articles. B.C. Vickery explicitly men-tioned the concept of relevance in 1958 at the International Conference on Scientific Information [Mizzaro 1997].
However, relevance is not of a single type, there are many kinds of relevance. In his paper [Mizzaro 1997], Mizzaro establishes a framework to classify the various types of relevance and defines two groups of entities. Relevance may be seen as the relation between no matter which two entities, each coming from one of the defined groups.
The first group contains the document, as a physical entity, its representation and the information, which represents what the user obtains while reading a docu-ment.
On the other hand, the second group has the following entities: the problem that a human is facing and that requires information in order to be solved, the information need, which is a representation of the problem, the request that is a human language representation of the information need and finally the query which is a representation of the information need in the language of computers.
Nevertheless, the IR process can be splitted in three components, which are topic (the subject area of interest), task (users activity with the retrieved documents) and context (everything that affects the way search and its evaluation take place).
The retrieval mechanism considers the query, which represents the information need, and matches it with the document representations. Then, the best candidate documents from the matching process are considered relevant by the system, thus they are proposed to the user. This scenario so far is a static one, however the IR process is englobed in a time interval, meaning that the time factor should be taken into account. For instance, a document may be irrelevant to a query, yet the same document may become relevant for the same query at a different time.
following dimensions [Mizzaro 1997]: • document, surrogate, information;
• problem, information need, request, query; • topic, task, context;
• the various time instances from the time elapsed between the appearance of the problem and its solution.
Having all these factors involved, there is place for errors. It is known that the user’s information needs are formally expressed by queries which are submitted to an information retrieval system (IRS), in order to retrieve documents. For example, if a query does not represent well enough the user’s information need, the search results will be poor. Therefore, badly formulated queries, or ambiguous queries, affect the retrieval performance. All queries that lead the IRS to performance failure are called difficult queries. Details on query difficulty will be provided in Chapter 3, which treats the matter of query difficulty prediction. Moreover, various systems can respond differently to submitted queries and it would be interesting to find out which system treats best a specific query. This represents the system variability issue in IR, reported in [Harman 2009]. We mention that query difficulty and system variability are challenges treated in this thesis. The system variability is related to a key factor for IR performance, which is the choice of the retrieval model.
In the following section we present several retrieval models from the literature that match documents to queries with the purpose of proposing presumably relevant information to users.
1.2
IR models
We present here several models employed to match documents and queries. The first model was proposed in the 70s by Lancaster in [Lancaster 1974] and it is called the boolean model. Based on the set theory, this model retrieves the documents which contain the query terms joined by logical operators, such as "OR", "AND", or "NOT". Even though this model has a clean formalism and its concept is intuitive and easy to implement, this exact matching method may retrieve too few or too many documents. Moreover, all terms are equally weighted and the output documents are difficult to rank. This is the reason why more recent models generally compute a similarity score between a document and a query, which is used to rank all retrieved documents for a query.
We present in the following sections the vector space model [Salton 1975], the BM25 model [Robertson 1994], the language model [Ponte 1998] and the divergence
from randomness (DFR) models [Amati 2002], in order to provide a brief outline of IR models. The vector space and the BM25 models are described here because they represent milestones in IR. On the other hand, DFR models are employed in this thesis in Chapter 2 as retrieval models for strong baselines. The language model is used in Chapter 4 for selective query expansion and in Chapter 5 for parameter optimizing in language model-based query expansion.
The vector space model represents the document and the query as vectors in the term space and employs the cosinus measure to determine their similarity.
The probabilistic models, such as the BM25 model, the DFR models, or the language model, are based on the probability theory to measure the query-document similarity.
1.2.1 Vector space model
The vector space model [Salton 1975] allows to compute a similarity score between a query and a document. Queries and documents are represented by weight vectors of their terms. The ranking score is expressed by the cosinus between the query vector and the document vector (Definition 1).
The relevance score of a document di with respect to a query q is given by the cosinus similarity measure between the two vectors, as follows:
s (q, di) = ∑m t=1(wtq· wti) √∑m t=1(wtq)2 √∑m t=1(wti)2 , (1.1)
where m is the number of terms, wtq represents the weight of the term t in the query q, wti is the weight of the term t in the document di and q = [w1q. . . wmq] and di = [w1i. . . wmi] are the representations in the term vector space, for the query q and for the document di, respectively.
Definition 1 (The vector space model)
The term weight is expressed by the TF .IDF weight [Robertson 1976]. The TF.IDF measure is defined using the Term Frequency (TF) and Inverse Document Frequency (IDF).
The TF represents the number of occurrences of a term in a document (or in a query).
The IDF represents the importance of a term from an entire set of documents (called corpus) and it is computed as follows:
IDF (t) = log ( N nt+ 1 ) , (1.2)
where N is the total number of documents and nt represents the number of doc-uments that contain the term t. Thus, the TF .IDF weighting of a term t in a document di is the product between TF and IDF:
T F · IDF (t, di) = T F (t, di)· IDF (t) (1.3) This term weighting method considers that not all terms have the same dis-criminating power. The term importance is defined based on their frequency in documents, thus the terms which are too frequent are penalized.
The probabilistic models, such as BM25, DFR and language models, are more recent and are considered as more effective than the vector space model.
1.2.2 Okapi BM25 model
Robertson and Walker have proposed in 1994 the Okapi BM25 system, which used the BM25 probabilistic model [Robertson 1994]. This family of relevance models defines the similarity score s (q, di) between a query q and a document di using the relevance and non relevance probabilities of documents, as follows:
s (q, di) = P (R|di) P ( ¯ R|di ), (1.4)
where P (R|di) is the probability that the document di is relevant for the query q, while P
(
¯ R|di
)
is the probability that di is not relevant for q. This score could be expressed as the sum of relevance weights wj for the terms tj (with j∈ {1, . . . , m}) found in the document:
s (q, di) = m
∑
j=1
wj1{tj∈di}, (1.5)
where1{tj∈di} is the characteristic function which takes the value 1 if the term tj is relevant for the document di and 0, otherwise. The relevance weights are expressed by relevance probabilities of terms for the document.
In [Robertson 1994] are proposed several approximations for these probabilities. The most commonly used version is the BM25 model (see Definition 2), based on TF and IDF .
The BM25 is widely used as baseline in IR, since it yields good results. Another widely employed probabilistic model, the divergence from randomness, is presented in the following section.
The similarity score of the BM25 model between a query q and a document di, denoted BM 25 (q, di), is defined as follows:
BM 25 (q, di) = m ∑ j=1 IDF (tj)· T F (tj, di)· (k1+ 1) T F (tj, dj) + k1· ( 1− b + b |di| avdl ), (1.6)
where T F and IDF are those defined in Section 1.2.1, |di| is the number of terms in the document di, k1 and b are tuning parameters and avdl
represents the average of term numbers, for all documents in the corpus. Definition 2 (The BM25 model)
1.2.3 Divergence from randomness model
The divergence from randomness (DFR) model [Amati 2004a] represents a gener-alized version of Harter’s 2-Poisson indexing-model [Harter 1974]. The 2-Poisson model is one of the first IR models and is based on the hypothesis that the level of treatment of the informative terms is endorsed by a representative set of documents, in which these terms occur more often than in the rest of the documents.
Of course, there are terms that do not possess representative documents, and thus their frequency follows a random distribution. This is the single Poisson model. Harter’s model, combined with the standard probabilistic model proposed by Robertson and Walker in [Robertson 1994], yielded the BM family of models, from which we mention the BM25 model, described in the previous section.
The idea behind the DFR models is the following: the divergence of the within-document term-frequency from its frequency within the collection is directly propor-tional with the information carried by the term t in the document di. Therefore, the term-weight is inversely proportional to the probability of term-frequency within the document di obtained by a randomness model M , as follows:
DF R (q, di)∝ −logP robM(t∈ di|Collection) , (1.7) where M stands for the type of model of randomness used to compute the proba-bility. IR is thus seen as probabilistic process, equivalent to the random placement of coloured balls into urns. Here, the balls are the terms and the urns are the doc-uments, respectively. There are several models to choose M , which provide a basic DFR model. The basic models are presented in Table 1.1.
For the model M represented by the binomial distribution (P ), the basic model formalized in Definition 3.
Table 1.1: Basic DFR models
Notation Model
D Divergence approximation of the binomial
P Approximation of the binomial
BE Bose-Einstein distribution
G Geometric approximation of the Bose-Einstein
I (n) Inverse Document Frequency model
I (F ) Inverse Term Frequency model
I (ne) Inverse Expected Document Frequency model
The DFR model based on the approximation of the binomial, for a term t in a document di, denoted by P , is defined as follows:
− logP robP(t, di|Collection) = −log
(
tf T F
)
pT Fqtf−T F, (1.8)
where T F is the one defined in in Section 1.2.1, tf is the term-frequency of the term t in the Collection, N is the number of documents in the Collection and p = 1/N and q = 1− p.
Definition 3 (DFR - binomial distribution P )
Similarly, if the model M is the geometric distribution, then the basic model G is formalized in Definition 4.
The DFR model based on the geometric distribution, for a term t in a document di, denoted by G, is defined as follows:
− logP robG(t, di|Collection) = −log
(( 1 1 + λ ) · ( λ 1 + λ )T F) , (1.9)
where tf is the term-frequency of the term t in the Collection, N is the number of documents in the Collection and λ = F/N .
Definition 4 (DFR - geometric distribution G)
T F can be normalized as follows:
T F n = T F · log ( 1 + c·sl dl i ) , (1.10)
where dli represents the length of document di, sl stands for standard document length and c is a free parameter.
In the following section we present the language model, which also represents a widely used probabilistic model.
1.2.4 Language model
In 1998, Ponte proposed the application of language models in IR [Ponte 1998]. The idea is to associate each document to its characterizing model, which allows to compute the probability that a term sequence would be generated from a document. Considering a query q with m terms, then the probability that a document di is relevant for q is equivalent to the probability P (q|di) that q has been generated by the document di. Assuming that the terms are independent, one can compute P (q|di), as follows: P (q|di) = m ∏ j=1 P (tj|di) , (1.11)
where tj are query terms, with j∈ {1, . . . , }. The most straightforward estimator for P (tj|di) is the maximum likelihood, PM L(tj, di) =
c (tj, di)
∑m
k=1c (tk, di)
, where c (tj, di) is the occurrence number of the term tjin the document di. There is a major downside for this estimator which is the fact that it assigns a null probability for the terms that are not present, thus, if a document contains all the query terms except for one, its probability will be zero, even if in fact it potentially responds to a part of the query. In order to solve this issue, several smoothing methods have been proposed. Zhai et al. [Zhai 2001] have studied the properties of three smoothing methods: Dirichlet, Jelinek-Mercer and the Absolute Discounting, presented in definitions 5, 6 and 7, respectively.
The probability that a term tj has been generated by the document di by the Dirichlet smoothing is the following:
PDIR(tj|di) = c (t∑j, di) + µPM L(tj|C) m k=1c (tk, di) + µ , (1.12) where PM L(tj|C) = c (tj, C) ∑m k=1c (tk, C)
, with c (tj, C) the occurrence number of the term tj in the corpus C, is the maximum likelihood estimator for P (tj|C), which represents the probability that the term tj has been gen-erated by the corpus C. µ > 0 represents controlling parameter for the smoothing.
The probability that a term tj has been generated by the document di by the Jelinek-Mercer smoothing is the following:
PJ M(tj|di) = (1− λ) PM L(tj|di) + λPM L(tj|C) , (1.13) where P (tj|di) and P (tj|C) represent the probability that the term tj has been generated by the document di and by the corpus C, respec-tively. PM L(tj|di) =
c (tj, di)
∑m
k=1c (tk, di)
, with c (tj, di) the occurrence number of the term tj in the document di, is the maximum likelihood estimator for P (tj|C), which represents the probability that the term tj has been generated by the corpus C. PM L(tj|C) =
c (tj, C)
∑m
k=1c (tk, C)
, with c (tj, C) the occurrence number of the term tj in the corpus C, is the maximum likeli-hood estimator for P (tj|C), which represents the probability that the term tj has been generated by the corpus C. λ ∈ [0, 1] represents a smoothing factor.
Definition 6 (Jelinek-Mercer smoothing)
The probability that a term tj has been generated by the document di by the Absolute Discounting smoothing is the following:
PABS(tj|di) =
max (c (tj, di)− δ, 0) + δ |di|u
∑m
k=1c (tk, di)
, (1.14)
where c (tj, di) is the occurrence number of the term tj in the document di, |di|u represents the number of unique terms in the document di and δ∈ [0, 1] is a constant which limits the importance of terms known by the language model.
Definition 7 (Absolute Discounting smoothing)
In [Zhai 2001], the authors underline that the performance of language models is very dependent on the parameter tuning and also it varies with the query type. Thus, the Jelinek-Mercer smoothing yielded better results on long queries, as op-posed to the other smoothing methods. However, it is difficult to decide which method is globally more efficient. Parameter optimization for language models is a matter also treated in this thesis (see Chapter 5).
Retrieval models have advanced significantly from the beginning to present day and researchers still seek for methods to push the limits of performance improve-ment. It is known that producing the query from the information need represents a crucial step for a successful retrieval [Lee 2009]. For this reason, there is research on
query refinement, reformulation and expansion. Adding useful terms to an initial query should improve, in theory, the quality of the retrieved results. We discuss the query expansion process in the following section.
1.3
Query expansion
"The relative ineffectiveness of IR systems is largely caused by the inaccuracy with which a query formed by a few keyword models the actual user information need" [Carpineto 2012]. A solution for this issue is Query Expansion (QE), where the initial query is augmented by new similar meaning features.
The logical operator "OR" implicitly connects the query terms in most document ranking models. Having this in mind, one query expansion advantage is that there is more chance to retrieve a relevant document that does not contain some of the original query terms, fact which improves recall. However, the added terms may cause query drift, losing the focus of a search topic, involving a loss in precision. On the other hand, the effectiveness of IR systems is usually evaluated taking into account both recall and precision and in this context, improvements of more than 10% have been reported [Mitra 1998], [Liu 2004], [Lee 2008]. In [Mitra 1998], the authors used manually formulated boolean filters to help automatic QE via ad hoc feedback. They have tested their method on Text REtrieval Conference (TREC) 3-6 collections, with improvements between 3-6% and 13%. Liu et al. [Liu 2004] tested their method to propose candidate expansion terms on TREC 9, 10 and 12. The method uses WordNet to disambiguate the word senses for the query terms and its synonyms, hyponyms together with words from the definitions become candidate terms. The authors have reported 23%-31% of improvements. Another method, proposed in [Lee 2008], employed cluster-based resampling in order to obtain better pseudo-relevant documents for feedback. The authors have tested the method on TREC collections (GOV2, WT10G, Robust) with improvements between 6% and 26%. These claims support the hypothesis that QE is beneficial for IR, but these techniques might not suffice for approaches mainly interested in improving precision.
Moreover, these improvements are reported in average, over multiple queries. This means that performance of some queries, in terms of AP, may decrease after expansion [Sakai 2005]. Therefore, the performance of a QE system should be also checked whether it is robust, or not. Sakai et al. [Sakai 2005] have proposed a measure called Robustness Index, which takes into account the number of queries that are harmed by expansion and the queries that are improved by expansion. This measure is normalized by the total number of queries and the possible values are between -1 and 1. The value 1 characterizes the most robust results, with no queries harmed by the process of expansion. Contrarily, the value -1 suggests that all queries have a decreased AP after expansion. The Robustness Index is defined as follows:
For a set of queries Q the Robustness Index (RI) is computed by the for-mula:
RI (Q) = n+− n−
|Q| , (1.15)
where n+ is the number of improved queries, n− the number of degraded
queries and|Q| the total number of queries. Definition 8 (Robustness index)
There are several techniques to generate and rank the candidate expansion terms. We discuss here about the analysis of feature distribution in top-ranked documents and about the query language modeling.
The idea for the feature distribution in top-ranked documents is to assume that the first retrieved documents in response to the original query are relevant (Pseudo-Relevance Feedback [Buckley 1994]). Expansion terms are extracted from these documents. Of course this process is highly dependent on the quality of the top retrieved documents. We present the main term-ranking functions based on term distribution for a set of pseudo-relevant documents in Table 1.2. The notations are the following: w(t, d) is the weight of a term t in pseudo-relevant document d, P (t|R) and P (t|C) represent the probability of occurrence of t in the set of pseudo-relevant documents R and in the whole collection C, respectively.
Table 1.2: Main term-ranking functions based on the analysis of term distribution in pseudo-relevant documents by [Carpineto 2012]
Reference Function Mathematical formula
[Rocchio 1971] Rocchio’s weights ∑
d∈R
w(t, d)
[Robertson 1976] Binary independence model (BIM) logP (t|R)[1 − P (t|C)] P (t|C)[1 − P (t|R)]
[Doszkocs 1978] Chi-square [P (t|R) − P (t|C)]
2
P (t|C)
[Robertson 1990] Robertson selective value (RSV) ∑ d∈R
w(t, d)· [P (t|R) − P (t|C)]
[Carpineto 2001b] Kullback-Leibler distance (KLD) p(t|R) · logP (t|R) P (t|C)
From the query language modeling we present here the relevance model proposed in [Lavrenko 2001], called Relevance Model 1 (RM1), because it is a widely used model and, moreover, we employ it in our experiments in chapters 4 and 5. Lavrenko and Croft use the query likelihood P (q|d) as the weight for document d and they consider an average of the probability of term t given by each language model of documents. The formula to compute RM1 is the following:
PRM 1(t|q) ∝ ∑ θd∈Θ P (t|θd) P (θd) m ∏ i=1 P (qi|θd) , (1.16)
where Θ represents the set of smoothed document models in the pseudo-relevant document set R and q ={q1, q2, . . . , qm}. In RM1, the Dirichlet smoothing method is used to smooth the language model of each pseudo-relevant document θd.
The relevance model PRM 1(t|q) can be interpolated with the model of the initial query θq in order to obtain performance improvements [Abdul-Jaleel 2004]. There-fore, this interpolated relevance model, called Relevance Model 3 (RM3), is com-puted as follows: PRM 3 ( t|θ′ q ) = (1− λ) P (t|θq) + λPRM 1(t|q) (1.17) We use RM1 and RM3 later on in our experiments, since they yield effective retrieval results, thus they represent strong baselines.
There is no optimal way to automatically expand the queries and the automatic QE process may actually harm system performances. However, when the right choices are made and when the parameters are properly tuned, the expansion is beneficial. For instance, in [Lv 2009] the authors aimed to optimize the balance parameter (λ from RM3 interpolation), by the means of logistic regression. Their improvements were, however, very close to the baseline (from 0.340 to 0.356 over TREC6, TREC7 and TREC8). Therefore, tuning the λ parameter in the RM3 interpolation remains an open problem that we also try to approach in this thesis. The information relevance to a topic is measured using benchmark collections and the evaluation tasks started in the early 1960s with the Cranfield Experiments, then continued to this day with the tracks from the Text REtrieval Conference (TREC), which represents the main evaluation framework in IR. TREC is an an-nual workshop hosted by the US government’s National Institute of Standards and Technology which provides the necessary infrastructure for the large-scale evaluation of text retrieval methods2. In the following sections we discuss the IR evaluation and the benchmark collections.
We have introduced here the classic models of query expansion. For a more detailed related work overview, see chapters 4 and 5.
1.4
Evaluation
The vector space model, the probabilistic model, or the language model, together with their parameter tuning, combinations and variants, represent the wide variety of IRS. This high rate of possible choices regarding IR algorithms raises the question of which model is better.
Yet, the notion of "better" depends of various aspects, such as efficiency and effectiveness. Firstly, the most common dimensions of system efficiency are time and space. A better system from this point of view is one which yields a shorter
2
response time and one which uses a smaller hard disk space. These aspects rep-resent the efficiency level of user satisfaction. The interface quality also plays an important role for user satisfaction [Speicher 2014]. Secondly, there is the quality of response according to the information need. This evaluation perspective measures how well the system managed to retrieve relevant information, with respect to the information need. This represents the effectiveness level of user satisfaction.
One approach to evaluate IRS, in terms of effectiveness, is the explicit feedback by the means of user study. The assumption, in the case of an user study, is that system performance and users’ satisfaction are proportional. For this type of evaluation, users are hired, they complete some tasks using the systems and finally they report their subjective feeling. Even if this type of performance evaluation is close to reality, a user study is subjective and expensive in terms of time and money [Kelly 2009]. Of course, experiments on a smaller scale could be set up, but this implies biased results.
An alternative for the user study is the usage of test collections, built by fol-lowing the Cranfield Paradigm. This paradigm was proposed in the early 1960s at Cranfield College of Aeronautics, England by Cyril Cleverdon, who conducted research on indexing methodologies and who showed that manual indexing was not needed. He also developed this evaluation methodology, which was quickly adopted by the IR community. The paradigm implies a test collection, which consists of a static set of documents, a set of topics and the set of known relevant documents for each of the topics, that is to say the relevance judgments. For the evaluation process it is required for a system to retrieve documents from the collection, for each topic. Evaluation measures are then applied on the retrieved list, on a per topic basis, against the relevance judgments. The scores for each topic are averaged and the resulting score represents the effectiveness score for the IRS. This evaluation paradigm should have an exhaustive assessment, which is expensive and unpracti-cal for nowadays large collections, therefore the assessment based on pooling was introduced by TREC [Harman 1993] and it is employed in practice. The traditional pooling method is to select documents for assessment by running a set of represen-tative retrieval systems against the collection, and pool their top-ranked results. The main advantage regarding the Cranfield approach is that the experiments are reproducible and comparable, a fact very important in a research context, since we need to test models and to compare performance with other systems.
Another facet of evaluation is the implicit feedback, based on user behavior (such as clicks), which obtains relevance judgments from user behavior. The
im-plicit feedback, as the exim-plicit feedback, also involves real users, it is cheaper than the Cranfield paradigm and much larger in terms of sample size [Joachims 2002]. However, it yields user behavior noise and tail search distribution. The long-tail distribution is induced by the existence of few popular choices together with a high number of rarely chosen documents, probably due to the fact that the user tends to click on the documents from the top of the retrieved list. The implicit feedback uses a small proportion of traffic for evaluation in two alternative ways:
by showing results from different retrieval methods alternatively, or by merging the results into a document list.
Regarding the evaluation in IR, we may summarize that the ground-truth is represented by the choice of real users, that method evaluation can be decomposed into efficiency, effectiveness and interface quality, that reusable test collections are useful and that user behavior (log) is really important and represents a kind of wealth. In our research we use Cranfield paradigm-based benchmarks, since they provide the full evaluation environment (documents, topics, relevance judgments). Moreover, the evaluation in this context is reproducible and comparable, key factors for research. On the other hand, robust user studies are expensive and difficult to set up, therefore the explicit feedback is not appropriate to evaluate our work. The click models and user logs, that is to say the implicit feedback, are more suitable for the web environment. However, the implicit feedback represents a resource which is not so often available and we do not employ click models and user logs in our contributions.
In the following section we discuss the evaluation measures in the TREC context, which employs the Cranfield Paradigm for evaluation.
1.4.1 Evaluation measures
In order to establish the effectiveness of an IRS, or to rank and compare systems, various performance measures have been proposed in the literature. In TREC, participant runs (see Section 1.4.5) are evaluated using the trec_eval package in order to rank the participant systems. This package provides performance measures, including some measures that are derived from the two basic measures in IR: recall and precision. The precision is the fraction of the retrieved documents that are relevant, while the recall represents the fraction of the documents relevant to the query that are successfully retrieved. We describe here the precision at a cut-off level (P@k), the Average Precision (AP) and the Mean Average Precision (MAP), since they are widely employed by the IR community and we usee all of them in our experiments.
The trec_eval package also implements the precision at certain cut-off levels. A cut-off level is a rank that defines the retrieved set. For example, a cut-off level of ten defines the retrieved set as the top ten documents in the ranked list (P@10). These top precision measures are important in a real life context, where the user is interested in the relevant documents among the first 5 or 10 retrieved documents. For instance, in the case of a web search, users naturally tend to click on the links from the top of the retrieved list, thus the need for improvements regarding these particular top results. In our experiments, we use three cut-off levels: P@5, P@10 and P@30, which are high precision measures. The cut-off level precision is defined in Definition 9.
The precision P@k at a cut-off level k, for a query q, is defined as: P @k(q) = |relev@k|
k , (1.18)
where relev@k represents the set of relevant documents retrieved until the rank k.
Definition 9 (Precision P@k)
Average Precision (AP) is widely used in the literature as it involves both pre-cision and recall. By plotting the prepre-cision p(r) as a function of recall r, one would obtain the precision-recall curve. The AP computes the average of p(r), over the interval r∈ [0, 1], as expressed in Equation 1.19:
AP =
∫ 1
0
p (r) dr (1.19)
Equation 1.19 represents the area of the surface below the precision-recall curve. In practice, this integral is replaced with a finite sum over the positions in the rank list of retrieved documents, as follows:
AP = R
∑
k=1
P @k∆r (k) , (1.20)
where R is the number of retrieved documents, k is the rank, P@k is the preci-sion of the top k retrieved documents and ∆r (k) is the change in recall from two consecutive retrieved documents k− 1 and k.
This sum is equivalent to Definition 10.
The Average Precision (AP) for a query q is defined as:
AP (q) =
∑R
k=1[P @k× rel (k)]
relev (q) , (1.21)
where relev (q) represents the number of documents relevant to the query q and rel (k) equals 1 if the kth document is relevant and 0 otherwise.
Definition 10 (Average Precision (AP))
The AP is a per topic measure, however, when we need to evaluate the perfor-mance of a system for a set of topics from a collection, a per system measure should be employed. Thus, the Mean Average Precision (MAP) stands for the mean of the
average precision scores over queries. The MAP is a per system measure and its equation is presented in Definition 11.
For a set of queries Q, the Mean Average Precision (MAP) is defined as follows: M AP = 1 |Q| |Q| ∑ q=1 AP (q) . (1.22)
Definition 11 (Mean Average Precision (MAP))
We have presented here 3 measures for IRS evaluation, but in trec_eval there are 135 proposed measures. This fact raises the question of which or how many measures to use in order to obtain a proper evaluation process. Moreover, having this number of available measures, it would be interesting to find out whether these measures are somehow correlated one with each other, or not. In [Baccini 2012] the authors show that the measures can be clustered into highly correlated measure groups. They use 130 measures out of the 135 measures proposed in trec_eval. They also define a subset of weakly correlated performance measures by selecting a representative from each cluster. Thus, this representative group of measures could provide better insights regarding the system effectiveness. The authors used test collections from TREC2 to TREC8, together with the evaluations for the official participants at the corresponding TREC competitions. In the case of the most homogeneous clusters, any measure is a good representative of the cluster from the mathematical point of view. For the less homogeneous clusters, on the other hand, Baccini et al. suggest to use the centroid and to consider both the distance to the centroid and the popularity of the measure, in terms of usage. The authors mention that the most homogeneous clusters (compact clusters) are clusters 1, 3, 4 and 5. All the measure clusters are given in Table 1.3.
We notice that the cluster populations are not balanced and we underline that the AP belongs to the 4th cluster 4, while the P@5, P@10 and P@30 are in the 1st cluster. However, P@100 belongs to the 2nd cluster, therefore the P@k measures and the AP are not relatively redundant and the redundancy of P@k measures depends on k. Even though P@5, P@10 and P@30 belong to the same measure cluster, we employ these three measures in our contribution which re-ranks retrieved document lists based on query terms disambiguation (see Chapter 2). As a re-ranking method, our interest stresses on the changes occurred in the top of the document list. We aim to check how much improvement is obtained in the top 5 documents, this being also a realistic scenario when users check only the first retrieved documents. On the other hand, we also would like to know what happens further in terms of improvement, when the document limit reaches 30. All this justifies the usage of both P@k and AP in our research without redundancy.
Table 1.3: Performance measure clusters with their corresponding population, by [Baccini 2012]
Clusters
Cluster 1 (23 measures)
relative_unranked_avg_prec30 • relative_unranked_avg_prec20 • relative_prec30 • map_at_R • relative_unranked_avg_prec15 • relative_prec20 • P30 • relative_prec15 • int_0.20R.prec• relative_unranked_avg_prec10 • X0.20R.prec • ircl_prn.0.10 • P20 • P15
• relative_prec10 • bpref_10 • P10 • relative_unranked_avg_prec5 • relative_prec5 • P5 •
bpref_5• recip_rank • ircl_prn.0.00
Cluster 2 (16 measures)
P100• P200 • unranked_avg_prec500 • unranked_avg_prec1000 • bpref_num_ret • P500 • bpref_num_all• P1000 • num_rel_ret • exact_unranked_avg_prec • num_rel • exact_prec
• bpref_num_correct • utility_1.0_.1.0_0.0_0.0 • exact_relative_unranked_avg_prec •
bpref_num_possible
Cluster 3 (12 measures)
bpref_top10Rnonrel • bpref_retnonrel • relative_unranked_avg_prec500 • avg_relative_prec • recall500 • relative_prec500 • bpref_allnonrel • rela-tive_unranked_avg_prec1000 • exact_recall • recall1000 • relative_prec1000 • ex-act_relative_prec
Cluster 4 (45 measures)
X1.20R.prec • ircl_prn.0.30 • X1.40R.prec • int_map • X1.00R.prec • R.prec • int_1.20R.prec • exact_int_R_rcl_prec • int_1.00R.prec infAP • avg_doc_prec • map • X11.pt_avg • X1.60R.prec • int_0.80R.prec • int_1.40R.prec • X0.80R.prec • old_bpref_top10pRnonrel • ircl_prn.0.40 • X1.80R.prec • int_1.60R.prec • X3.pt_avg bpref • X2.00R.prec • bpref_top25p2Rnonrel • old_bpref • bpref_top10pRnonrel • int_1.80R.prec • int_0.60R.prec • int_2.00R.prec • bpref_top25pRnonrel • X0.60R.prec • bpref_top50pRnonrel• bpref_top5Rnonrel • ircl_prn.0.20 • ircl_prn.0.50 • int_0.40R.prec
• X0.40R.prec • int_map_at_R • ircl_prn.0.60 • unranked_avg_prec30 • ircl_prn.0.70 •
ircl_prn.0.80• unranked_avg_prec200 • unranked_avg_prec100
Cluster 5 (18 measures)
bpref_topnonrel • fallout_recall_42 • fallout_recall_28 • fallout_recall_56 • rcl_at_142_nonrel• fallout_recall_71 • fallout_recall_85 • relative_unranked_avg_prec100
• fallout_recall_99 • fallout_recall_113 • relative_prec100 • fallout_recall_127 •
rela-tive_unranked_avg_prec200 • fallout_recall_142 • recall100 • relative_prec200 • recall200
• bpref_retall
Cluster 6 (13 measures)
fallout_recall_14 • unranked_avg_prec20 • unranked_avg_prec15 • ircl_prn.0.90 • fall-out_recall_0 • unranked_avg_prec10 • recall30 • ircl_prn.1.00 • recall20 • recall15 • un-ranked_avg_prec5• recall10 • recall5
Cluster 7 (3 measures)
rank_first_rel• num_nonrel_judged_ret • num_ret
We have seen that evaluation measures are employed in order to establish the performance of an IRS. However, when one tries to improve performance, com-pared with a baseline result, the relative improvement percentage or the average improvement may be computed. This raises the question whether these improve-ments are statistically significant, or not. Thus, statistical tests are required. In the following section we present the correlation coefficient employed to check the correlation between two variables and the statistical significance test employed to check our experimental results, when compared to various baselines.
![Table 1.2: Main term-ranking functions based on the analysis of term distribution in pseudo- pseudo-relevant documents by [Carpineto 2012]](https://thumb-eu.123doks.com/thumbv2/123doknet/2091924.7437/33.892.181.738.706.892/table-ranking-functions-analysis-distribution-relevant-documents-carpineto.webp)