47 P. Duarte and J.M. Santana-Casiano (eds.), Oceans and the Atmospheric Carbon Content, DOI 10.1007/978-90-481-9821-4_3, © Springer Science+Business Media B.V. 2011
Abstract The present day contemporary CO2 fluxes in shelf seas could be significant for the global carbon cycle, since available estimates converge to a sink of ~0.3 PgC yr-1 corresponding to 21% of most recent estimate of contemporary
sink of atmospheric CO2 in open oceans of 1.4 PgC yr-1. These estimates are
prone to large uncertainty mainly due to inadequate representation of the spatial variability and need to be improved based on more data, requiring a concerted global observational effort. The potential feedbacks on increasing atmospheric CO2 from changes in carbon flows in the coastal ocean could be disproportionately higher than in the open ocean. The changes in carbon flows and related potential feedbacks in the coastal ocean could be driven by 3 main processes: i) changes in coastal physics; ii) changes in land-used, waste water inputs, agricultural fertilizers and changes in hydrological cycle; iii) changes in seawater carbonate chemistry (ocean acidification). These potential feedbacks remain largely unquantified due to a poor understanding of the underlying mechanisms, or lack of modelling to quantify them. Based on reported evaluations and back of the envelop calcula-tions, it is suggested that changes of biological activity due the increased nutrient delivery by rivers would provide by 2100 a negative feedback on increasing atmo-spheric CO2 of the order of magnitude of the present day sink for atmospheric CO2. This negative feedback on increasing atmospheric CO2 would be one order of magnitude higher than negative feedback due to the decrease of either pelagic or benthic calcification related to ocean acidification, and than the negative feedback related to dissolution of CaCO3 in sediments. The increase of export production could also provide a significant feedback to increasing atmospheric CO2, although based on the conclusions from a single perturbation experiment. Feedbacks on increasing atmospheric CO2 due to effects of C cycling in continental shelf seas related to changes in circulation or stratification could be important but remain to be quantified.
A.V. Borges (*)
Chemical Oceanography Unit, University of Liège, Belgium e-mail: alberto.borges@ulg.ac.be
Present Day Carbon Dioxide Fluxes in the
Coastal Ocean and Possible Feedbacks Under
Global Change
Keywords Carbon dioxide fluxes • green house gases • global change • Coastal ocean • Coastal environments • Feedbacks • Land use • waste water inputs • Agricul-tural fertilizers • hydrological cycle • Atmospheric deposition • Ocean acidification warming of the climate system is unequivocal based on observational evidence from all continents and most oceans (increases in global average air and ocean tempera-tures, melting of snow and ice, and increasing global average sea level) (IPCC 2007a). The observed increase in global average temperatures since the industrial revolution is very likely due to increasing concentrations in the atmosphere of anthro-pogenic green house gases (ghg). global ghg emissions are expected to continue to grow over the next few decades, and warming and climate change in the near and long term will have a variety of negative impacts such as: changes in terrestrial and marine ecosystems (increased risk of species extinction, changes in ecosystem struc-ture and function, loss of biodiversity, loss of ecosystem goods and services,…), changes in crop productivity, increasing risks on coasts (coastal erosion, floods,…), increasing exposure to extreme weather events (heat waves, heavy precipitation events, incidence of extreme high sea level,…), effects on health status of millions of people (increases in malnutrition, diseases, injury due to extreme weather events,…), exacerbate current stresses on water resources,… (IPCC 2007b).
Carbon dioxide (CO2) is the most important anthropogenic ghg accounting for 77% of total anthropogenic ghg emissions in 2004 (IPCC 2007a). For the 2000–2006 period, 9.1 PgC year–1 (PgC = 1015 gC) of CO
2 were emitted to the atmosphere
mainly from fossil fuel combustion and cement production (7.6 PgC year–1) and
land use change (1.5 PgC year–1). About 4.1 PgC year–1 accumulated in the
atmo-sphere, the land biosphere is supposed to have absorbed 2.8 PgC year–1, and the
oceans have absorbed the remaining 2.2 PgC year–1 (Canadell et al. 2007). hence,
oceans are a major component of the global CO2 cycle. however, the oceans are also vulnerable to climate change with potential changes in their capacity to absorb anthropogenic CO2. These vulnerabilities include surface warming and related changes in circulation that will impact directly the chemical and physical oceanic CO2 pumps. Changes in ocean physics are also expected to modify the vertical inputs of inorganic nutrients and light availability (increasing stratification), hence, affecting primary production and ecosystem structure, and modifying the biologi-cal CO2 pump. The latter is also expected to respond to changes of seawater car-bonate chemistry (ocean acidification) that could modify the rates and fates of primary production and calcification of numerous organisms.
Coastal environments only represent 7% of the total oceanic surface area, how-ever, they are biogeochemically more dynamic, and probably more vulnerable to climate changes than the open ocean. whatever the responses of the open ocean to climate changes, they will propagate on the coastal ocean. Superimposed on this “background open oceanic forcing”, the coastal ocean will also respond to changes of fluxes from the land biosphere through rivers, ground waters and atmospheric deposition of major biogeochemical elements (carbon, nitrogen, phosphorous, silica) in organic and inorganic forms. Physical settings specific to the coastal ocean (coastal
upwelling, sea-ice,…) are also expected to respond to climate change probably leading to unique and local changes in carbon cycling. Finally, due to the shallowness of the coastal ocean, the benthic compartment will respond to changes of carbon cycling in surface waters on much shorter time scales than in the open ocean.
This chapter focuses on CO2 cycling in the coastal ocean, briefly summarizing the current knowledge on the present day fluxes, and focussing more in depth on the possible evolution and feedbacks under global change.
3.1 Present Day Carbon Dioxide Fluxes in the Coastal Ocean
Continental shelf seas receive massive inputs of organic matter and nutrients from land, exchange large amounts of matter and energy with the open ocean across continental slopes and constitute one of the most biogeochemically active areas of the biosphere. The coastal ocean hosts between ~15% and ~30% of oceanic primary production and ~80% of oceanic organic matter burial (e.g. gattuso et al. 1998a). It also hosts most of the benthic oceanic calcium carbonate (CaCO3) production, ~20% of surface pelagic oceanic CaCO3 stock (Balch et al. 2005), and ~50% of oceanic CaCO3 deposition (gattuso et al. 1998a). hence, carbon (C) flows in the coastal ocean are disproportionately high in comparison with its surface area (~7% of total oceanic surface area). Intense air–water carbon dioxide (CO2) exchanges can then be expected in the coastal ocean and could be significant for CO2 flux budgets at regional (Frankignoulle and Borges 2001; Borges et al. 2006) and global scales (Table 3.1).
The contemporary flux of CO2 between the coastal ocean and the atmosphere has been evaluated by several authors based on the global extrapolation of a flux value from a single shelf sea or from the compilation of literature data in several shelf seas (Table 3.1). The most recent evaluations converge towards a sink of atmospheric CO2 of about 0.3 PgC year–1. This CO
2 sink would be highly
signifi-cant, corresponding to 21% of the most recent estimate of contemporary sink of atmospheric CO2 in open oceans of 1.4 PgC year–1 (Takahashi et al. 2009).
Yet, these estimates based on literature compilations suffer from several caveats, one of the most important being the lack of data to adequately cover the full spatial extent of the coastal ocean and the diversity of biogeochemical C cycling related to extremely contrasted physical and biogeochemical settings. Indeed, the distribution of CO2 flux data in shelf seas reported in literature is biased towards the mid-latitudes of the Northern hemisphere. Data are lacking in large portions of the coastal ocean such as the Russian Arctic coast, the Eastern South America coast, the Eastern Africa coast, large sections of the western Africa coast and large sections of the Antarctic coast.
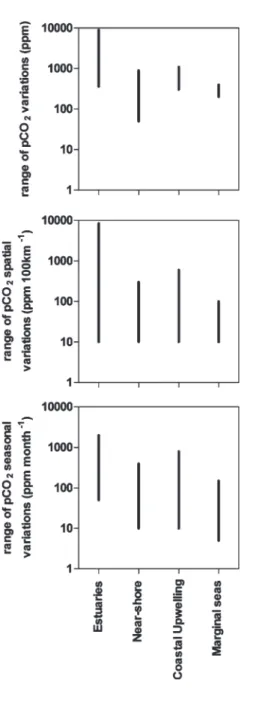
Further, due to the high dynamic range of seasonal and spatial variations of the partial pressure of CO2 (pCO2) in coastal environments (Fig. 3.1), reported air–sea CO2 fluxes can be biased by inadequate spatial or temporal coverage. For instance, in the Southern Bight of the North Sea where Thomas et al. (2004) reported a
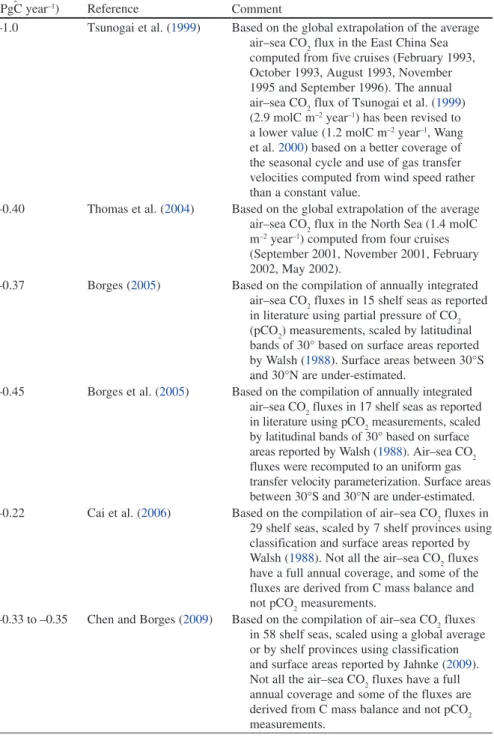
Table 3.1 Reported estimates of the sink for atmospheric CO2 in the coastal ocean (excluding near-shore environments)
CO2 sink
(PgC year–1) Reference Comment
–1.0 Tsunogai et al. (1999) Based on the global extrapolation of the average air–sea CO2 flux in the East China Sea computed from five cruises (February 1993, October 1993, August 1993, November 1995 and September 1996). The annual air–sea CO2 flux of Tsunogai et al. (1999) (2.9 molC m–2 year–1) has been revised to
a lower value (1.2 molC m–2 year–1, wang
et al. 2000) based on a better coverage of the seasonal cycle and use of gas transfer velocities computed from wind speed rather than a constant value.
–0.40 Thomas et al. (2004) Based on the global extrapolation of the average air–sea CO2 flux in the North Sea (1.4 molC m–2 year–1) computed from four cruises
(September 2001, November 2001, February 2002, May 2002).
–0.37 Borges (2005) Based on the compilation of annually integrated air–sea CO2 fluxes in 15 shelf seas as reported in literature using partial pressure of CO2 (pCO2) measurements, scaled by latitudinal bands of 30° based on surface areas reported by walsh (1988). Surface areas between 30°S and 30°N are under-estimated.
–0.45 Borges et al. (2005) Based on the compilation of annually integrated air–sea CO2 fluxes in 17 shelf seas as reported in literature using pCO2 measurements, scaled by latitudinal bands of 30° based on surface areas reported by walsh (1988). Air–sea CO2 fluxes were recomputed to an uniform gas transfer velocity parameterization. Surface areas between 30°S and 30°N are under-estimated. –0.22 Cai et al. (2006) Based on the compilation of air–sea CO2 fluxes in
29 shelf seas, scaled by 7 shelf provinces using classification and surface areas reported by walsh (1988). Not all the air–sea CO2 fluxes have a full annual coverage, and some of the fluxes are derived from C mass balance and not pCO2 measurements.
–0.33 to –0.35 Chen and Borges (2009) Based on the compilation of air–sea CO2 fluxes in 58 shelf seas, scaled using a global average or by shelf provinces using classification and surface areas reported by Jahnke (2009). Not all the air–sea CO2 fluxes have a full annual coverage and some of the fluxes are derived from C mass balance and not pCO2 measurements.
Fig . 3.1 Dynamic range of the partial pressure of CO 2 (pCO 2 ) variations across coastal ecosystems, of pCO 2 spatial gradients and of pCO 2 seasonal changes in estuaries (based on Frankignoulle et al. 199 8 ; Bouillon et al. 200 3 ), in near -shore ecosystems (based on Bor ges and Frankignoulle 2002 a ; Cai et al. 200 3 ), and coastal upwelling systems (based on Friedrich et al. 2002, 2 00 8 ; g oyet et al. 199 8 ; Bor ges and Frankignoulle 2002 b )
source of CO2 based on a data-set with a lower temporal coverage than the one of Schiettecatte et al. (2007) who reported a sink of atmospheric CO2. Another example is in the US South Atlantic Bight, where Cai et al. (2003) reported a source of CO2 based on a data-set with a lower spatial resolution than the one of Jiang et al. (2008a) who reported a sink of atmospheric CO2.
Inter-annual variations of air–sea CO2 fluxes in the coastal ocean can be signifi-cant although they have been seldom investigated due to the lack of adequate data-sets. In continental shelf seas, these inter-annual variations can be due to large scale climate oscillations such as the El Niño Southern Oscillation (ENSO) (Ianson and Allen 2002; Friederich et al. 2002) or such as the Southern Annular Mode (SAM) (Borges et al. 2008a). In the case of the California current, the change of ENSO phases can lead to a reversal of the direction of annual air–sea CO2 fluxes (Friederich et al. 2002). In near-shore ecosystems, inter-annual variations of air–sea CO2 fluxes can be due to variable river influence (Borges and Frankignoulle 1999; gypens et al. 2004; Borges et al. 2008b; Salisbury et al. 2009).
Contemporary air–sea CO2 fluxes deduced from field measurements of pCO2 are the combination of natural (pre-industrial) air–sea CO2 flux signal and a perturbation air–sea CO2 flux signal related to the anthropogenic increase of atmo-spheric CO2. The pre-industrial air–sea CO2 fluxes can be roughly evaluated by the mass balance of carbon inputs and outputs for the whole ocean (open and coastal) at global scale (e.g. Sarmiento and Sundquist 1992). In the open ocean, the inven-tory of anthropogenic dissolved inorganic carbon (DIC) can be evaluated by several back-calculation techniques (e.g. Vázquez-Rodríguez et al. 2009) that allow deriving a pre-formed DIC value that is removed from the observed DIC value, the difference corresponding to the anthropogenic DIC signal. The evalua-tion of a pre-formed DIC value relies on the analysis of chemical variables in water masses that are assumed to be devoid of anthropogenic DIC (deep waters). Due to the shallowness of the coastal ocean, it is impossible to evaluate pre-formed DIC values. Further, in the coastal ocean the anthropogenic air–sea CO2 flux signal is expected to be influenced by other perturbations besides the increase of atmospheric CO2, such as changes in nutrient inputs by atmospheric deposition or by rivers. The only attempts to evaluate the anthropogenic CO2 sink in the coastal ocean have been made with two modelling studies. Mackenzie et al. (2004) used a single box model of the coastal ocean and evaluated the sink of anthropo-genic CO2 to 0.17 PgC year–1. Bopp et al. (2008) used a high resolution ocean
model (0.5° × 0.5°) and evaluated the sink of anthropogenic CO2 in the coastal ocean to 0.13 PgC year–1. hence, the coastal ocean presently contributes between
6% and 11% of the sink of anthropogenic CO2 in the open ocean, ranging between 1.5 and 2.2 PgC year–1 (Sarmiento et al. 2000; gloor et al. 2003; Quay et al. 2003;
gurney et al. 2004; Sabine et al. 2004; Patra et al. 2005; gruber et al. 2009). The proximal coastal ocean (estuaries, bays, salt-marshes, mangroves, and other near-shore ecosystems) is directly influenced by terrestrial inputs of DIC, nutrients and organic carbon. At ecosystem level, the aquatic compartment of these environ-ments is net heterotrophic, consuming more organic carbon than the autochtonous gross primary production (gPP) (Odum and hoskin 1958; Odum and wilson 1962;
heip et al. 1995; Kemp et al. 1997; gattuso et al. 1998a; gazeau et al. 2004; hopkinson and Smith 2005). Accordingly, the aquatic compartment of these eco-systems is a source of CO2 to the atmosphere (Frankignoulle et al. 1998, Borges et al. 2003; Abril and Borges 2004; wang and Cai 2004). The contribution of CO2 inputs by rivers to the overall estuarine emission is generally low (Borges et al.
2006; Jiang et al. 2008b). The overall source of CO2 from near-shore ecosystems has been evaluated to ~0.50 PgC year–1, mainly related to the emission of CO
2 to
the atmosphere from estuaries (~0.36 PgC year–1) (e.g. Chen and Borges 2009).
These estimations also suffer from the same caveats as those for continental shelf seas. Data distribution is biased towards the temperate regions of the Northern hemisphere, and most estuaries where CO2 fluxes have been evaluated are macro-tidal estuaries, while data in other types of estuarine environments (fjords, fjards, lagoons, micro-tidal estuaries,…) are scarce. Further, the dynamic range of pCO2 variations in estuaries is very marked (Fig. 3.1) and issues of adequate spatial and temporal coverage are even more critical. Also, there is a large uncertainty related to value of estuarine surface area used to scale the CO2 flux data as discussed by Abril and Borges (2004) and Borges (2005). Yet, the estimate of the emission of CO2 from estuaries based on the scaled CO2 flux data is in reasonable agreement with the estimate based on the input of river CO2 and the degradation during estua-rine transit of particulate (POC) and dissolved organic carbon (DOC) as discussed by Abril and Borges (2004), Borges (2005) and Chen and Borges (2009).
3.2 Possible Evolution and Feedbacks Under Global Change
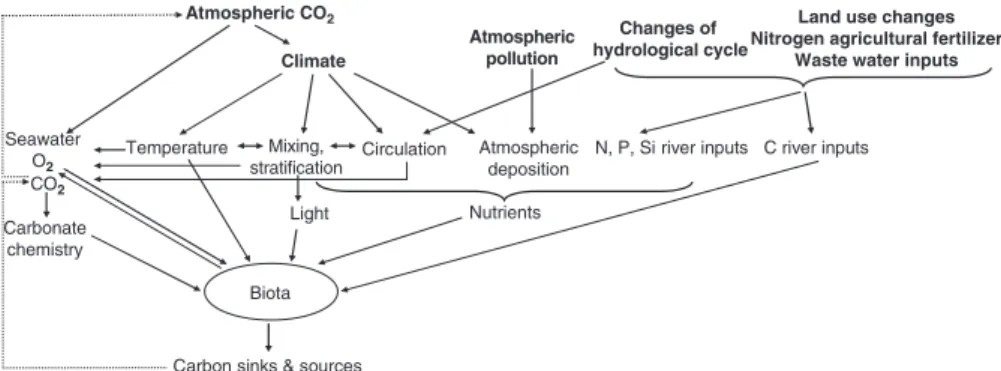
Figure 3.2 depicts a conceptual diagram of the different anthropogenic forcings on the coastal ocean that can modify the sources and sinks of carbon and ultimately provide a feedback on increasing atmospheric CO2. hereafter, the impact of these forcings and potential associated feedbacks will be discussed in relation to air–sea CO2 fluxes in the coastal ocean, when documented, and roughly quantified, when possible (Table 3.2).
Mixing, stratification Circulation Light Nutrients Climate Temperature Atmospheric deposition Atmospheric CO2
Carbon sinks & sources Seawater O2 CO2 Carbonate chemistry Biota N, P, Si river inputs Changes of hydrological cycle C river inputs Atmospheric pollution
Land use changes Nitrogen agricultural fertilizer
Waste water inputs
Fig. 3.2 Conceptual diagram of global change forcings on C cycling of the coastal ocean (bold), and feedbacks on increasing atmospheric CO2 (Adapated from Riebesell 2007)
Table 3.2 global change forcings on carbon cycling of the coastal ocean and associated feedback on increasing atmospheric CO2 by year 2100. Refer to text for details on evaluation of sign and quantification of feedbacks
global change forcings Feedback PgC year–1 Comment
Changes in coastal physics
Enhanced stratification – ? ? 1
Enhanced (?) coastal upwelling + ? ? 2 Impact of expanding OMZ in coastal
upwelling regions
+ ? 3
Enhancement of air–sea CO2 fluxes related to Arctic sea-ice retreat
– 0.002 4
Changes in land-used, waste water inputs, agricultural fertilizers and changes in hydrological cycle
Increase of river organic carbon delivery to the Arctic Ocean
+ ?
Increase of river nutrients delivery to the Arctic Ocean
– ?
global increase in river nutrient and organic matter delivery
– 0.200 5
global increase in nutrient atmospheric deposition
– ? 6
Expanding hypoxic and anoxic zones + ? 3 Changes in seawater carbonate chemistry (ocean acidification)
Decrease of benthic calcification
Coral reefs – 0.015–0.026
Other benthic environments
– 0.025–0.046 Decrease of pelagic calcification
Coccolithophorids – 0.013–0.019
Other pelagic calcifiers – ? Dissolution of metastable CaCO3 in
sediment porewaters – 0.022 7
Enhancement of primary production and export production due increasing [CO2]
– 0.108–0.216 8
1. Negative feedback only reported in Tasman shelf assuming pCO2 behaviour during warm years is representative of response to global warming, if extrapolated globally would produce a negative feed-back of the order of ~0.1 PgC year–1.
2. Assuming exact opposite response of model output with decreasing upwelling favourable winds.
3. Assuming enhanced denitrification leading to decreased primary production. 4. Feedback computed for the next decade and not until 2100.
5. The enhancement of primary production by nutrient inputs balances the additional CO2 pro-duction by organic matter inputs.
6. Not taking into account enhancement of acidification of surface waters by sulphur atmospheric deposition.
7. Based on Andersson et al. (2003).
8. Based on a single mesocosm experiment with mixed diatom and coccolithophorid assemblage.
Several changes in coastal ocean physics are expected with global warming that can change C cycling and air–sea CO2 fluxes, such as increasing stratification, enhanced coastal upwelling, expanding oxygen minimum zones, retreat of sea-ice and changes in freshwater delivery (Section 3.2.1).
Changes in land use, waste water inputs, agricultural fertilizers, hydrological cycle and atmospheric deposition increase the delivery of inorganic and organic carbon, and nutrients to the coastal ocean, and modify C flows (enhanced primary production and hypoxia/anoxia) and air–sea CO2 fluxes in the coastal ocean with potential feedbacks on increasing atmospheric CO2 (Section 3.2.2).
Changes in seawater carbonate chemistry in response to increasing atmospheric CO2 content can change the rates and fates of primary production and calcification at organism and ecosystem community levels, modifying C flows and air–sea CO2 fluxes in the coastal ocean with potential feedbacks on increasing atmospheric CO2 (Section 3.2.3).
Finally, anthropogenic impacts on specific near-shore coastal ecosystems (coral reefs, seagrass meadows and mangroves) can alter C flows in these ecosystems (Section 3.2.4).
3.2.1 Changes in Coastal Ocean Physics
It has been hypothesized (Bakun 1990) and modelled (Snyder et al. 2003; Diffenbaugh et al. 2004) that the intensity and duration of coastal upwelling will increase in future due to climate change. Increasing land–sea thermal contrasts will increase alongshore winds driving Ekman upwelling. Locally, other factors such as decadal fluctuations in surface heat fluxes can modulate the response to increasing upwelling favorable winds and lead to increased stratification and surface ocean warming, as evidenced in the California Current in relation to the Pacific Decadal Oscillation (Di Lorenzo et al.
2005; Field et al. 2006). Yet, there is observational evidence in several coastal upwelling systems that suggest a general increasing trend in upwelling with global warming (Anderson et al. 2002; Mendelssohn and Schwing 2002; goes et al. 2005; Santos et al. 2005; Mcgregor et al. 2007).
The response of air–sea CO2 fluxes to increased upwelling is difficult to predict and can go both ways. Stronger vertical inputs of DIC would drive the system to emit more CO2 to the atmosphere, while enhanced nutrient inputs would drive higher primary production, export production and a sink for atmospheric CO2. Plattner et al. (2004) modelled the impact of decreasing upwelling favorable winds on C flows in the California Current system. Model results show that a 50% reduc-tion of wind stress induces a ~50% decrease in net primary producreduc-tion and in export production; yet, the source of CO2 to the atmosphere also decreases by about ~50% due to the decrease of vertical inputs of DIC and the decrease of the gas transfer velocity, providing a negative feedback on increasing atmospheric CO2. however, the increase of upwelling favorable winds does not necessarily imply that the
ecosystem will respond by an increase of primary production. Increased upwelling winds can also lead to a reduction of light exposure due to deeper mixed layers and to an increase offshore advection of phytoplankton (Largier et al. 2006). Nevertheless, a time series in Monterey Bay (California) shows since 1993 an increasing trend in pCO2 that is faster than the one expected from the equilibration with increasing atmospheric CO2, in parallel with a decreasing trend in sea surface temperature (SST) and an increasing trend in chlorophyll-a (Francisco Chavez and gernot Friederich, 2009, personal communication). This would suggest an increasing trend in upwelling and primary production with an increase in pCO2 values, leading to an overall positive feedback on increasing atmospheric CO2.
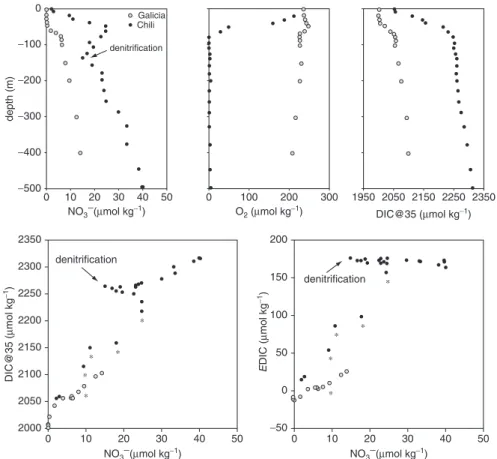
Climate change is expected to lead to a decrease of oxygen (O2) content in the oceans due to the slowing down of the thermohaline circulation and decreasing solu-bility of O2 (due to surface warming) of the source waters of intermediate and deep layers (Bopp et al. 2002; Matear and hirst 2003). This will lead to the expansion of oxygen minimum zones (OMZ) as confirmed by historical observations (Bograd et al. 2008; Stramma et al. 2008). OMZ are associated to major coastal upwelling regions such as the humbolt current, the Benguela current, the Canary current and the Arabian Sea. The upwelling source waters in coastal upwelling areas associated to OMZ are sources of CO2 to the atmosphere because denitrification leads to lower concentrations of nitrate and excess of DIC relative to nitrogen (Fig. 3.3). hence, coastal upwelling areas associated to OMZ are sources of atmospheric CO2 such as the Arabian Sea (goyet et al. 1998) and the Peruvian and Chilean coasts (Friederich et al. 2008; Paulmier et al. 2008). Coastal upwelling areas devoid of OMZ such as the Iberian coastal upwelling system (Borges and Frankignoulle 2002a) or with deep OMZ such as the Oregon coast (hales et al. 2005) are sinks for atmospheric CO2. The future horizontal and vertical expansion of OMZ is then expected to provide a positive feedback on increasing atmospheric CO2 due to enhanced CO2 emissions from coastal upwelling systems.
Sarmiento et al. (1998) showed that future increase in stratification reduces the thermohaline circulation and open oceanic uptake of anthropogenic CO2. Yet, the ocean will also respond to increased stratification by changes in export production (Sarmiento et al. 1998; Bopp et al. 2001; Le Quéré et al. 2002, 2003) and in the vertical input of DIC, which potentially can provide feedbacks on increasing atmo-spheric CO2. The comparison of negative and positive SST anomaly phases of the large scale climatic oscillations (ENSO, SAM,…) can be used as a natural labora-tory to determine how marine biogeochemistry could respond to future increase in SST and stratification in the oceans (Le Quéré et al. 2002, 2003). however, time-series of pCO2 with the adequate temporal resolution and duration to work out seasonal and inter-annual variations are extremely scarce in continental shelf seas. Borges et al. (2008a) constructed a time-series of pCO2 and air–sea CO2 fluxes in the Tasman continental shelf based on the analysis of anomalies of pCO2 and SST from a data-set of 22 cruises spanning from 1991 to 2003. Over the Tasman conti-nental shelf, during positive phases of SAM, there is a decrease of wind speed that leads to increasing SST and stratification (Fig. 3.4). The increase of stratification leads to a decrease of vertical inputs of DIC and overall decrease in pCO2 and
increase in the sink for atmospheric CO2 (Fig. 3.4). hirst (1999) modelled an increase of SST at the latitude of the Tasman continental shelf of about 2°C by 2100. If we assume that the response of air–sea CO2 fluxes to inter-annual positive anomalies of SST are representative of the response of air–sea CO2 fluxes under global warming, this would lead to an enhancement of the sink of atmospheric CO2
−100 −200 −300 −400 −500 0 2350 2300 2250 2200 2150 2100 2050 2000 10 20 denitrification denitrification denitrification Galicia Chili 30 40 50 0 10 20 30 40 50 0 10 20 30 40 50 0 100 200 200 150 100 50 0 −50 300 1950 2050 2150 2250 2350 0 depth (m) DIC@35 (µ mol kg −1) DIC@35 (µmol kg−1) E DIC (µ mol kg −1) NO3−(µmol kg−1) NO3−(µmol kg−1) NO3−(µmol kg−1) O2 (µmol kg−1)
Fig. 3.3 Vertical profiles in the top 500 m of nitrate (NO3–), dissolved oxygen (O
2), dissolved
inorganic carbon normalized to a salinity of 35 (DIC@35), DIC@35 vs NO3–, excess DIC (EDIC)
vs NO3– at the continental shelf break of the galician (–9.54°E 42.15°N) and Chilean (–77.59°E
–12.45°N) upwelling systems. Chilean data were extracted from the global Ocean Data Analysis Project (Key et al. 2004), galician data are from the OMEX-II project (Borges and Frankignoulle
2002a). EDIC was computed as the difference between observed DIC and DIC computed from
total alkalinity and atmospheric CO2, and provides an estimate of CO2 outgassing if the water mass is upwelled. Asterisks indicate the depths from which water can be upwelled (10–50 m in the Chilean upwelling system based on Paulmier et al. (2008) and 200 m in the galician upwelling system based on Borges and Frankignoulle (2002a)). For a given NO3– value (indicative of
poten-tial primary production), DIC@35 and EDIC (indicative of potenpoten-tial CO2 outgassing) are higher in the Chilean upwelling system than in the galician upwelling, probably in relation to denitrifica-tion associated to the marked oxygen minimum zone in the Chilean upwelling system. This could explain that the Chilean upwelling system behaves as a source of CO2 (Friederich et al. 2008) and the galician upwelling system as a sink of CO2 (Borges and Frankignoulle 2002a)
Fig. 3.4 Time-series from 1982 to 2005 of Southern Annular Mode (SAM) index and of deseason-alized sea surface temperature (SST), partial pressure of CO2 (pCO2) and air–sea CO2 fluxes (F) in the Tasman continental shelf (adapted from Borges et al. 2008a). grey areas correspond to periods of sustained negative SST anomalies
in the Tasman continental shelf of about 36%. Assuming all continental shelves respond similarly this would lead to a major feedback on increasing atmospheric CO2 from a present day sink of 0.3–0.4 PgC year–1 by 2100. however, it is
extremely unlikely that all continental shelves will respond by an increase in the sink of atmospheric CO2 with increasing stratification. More data acquisition and analysis are required to characterize the possible responses of air–sea CO2 fluxes to changes in stratification in continental shelf seas.
Climate changes will probably strongly affect C cycling and air–sea CO2 fluxes in the Arctic Ocean that at present time has been evaluated as a sink for atmo-spheric CO2 (Pipko et al. 2002; Murata and Takizawa 2003; Bates 2006; Bates et al. 2005; 2006; Else et al. 2008; Murata et al. 2008). Bates et al. (2006) found a positive relationship between air–sea CO2 fluxes and the ice–sea cover in the Chukchi Sea. Assuming that this relationship could be used to predict the evolu-tion of air–sea CO2 fluxes with the future predicted sea-ice retreat, these authors estimated that the sink of atmospheric CO2 in the Arctic Ocean would increase in the coming decade by 0.002 PgC year–1 compounded each year. however, it is also
expected that future changes in temperature will modulate air–sea CO2 fluxes directly through the thermodynamic change of pCO2. Future changes in tempera-ture will indirectly modulate air–sea CO2 fluxes through changes in circulation (combined with salinity changes due to sea-ice retreat and changes in fresh-water delivery) that will affect DIC transport (horizontally and vertically) and will also affect biological activity and C flows.
3.2.2 Changes in Land Use, Waste Water Inputs, Agricultural
Fertilizers, Hydrological Cycle and Atmospheric Deposition
A major change in C flows and air–sea CO2 fluxes can be expected from the mobi-lization of terrestrial matter and transport by rivers to the Arctic Ocean. The Arctic Ocean receives almost 10% of global river discharge and about 0.025 PgC year–1 of
terrestrial DOC (Opshal et al. 1999). Arctic river basins may store up to ~50% of the global soil organic carbon (Macdonald et al. 2006), with permafrost soils storing about 400 PgC (Davidson and Janssens 2006). An increase of fresh water discharge to the Arctic during the last 60 years has been reported (Peterson et al. 2002) and could continue to increase in future (McClelland et al. 2004). This could enhance organic carbon delivery by rivers to the Arctic Ocean that could be further increased by mobilization of soil organic carbon with permafrost thawing (Frey and Smith
2005). The DOC delivered during ice-out is mostly young (Benner et al. 2004; Raymond et al. 2007) and labile (holmes et al. 2008). hence, the degradation of the additional organic carbon delivered by rivers to the Arctic Ocean with climate changes would provide a positive feedback on increasing atmospheric CO2 that could be significant but yet unquantified (Frey and McClelland 2009). On the other hand, the river delivery of dissolved inorganic nutrients (McClelland et al. 2007) and possibly dissolved organic nutrients (Frey and McClelland 2009) to the Arctic
Ocean could also increase with climate change. This could stimulate primary production and provide a negative feedback on increasing atmospheric CO2 that could also be significant and is yet unquantified.
Changes in land use and waste water inputs have increased river nutrient con-tents (green et al. 2004; Seitzinger et al. 2005) and are expected to continue to increase in future (Seitzinger et al. 2002; galloway et al. 2004). The delivery of nutrients to the coastal ocean will also be modified by predicted future increasing global freshwater flow due to changes in the hydrological cycle (Douville et al.
2002; Labat et al. 2004; Milly et al. 2005; Aerts et al. 2006; huntington 2006). however, future changes in freshwater flow will show regional differences, in gen-eral with an increase at high-latitudes and tropical latitudes and a decrease at mid-latitudes (Milly et al. 2005). The freshwater delivery to the coastal ocean will be further modulated by damming and other water diversion activities (Vörösmarty and Sahagian 2000; Vörösmarty et al. 2003).
It is established that nutrient delivery by rivers to the coastal ocean has increased during the past century and is expected to continue to increase in the future. This could lead to an enhancement of primary production and a negative feedback on increasing atmospheric CO2. On the other hand, increased organic matter river loadings are expected to fuel heterotrophic activity in the coastal ocean and provide a positive feedback on increasing atmospheric CO2. Yet, the balance between these two processes seems to be a negative feedback on increasing atmospheric CO2 due to the enhancement of net ecosystem production (NEP). Based on a simple one-box model of the coastal ocean, Mackenzie et al. (2004) have evaluated the negative feedback on increasing atmospheric CO2 by 2100 at ~0.20 PgC year–1. Moreover, it has been recently reported that the impact of
anthropogenic nitrogen atmospheric deposition on primary production has been under-estimated (Duce et al. 2008), hence the future increase in NEP and related negative feedback on increasing atmospheric CO2 could be stronger. Based on a coupled general circulation model, da Cunha et al. (2007) have shown that variable river inputs of nutrients have little impact on C cycling in the open ocean, hence, this impact seems to be confined to the coastal ocean. gypens et al. (2009) have shown, based on a regional model, that nutrient reduction policies can lead to a strong decrease of primary production and NEP and a positive feedback increasing atmospheric CO2. however, at a global scale, the anthropogenic delivery of nutri-ents to the coastal zone and concomitant enhancement of NEP and sink of atmo-spheric CO2 is expected to continue to increase. The environmental policies actually implemented in watersheds of developed countries are not expected to be implemented for decades in emergent countries.
Changes in land use on watersheds and in freshwater flow can also alter the delivery of bicarbonate (and total alkalinity (TA)) from rivers to the coastal ocean (Cai 2003; Raymond and Cole 2003; Raymond et al. 2008; Cai et al. 2008; gislason et al. 2009). This in itself constitutes a sink for atmospheric CO2 on the watershed if related to enhanced CaCO3 weathering. however, it is unclear how this could affect the coastal ocean CO2 sink, although an increase of the seawater buffering capacity can be expected. This will also be probably modulated by the changes in
DIC:TA ratio in river water (Cai et al. 2008). Also, it has been suggested that TA generation in near-shore environments (Cai and wang 1998) could contribute to enhance the seawater buffering capacity and enhance the sink for atmospheric CO2 in the coastal ocean (Fennel et al. 2008; Thomas et al. 2009).
An important consequence of eutrophication is the development of hypoxic or anoxic regions in coastal ecosystems (Diaz and Rosenberg 2008). In semi-enclosed seas permanently stratified, hypoxia is a perennial feature (Baltic Sea and Black Sea), while in seasonally stratified systems hypoxia is a seasonal feature, occurring usually in summer when temperature (and stratification) and organic matter availability are highest (gulf of Mexico and East China Sea). In permanently well-mixed continental shelf seas, even highly eutrophicated such as the Southern Bight of the North Sea, hypoxia does not occur. however, in well-mixed (macro-tidal) estuaries, low oxygen levels and even hypoxia can occur mainly in maximum turbidity zones (e.g. herman and heip 1999), such as in the Scheldt estuary in the 1970s when eutrophication was highest (e.g. Soetaert et al. 2006). In estuaries, hypoxia can occur seasonally but also at daily time-scales (during the night) (Tyler et al. 2009). hypoxia and anoxia have important consequences on benthic biomass and biodiversity with potential impacts on fisheries (Diaz and Rosenberg 2008). The impact on air–sea CO2 fluxes is difficult to evaluate, yet, by analogy with OMZ (Section 3.2.2) it is expected that the enhancement of denitrification at low oxygen levels will lead to a net CO2 production due to removal of nitrate and production of CO2. Denitrification will also increase TA and increase the buffering capacity of sea-water and decrease the seasea-water pCO2 (Fennel et al. 2008; Thomas et al. 2009). This can lead to a negative feedback on increasing atmospheric CO2. Yet, the model of Fennel et al. (2008) in the northwest North Atlantic continental shelf shows that the contribution of TA generation by benthic denitrification to the enhancement of the CO2 sink (0.07 mmolC m–2 year–1) is one order of magnitude
lower than the decrease of the CO2 sink due to lower primary production related to the removal of nitrate (0.17 mmolC m–2 year–1). hence, the expansion of
hypoxic or anoxic zones in coastal environments that has been observed since the 1960s (Diaz and Rosenberg 2008) and could increase in future with sus-tained eutrophication, can be expected to lead to a positive feedback on increas-ing atmospheric CO2 due to denitrification.
3.2.3 Changes in Seawater Carbonate Chemistry
Ocean acidification of surface waters corresponds to the increase of [CO2] and of [h+], the decrease of ph, of [CO
32–], and of the saturation state (W) of calcite (Wca)
and aragonite (War), all related to shifts in thermodynamic equilibria in response to the input of anthropogenic CO2 from the atmosphere. The CaCO3 production of benthic and planktonic calcifiers is expected to decrease with decreasing W due to ocean acidification (refer to reviews by Raven et al. (2005), Kleypas et al. (2006),
Fabry et al. (2008), Doney et al. (2009)). This is expected to provide a negative feedback on increasing atmospheric CO2 since calcification leads to a shift from the bicarbonate to the CO2 pool according to
Ca2++2 hCO
3–→ CaCO3+CO2+h2O
Furthermore, ocean acidification is expected to lead to an enhancement of shallow-water CaCO3 dissolution in the porewaters within sediments (Andersson et al.
2003), also providing a negative feedback on increasing atmospheric CO2.
On the other hand, primary production of some pelagic (e.g. Riebesell et al.
1993; Qiu and gao 2002) and benthic (e.g. gao et al. 1993; Zimmerman et al.
1997) non-calcifying autotrophs could increase with [CO2]. An increase in primary production associated to efficient organic carbon export would induce a negative feedback on increasing atmospheric CO2, according to
CO2 + h2O →Ch2O + O2
Besides changes in primary production and calcification, marine organisms and communities can also respond to ocean acidification through changes in N2 fixation (e.g. hutchins et al. 2007), shift in natural assemblages (e.g. Boyd and Doney 2002; Tortell et al. 2002; Engel et al. 2008) and an increase of export of organic matter to depth due to enhanced aggregation (e.g. Engel et al. 2004; Delille et al. 2005; Riebesell et al. 2007). All these processes could also provide a negative feedback on increasing atmospheric CO2.
Since the coastal ocean hosts a disproportionately more important biological activity than the open ocean, the potential feedbacks on increasing atmospheric CO2 related to the response of marine organisms and communities to the acidifica-tion of surface waters are expected to be disproporacidifica-tionately much more important in the coastal ocean than in the open ocean. Further, in coastal environments the acidification of surface waters could be enhanced compared to the open ocean due to anthropogenic atmospheric nitrogen and sulfur deposition (Doney et al. 2007), influence of river discharge (gledhill et al. 2008; Salisbury et al. 2008) or related to upwelling of DIC rich waters (Feely et al. 2008).
During high-runoff, near-shore coastal environments influenced by estuaries can be exposed seasonally to low W values. Salisbury et al. (2008) showed that during high-runoff the plume of Kennebec river (gulf of Maine) shows very low W values down to 0.4 associated to salinities down to 8. however, most rivers show W values above 1 for salinities above 10 (Salisbury et al. 2008), hence, river plumes under-saturated in CaCO3 are not the common feature. Yet, in Arctic rivers W values are lower (W > 1 for salinities > 25). hence, the increase of Arctic river runoff under global warming (Section 3.2.2) could lead to an extension of river plumes with low W values in the Arctic Ocean. however, river plumes are also typically eutrophicated, leading to an increase in primary production with an effect on carbonate chemistry (gypens et al.
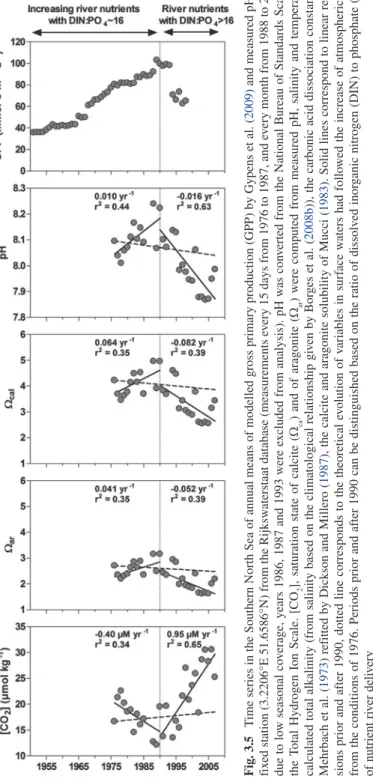
2009; Borges and gypens 2010). Figure 3.5 shows the decadal changes of carbonate chemistry in the Southern North Sea. From the 1950s to the mid 1980s when gPP
Fig . 3.5 T ime series in the Southern North Sea of annual means of modelled gross primary production (g PP) by g ypens et al. ( 2009 ) and measured ph at a fix ed station (3.2206°E 51.6586°N) from the Rijksw aterstaat database (measurements ev ery 15 days from 1976 to 1987, and ev ery month from 1988 to 2007; due to lo w seasonal co verage, years 1986, 1987 and 1993 were excluded from analysis). ph w as con verted from the National Bureau of Standards Scale to the Total h ydrogen Ion Scale. [CO 2 ], saturation state of calcite (W ca ) and of aragonite (W ar ) were computed from measured ph , salinity and temperature, calculated total alkalinity (from salinity based on the climatological relationship gi ven by Bor ges et al. ( 2008b )), the carbonic acid dissociation constants of Mehrbach et al. ( 1973 ) ref itted by Dickson and Millero ( 1987 ), the calcite and aragonite solubility of Mucci ( 1983 ). Solid lines correspond to linear re gres-sions prior and after 1990, dotted line corresponds to the theoretical ev olution of variables in surf ace w aters had follo wed the increase of atmospheric CO 2 from the conditions of 1976. Periods prior and after 1990 can be distinguished based on the ratio of dissolv ed inor ganic nitrogen (DIN) to phosphate (PO 4 ) of nutrient ri ver deli very
increased due to eutrophication, there is an increasing trend in ph, in Wca and in War and a decreasing trend in [CO2], while the equilibration of surface waters with increasing atmospheric CO2 would have lead to the opposite trends. After the mid 1980s when phosphorus removal policies were implemented, primary production in the Southern Bight of the North Sea became increasingly limited by phosphorus avail-ability, gPP decreased and the ecosystem shifted from net autotrophy to net heterotro-phy (gypens et al. 2009). The decrease of ph, Wca and War and the increase of [CO2] were actually faster then those expected from the equilibration of surface waters with increasing atmospheric CO2 (Fig. 3.5). hence, the effect of eutrophication on carbon cycling that counter-acts the effect of ocean acidification could maintain carbonate chemistry conditions that remain favorable for benthic and pelagic calcification in near-shore coastal environments. Also, the application of nutrient delivery regulation policies can lead to transient changes of carbonate chemistry that are faster than those related solely to ocean acidification. Such regulation policies have been mainly imple-mented in industrialized countries, while in emerging economy countries, eutrophication can be supposed to continue to increase unregulated in coming decades.
The response of calcifiers to ocean acidification has been to some extent relatively well documented. Based on the upper bound value global calcification rate from coral reefs of 0.11 PgC year–1 (Milliman and Droxler 1996) and assuming a decrease by
2100 of calcification ranging from 22% (gattuso et al. 1998b) to 40% (Andersson et al. 2005), and using a molar ratio of CO2 production to calcification (Y) of 0.6 (Frankigoulle et al. 1994), the negative feedback on increasing atmospheric can be roughly evaluated to range between 0.015 and 0.026 PgC year–1. Benthic calcification
in other coastal environments than coral reefs has been evaluated to 0.19 PgC year–1
(Milliman and Droxler 1996), and assuming a similar range of decrease of calcifica-tion (22–40%) by 2100, the negative feedback on increasing atmospheric can be roughly evaluated to range between 0.025 and 0.046 PgC year–1 (using a Y of 0.6).
Balch et al. (2007) recently estimated global pelagic calcification to 1.6 ± 0.3 Pg C year–1, based on remote sensing data. This implies that coccolithophorids would be
the single most important pelagic calcifier in the oceans, as other estimates of global pelagic calcification range between 0.7 PgC year–1 based on historical accumulation
rates and sediment trap data (Milliman et al. 1999) and 1.4 PgC year–1, based on
seasonal cycle of TA in the euphotic zone (Lee 2001). A global estimate of pelagic calcification is unavailable for the coastal ocean, but on first approximation, it can be evaluated to 0.38 ± 0.1 Pg C year–1 scaled based on a fraction of the total CaCO
3
standing stock in the coastal ocean of 23% compared to the open ocean, based on remote sensing data (Balch et al. 2005). The decrease of global pelagic calcification for a doubling of atmospheric CO2 has been evaluated to 7% using a general circula-tion ocean model (gehlen et al. 2007). If we assume that this decrease also occurs in the coastal ocean, the negative feedback on increasing atmospheric CO2 can be roughly evaluated to range between 0.013 and 0.019 PgC year–1 (using a Y of 0.6).
The carboxylating enzyme Ribulose-1,5 bisphosphate-carboxylase/oxygenase (RUBISCO) relies exclusively on CO2 as substrate and has a half saturation constant ranging between 20 and 70 µmol kg–1 (Badger et al. 1998). This can cause
atmospheric equilibrium is typically ~10 µmol kg–1. This can be a significant issue
in near-shore environments where very low [CO2] values can occur during the peak of the phytoplankton bloom. For instance, in Belgian coastal waters, at the peak of the Phaeocystis bloom extreme values of pCO2 (72 ppm), ph (8.673 in the total hydrogen ion scale (ThIS)) and [CO2] (3 µmol kg–1) were reported in May 1999
(Borges and Frankignoulle 2002b). however, in continental shelf seas with lesser influence from nutrient rich estuarine waters, values of the variables of carbonate system during phytoplankton blooms are not as extreme (Table 3.3).
Phytoplankton species have developed several carbon concentration mecha-nisms (CCMs) to overcome the potential CO2 limitation of primary production (Raven 1991), leading to a specific sensitivity to CO2 availability. hence, photosyn-thesis by diatoms and the prymnesiophyte Phaeocystis (Burkhardt et al. 1999, 2001; Rost et al. 2003) is at or close to CO2 saturation at typical actual marine CO2 levels. On the other hand, photosynthesis of coccolithophorids is well below CO2 saturation at typical actual marine CO2 levels (Rost et al. 2003). however, these findings are mainly based on laboratory cultures with optimal light and nutrient conditions. In the real ocean, at the peak of phytoplankton bloom, nutrients are exhausted, and since CCMs rely in one way or another on enzymes, low nitrogen availability can lead to a down-regulation of CCMs. Since CO2 levels are also low at the peak of the phytoplankton bloom, increasing levels of seawater CO2 with global change could reduce the limitation of photosynthesis by CO2 availability. In nutrient exhausted conditions, if light conditions remain favorable, phytoplankton continues to photosynthesize, and extracellular release of organic carbon allows regulation of the internal C:N:P ratios. This can lead to the formation of transparent
Table 3.3 Minimum values of the partial pressure of CO2 (pCO2), ph, [CO2] reported in various continental shelf seas
pCO2 (ppm) ph(ThIS) [CO2] (µmol kg–1) Comment
gotland Sea (Baltic) 160 8.413 6.2 1
Northern North Sea 225 8.261 10.9 2
Southern North Sea 125 8.459 5.7 2
English Channel 320 8.127 13.5 3
Celtic Sea 295 8.160 11.6 4
Bay of Angels (Mediterranean)
330 8.144 12.5 5
East China Sea 280 8.173 12.3 6
Chukchi Sea 70 8.647 4.7 7
US Middle Atlantic Bight 200 8.285 6.1 8 1. Based on Schneider et al. (2003) and Kuss et al. (2004)
2. Based on Omar et al. (2010)
3. Based on Borges and Frankignoulle (2003) 4. Based on Borges et al. (2006)
5. Based on Copin-Montégut et al. (2004) 6. Based on wang et al. (2000)
7. Based on Bates (2006)
exopolymer particles that have strong aggregative properties and can enhance organic carbon export from surface to depth (Engel et al. 2004). hence, increasing CO2 levels with global change could lead to enhanced carbon export related to extracellular release of organic carbon in peak phytoplankton bloom conditions. Riebesell et al. (2007) have estimated that an increase of 27% of C export from mixed diatom and coccolithophorid assemblages would occur at an atmospheric pCO2 of 750 ppm. Based on the present day estimates of export production from the coastal ocean ranging from 0.4 (wollast 1998) to 0.8 PgC year–1 (Chen 2004),
the potential negative feedback on increasing atmospheric CO2 would range from 0.108 to 0.216 PgC year–1.
Ocean acidification can also lead to changes in phytoplankton composition (Boyd and Doney 2002; Tortell et al. 2002), with potential impacts on C cycling and export, and ultimately on air–sea CO2 fluxes. Further, the impact of ocean acidification will be modulated by the combined effect of other climate change impacts such as temperature increase and increased stratification. Temperature increase will directly impact metabolic rates of biota, while increased stratification will modulate vertical inputs of DIC and nutrients, and light conditions. The com-bined impact of temperature increase and acidification seems to lead to non-linear responses from phytoplankton (Feng et al. 2008). Temperature increase could also potentially modulate the response of coral reefs to ocean acidification (McNeil et al. 2004), although this has been strongly debated (Kleypas et al. 2005). Finally, increased stratification will favour phytoplankton communities that have a strong requirement for light availability and low inorganic nutrient requirements. Tyrrell and Merico (2004) reviewed the factors that favor the blooming of cocco-lithophorids and concluded that stratified and shallow mixed layers (inducing high light availability conditions) were one of the requisites for coccolithophorid blooming. Temperature increase and stratification could explain the appearance of not previously documented coccolithophorid blooms in some high latitude areas such as the Bering Sea (Merico et al. 2003) and the Barrents Sea (Smyth et al.
2004), the possible shift in the North Atlantic of phytoplankton communities towards coccolithophorids at the expense of diatoms based on the opal:CaCO3 ratio of sedimenting particles (Antia et al. 2001), and the trend since the 1950s towards increasing pelagic calcification based on mass of CaCO3 per coccolith from sediment cores (Iglesias-Rodriguez et al. 2008), in agreement with a global increase in stratification with strong impacts on marine productivity (Behrenfeld et al. 2006).
3.2.4 Anthropogenic Impacts on Specific Near-Shore
Coastal Ecosystems
Specific near-shore coastal ecosystems are in most cases threatened by direct and indirect human impacts. For instance, losses in seagrass (Short and Neckles 1999;
Duarte 2002) and coral reef ecosystems (hughes et al. 2003) are observed and predicted to continue due to mechanical damage (dredging and anchoring), eutro-phication and siltation, the latter two leading in particular to light limitation. Negative indirect human impacts on seagrass and coral ecosystems include increases of erosion by the rise of sea level, frequency and intensity of extreme weather events, ultraviolet irradiance and water temperature. Other coastal ecosys-tems such as mangrove forests or salt-marshes are relatively resilient to the present and future alteration of hydrology, pollution or global warming, but in some parts of the world they are being cleared for urban development and aquaculture (Alongi
2002). Furthermore, some coastal habitats are predicted to adapt and survive with shifts in species composition, as coral reef ecosystems (hughes et al. 2003; Baker et al. 2004) but with probable loss of biodiversity and modifications of carbon flows. It is unclear how these changes will affect carbon flows and ultimately air-sea CO2 fluxes.
3.3 Conclusions
The present day contemporary CO2 fluxes in shelf seas could be significant for the global carbon cycle, since available estimates converge to a value of 0.3 PgC year–1 (Table 3.1) corresponding to 21% of the most recent estimate of
contemporary sink of atmospheric CO2 in open oceans of 1.4 PgC year–1.
however, these estimates are prone to large uncertainty, mainly due to inade-quate representation of the spatial variability, and need to be improved based on more data, requiring a concerted global observational effort (Borges et al.
2009).
The potential feedbacks on increasing atmospheric CO2 from changes in carbon flows in the coastal ocean could be disproportionately higher than in the open ocean. Yet, these potential feedbacks remain largely unquantified (Table 3.2) due to a poor understanding of the mechanisms, or lack of modelling to quantify them. Based on reported evaluations and back of the envelope calculations, it is sug-gested that changes of biological activity due to the increased nutrient delivery by rivers would provide by 2100 a negative feedback on increasing atmospheric CO2 of the order of magnitude of the present day sink for atmospheric CO2. This nega-tive feedback on increasing atmospheric CO2 would be one order of magnitude higher than negative feedback due to the decrease of either pelagic or benthic calcification related to ocean acidification, and than the negative feedback related to dissolution of CaCO3 in sediments (Table 3.2). The increase of export produc-tion could also provide a significant feedback to increasing atmospheric CO2, although based on the conclusions from a single perturbation experiment. Feedbacks on increasing atmospheric CO2 due to effects of C cycling in continental shelf seas related to changes in circulation or stratification could be important but remain to be quantified.
Acknowledgments I’m grateful to Frédéric gazeau for pointing out the availability of long ph time series in the Southern North Sea, to Nathalie gypens for providing the gPP model outputs, and to Pedro Duarte for comments during manuscript elaboration. This is a contribu-tion to Belgian Federal Science Policy Office PEACE project (SD/CS/03), EU IP CARBOOCEAN (511176), EU CSA COCOS (212196). The author is a research associate at the F.R.S.-F.N.R.S.
References
Abril g, Borges AV (2004) Carbon dioxide and methane emissions from estuaries. In: Tremblay A, Varfalvy L, Roehm C, garneau M (eds) greenhouse gases emissions from natural environ-ments and hydroelectric reservoirs: Fluxes and processes. Springer, Berlin/heidelberg, germany/ New York, pp 187–207
Aerts JCJh, Renssen h, ward PJ, de Moel h, Odada E, Bouwer LM, goosse h (2006) Sensitivity of global river discharges under holocene and future climate conditions. geophys Res Lett 33:LI9401. doi:10.1029/2006gL027493
Alongi DM (2002) Present state and future of the world’s mangrove forests. Environ Conserv 29(3):331–349
Anderson DM, Overpeck JT, gupta AK (2002) Increase in the Asian southwest monsoon during the past four centuries. Science 297:596–599
Andersson AJ, Mackenzie FT, Ver LM (2003) Solution of shallow-water carbonates: An insignifi-cant buffer against rising atmospheric CO2. geology 31:513–516
Andersson AJ, Mackenzie FT, Lerman A (2005) Coastal ocean and carbonate systems in the high CO2 world of the Anthropocene. Am J Sc 305:875–918
Antia AN, Koeve w, Fischer g, Blanz T, Schulz-Bull D, Scholten J, Neuer S, Kremling K, Kuss J, Peinert R, hebbeln D, Bathmann U, Conte M, Fehner U, ZeitzschelB (2001) Basin-wide particulate carbon flux in the Atlantic Ocean: Regional export patterns and potential for atmospheric CO2 sequestration. global Biogeochem Cycles 15:845–862
Badger MR, Andrews TJ, whitney SM, Ludwig M, Yellowlees CD, Leggat w, Price gD (1998) The diversity and coevolution of RUBISCO, plastids, pyrenoids, and chloroplastbased CO2-concentrating mechanisms in algae. Can J Bot 76:1052–1071
Baker AC, Starger CJ, McClanahan TR, glynn Pw (2004) Coral reefs: Corals’ adaptive response to climate change. Nature 430(7001):741–741
Bakun A (1990) global climate change and intensification of coastal ocean upwelling. Science 247(4939):198–201
Balch wM, gordon hR, Bowler BC, Drapeau DT, Booth ES (2005) Calcium carbonate measure-ments in the surface global ocean based on Moderate-Resolution Imaging Spectroradiometer data. J geophys Res 110:C07001. doi:10.1029/2004JC002560
Balch wM, Drapeau D, Bowler B, Booth E (2007) Prediction of pelagic calcification rates using satellite measurements. Deep Sea Res Part II 54:478–495
Bates NR (2006) Air-sea CO2 fluxes and the continental shelf pump of carbon in the Chukchi Sea adjacent to the Arctic Ocean. J geophys Res 111:C10013. doi:10.1029/2005JC003083 Bates NR, Best MhP, hansell DA (2005) Spatio-temporal distribution of dissolved inorganic
carbon and net community production in the Chukchi and Beaufort Seas. Deep Sea Res II 52:3303–3323
Bates NR, Moran SB, hansell DA, Mathis JT (2006) An increasing CO2 sink in the Arctic Ocean due to sea-ice loss. geophys Res Lett 33:L23609. doi:10.1029/2006gL027028
Behrenfeld MJ, O’Malley RT, Siegel DA, McClain CR, Sarmiento JL, Feldman gC, Milligan AJ, Falkowski Pg, Letelier RM, Boss ES (2006) Climate-driven trends in contemporary ocean productivity. Nature 444:752–755
Benner R, Benitez-Nelson B, Kaiser K, Amon RMw (2004) Export of young terrigenous dissolved organic carbon from rivers to the Arctic Ocean. geophys Res Lett 31:L05305. doi:10.1029/2003gL019251
Bograd SJ, Castro Cg, Di Lorenzo E, Palacios DM, Bailey h, gilly w, Chavez FP (2008) Oxygen declines and the shoaling of the hypoxic boundary in the California Current. geophys Res Lett 35:L12607. doi:10.1029/2008gL034185
Bopp L, Monfray P, Aumont O, Dufresne JL, Le Treut h, Madec g, Terray L, Orr JC (2001) Potential impact of climate change on marine export production. global Biogeochem Cycles 15(1):81–99
Bopp L, Le Quéré C, heimann M, Manning AC, Monfray P (2002) Climate-induced oceanic oxygen fluxes: Implications for the contemporary carbon budget. global Biogeochem Cycles 16(2):1022. doi:10.1029/2001gB001445
Bopp L, Borges AV, Aumont O, Ethe C, Ciais P (2008) Integrating CO2 fluxes in the coastal ocean: Simulating natural variability and anthropogenic uptake with a global model of 0.5½b0 horizontal resolution, 2008 Ocean Sciences Meeting (ASLO AgU, TOS), March 2–7, 2008, Olando, FL Borges AV (2005) Do we have enough pieces of the jigsaw to integrate CO2 fluxes in the Coastal
Ocean ? Estuaries 28(1):3–27
Borges AV, Frankignoulle M (1999) Daily and seasonal variations of the partial pressure of CO2 in surface seawater along Belgian and southern Dutch coastal areas. J Mar Syst 19:251–266 Borges AV, Frankignoulle M (2002a) Distribution of surface carbon dioxide and air-sea exchange
in the upwelling system off the galician coast. global Biogeochem Cycles 16(2):1020. doi:10.1029/2000gB001385
Borges AV, Frankignoulle M (2002b) Distribution and air-water exchange of carbon dioxide in the Scheldt plume off the Belgian coast. Biogeochemistry 59(1–2):41–67
Borges AV, Frankignoulle M (2003) Distribution of surface carbon dioxide and air-sea exchange in the English Channel and adjacent areas. J geophys Res 108(C8):3140. doi:10.1029/2000JC000571 Borges AV, Djenidi S, Lacroix g, Théate J, Delille B, Frankignoulle M (2003) Atmospheric CO2 flux
from mangrove surrounding waters. geophys Res Lett 30(11):1558. doi:10.1029/2003gL017143 Borges AV, Delille B, Frankignoulle M (2005) Budgeting sinks and sources of CO2 in the coastal ocean:
Diversity of ecosystems counts. geophys Res Lett 32:L14601. doi:10.1029/2005gL023053 Borges AV, Schiettecatte L-S, Abril g, Delille B, gazeau F (2006) Carbon dioxide in European
coastal waters, Estuarine. Coast Shelf Sci 70(3):375–387
Borges AV, Tilbrook B, Metzl N, Lenton A, Delille B (2008a) Inter-annual variability of the car-bon dioxide oceanic sink south of Tasmania. Biogeosciences 5:141–155
Borges AV, Ruddick K, Schiettecatte L-S, Delille B (2008b) Net ecosystem production and carbon dioxide fluxes in the Scheldt estuarine plume. BMC Ecology 8:15. doi:10.1186/1472-6785-8-15 Borges AV, Alin SR, Chavez FP, Vlahos P, Johnson KS, holt JT, Balch wM, Bates N, Brainard
R, Cai w-J, Chen CTA, Currie K, Dai M, Degrandpre M, Delille B, Dickson A, Feely RA, Friederich gE, gong g-C, hales B, hardman-Mountford N, hendee J, hernandez-Ayon JM, hood M, huertas E, hydes D, Ianson D (IOS, CA), Krasakopoulou E, Litt E, Luchetta A, Mathis J, Mcgillis wR, Murata A, Newton J, Ólafsson J, Omar A, Perez FF, Sabine C, Salisbury JE, Salm R, Sarma VVSS, Schneider B, Sigler M, Thomas h, Turk D, Vandemark D, wanninkhof R, ward B (2009) global sea surface carbon observing system: Inorganic and organic carbon dynamics in coastal oceans. In: hall J, harrison DE, Stammer D (eds) Proceedings of OceanObs’09: Sustained ocean observations and information for society (vol 2), Venice, Italy, 21–25 September 2009. ESA Publication wPP-306
Borges A.V. & N. gypens (2010) Carbonate chemistry in the coastal zone responds more strongly to eutrophication than to ocean acidification, Limnology and Oceanography, 55, 346–353 Bouillon S, Frankignoulle M, Dehairs F, Velimirov B, Eiler A, Abril g, Etcheber h, Borges AV
(2003) Inorganic and organic carbon biogeochemistry in the gautami godavari estuary (Andhra Pradesh, India) during pre-monsoon: The local impact of extensive mangrove forests. global Biogeochem Cycles 17(No. 4):1114. doi:10.1029/2002gB002026
Boyd Pw, Doney SC (2002) Modelling regional responses by marine pelagic ecosystems to global change. geophys Res Lett 29. doi:10.1029/2001gL014130
Burkhardt S, Zondervan I, Riebesell U (1999) Effect of CO2 concentration on the C:N:P ratio in marinephytoplankton: A species comparison. Limnol Oceanogr 44:683–690
Burkhardt S, Amoroso g, Riebesell U, Sültemeyer D (2001) CO2 and hCO3– uptake in marine diatomsacclimated to different CO2 concentrations. Limnol Oceanogr 46:1378–1391 Cai w-J (2003) Riverine inorganic carbon flux and rate of biological uptake in the Mississippi
River plume. geophys Res Lett 30(2):1032. doi:10.1029/2002gL016312
Cai w-J, wang Y (1998) The chemistry, fluxes, and sources of carbon dioxide in the estuarine waters of the Satilla and Altamaha Rivers, georgia. Limnol Oceanogr 43(4):657–668 Cai w-J, wang ZA, wang Y (2003) The role of marsh-dominated heterotrophic continental
mar-gins in transport of CO2 between the atmosphere, the land-sea interface and the ocean. geophys Res Lett 30:1849. doi:10.1029/2003gL017633
Cai w-J, Dai Mh, wang YC (2006) Air-sea exchange of carbon dioxide in ocean margins: A province-based synthesis. geophys Res Lett 33:L12603. doi:10.1029/2006gL026219 Cai w-J, guo X, Chen CTA, Dai M, Zhang L, Zhai w, Lohrenz SE, Yin K, harrison PJ, wang Y
(2008) A comparative overview of weathering intensity and hCO3- flux in the world’s major
rivers with emphasis on the Changjiang, huanghe, Zhujiang (Pearl) and Mississippi Rivers. Cont Shelf Res 28(1–2):1538–1549
Canadell Jg, Le Quéré C, Raupach MR, Field CB, Buitenhuis ET, Ciais P, Conway TJ, gillett NP, houghton RA, Marland g (2007) Contributions to accelerating atmospheric CO2 growth from economic activity, carbon intensity, and efficiency of natural sinks. Proc Natl Acad Sci U S A 104:18353–18354
Chen CTA (2004) Exchange of carbon in the coastal seas. In: Field CB, Raupach MR (eds) The global carbon cycle: Integrating human, climate and the natural world. SCOPE, washington, DC, pp 341–351
Chen CTA, Borges AV (2009) Reconciling opposing views on carbon cycling in the coastal ocean: Continental shelves as sinks and near-shore ecosystems as sources of atmospheric CO2. Deep Sea Res II 56(8–10):578–590
Copin-Montégut C, Bégovic M, Merlivat L (2004) Variability of the partial pressure of CO2 on diel to annual time scales in the Northwestern Mediterranean Sea. Mar Chem 85(3–4): 169–189
da Cunha LC, Buitenhuis ET, Le Quéré C, giraud X, Ludwig w (2007) Potential impact of changes in river nutrient supply on global ocean biogeochemistry. global Biogeochem Cycles 21:gB4007. doi:10.1029/2006gB002718
Davidson EA, Janssens IA (2006) Temperature sensitivity of soil carbon decomposition and feed-backs to climate change. Nature 440(7081):165–173
Degrandpre MD, Olbu gJ, Beatty CM, hammar TR (2002) Air-sea CO2 fluxes on the US Middle Atlantic Bight. Deep Sea Res Part II 49(20):4355–4367
Delille B, harlay J, Zondervan I, Jacquet S, Chou L, wollast R, Bellerby RgJ, Frankignoulle M, Borges AV, Riebesell U, gattuso J-P (2005) Response of primary production and calcification to changes of pCO2 during experimental blooms of the coccolithophorid Emiliania huxleyi. global Biogeochem Cycles 19:gB2023. doi:10.1029/2004gB002318
Diaz RJ, Rosenberg R (2008) Spreading dead zones and consequences for marine ecosystems. Science 321:926–929
Dickson Ag, Millero FJ (1987) A comparison of the equilibrium constants for the dissociation of carbonic acid in seawater media. Deep Sea Res 34:1733–1743
Diffenbaugh NS, Snyder MA, Sloan LC (2004) Could CO2-induced land-cover feedbacks alter near-shore upwelling regimes? Proc Natl Acad Sci U S A 101(1):27–32
Di Lorenzo E, Miller AJ, Schneider N, Mcwilliams JC (2005) The warming of the California current system: Dynamics and ecosystem implications. J Phys Oceanogr 35(3):336–362 Doney SC, Mahowald N, Lima I, Feely RA, Mackenzie FT, Lamarque J-F, Rasch PJ (2007)
Impact of anthropogenic atmospheric nitrogen and sulfur deposition on ocean acidification and the inorganic carbon system. Proc Natl Acad Sci 104(37):14580–14585
Doney SC, Fabry VJ, Feely RA, Kleypas JA (2009) Ocean acidification: The other CO2 problem. Annu Rev Mar Sci 1:169–192


![Table 3.3 Minimum values of the partial pressure of CO 2 (pCO 2 ), ph, [CO 2 ] reported in various continental shelf seas](https://thumb-eu.123doks.com/thumbv2/123doknet/6747236.186168/19.659.86.571.119.303/table-minimum-values-partial-pressure-reported-various-continental.webp)
