Problematic of Drinking Water Access in Rural Area: Case
Study of the Sourou Valley in Burkina Faso
Savadogo Boubacar1, Kaboré Aminata2, Zongo Dramane1, Poda Jean Noel1, Bado Hortense3, Rosillon
Francis4, Dayeri Dianou1*
1National Center for Scientific and Technological Researches, Institute for Health Sciences Research, Ouagadougou, Burkina Faso; 2Research Center for Biological, Alimentary and Nutritional Sciences, Research and Training Unit, Life and Earth Sciences, Univer-
sity of Ouagadougou, Ouagadougou, Burkina Faso; 3Convention for the Promotion of a Sustainable Development, Non-Govern-
mental Organization, Ouagadougou, Burkina Faso; 4Water, Environment, Development Unit, Arlon Campus, University of Liège,
Arlon, Belgique.
Email: *dayerid@yahoo.fr
Received October 20th, 2012; revised November 17th, 2012; accepted December 15th, 2012
ABSTRACT
Safe drinking water access for rural populations in developing countries remains a challenge for a sustainable develop-ment. The study aims to investigate the drinking water quality and the factors affecting this quality in the Sourou valley in Burkina Faso. A total of 135 water samples were collected in sterile glass bottles during the dry seasons 2007, 2008, and 2012 from 10 drillings and 5 wells. Fifteen physicochemical parameters and two fecal pollution indicators (Es-cherichia coli and fecal Coliforms) were monitored based on laboratory standard methods. Datas were analyzed, using the Student t’ test and XLSTAT 7.5.2 statistical software. From results obtained, water quality was related to water source and sampling period as well (p < 0.0001). 30% of drillings provided water with nitrates concentration over the World Health Organization (WHO) guideline value. High turbidity was also observed for some drillings. Moreover, 90% of drillings showed water total hardness largely over the WHO threshold value. Water from drillings were exempt of fecal pollution, contrasting with the wells one which appeared uniformly polluted with concentrations exceeding sometimes 103 and 104 CFU/100 ml for E. coli and fecal Coliforms, respectively. Field investigations showed a prefer-ence of wells as drinking water source, and that appeared related to the lack of self-management of drillings and to cul-tural considerations. Overall, this study highlighted that a regular survey of water quality, management of protection zones around drinking water sources, sensitization on water resources self-management, hygiene and health issues, and providing appropriate household disinfection methods could help advancing to reach an effective safe drinking water access for rural populations in the country.
Keywords: Drinking Water; Chemistry; Bacteriology; Pollution; Sourou; Burkina Faso
1. Introduction
Access to safe drinking-water is important as a health and development issue at national, regional and local lev-els. In some regions, it has been shown that investments in water supply and sanitation can yield a net economic benefit, since the reductions in adverse health effects and health care costs outweigh the costs of undertaking the interventions. This is true for major water supply infra- structure investments through to water treatment in the home. Experience has also shown that intervenetions in improving access to safe water favor the poor in particu- lar, whether in rural or urban areas, and can be an effec- tive part of poverty alleviation strategies [1].
However, safe drinking water access for rural popula-
tions in developing countries (DC) remains a challenge to overcome for a sustainable development. Despite ap- preciable efforts undertaken to achieve the Millennium Development Goals (MDG), many of these countries are still suffering from a lack of drinking water access [2,3]. In view of the increase in water demand, measures un- dertaken generally focused the quantitative aspect to meet the needs of populations. However, beyond the quantita- tive aspect, it is advisable to pay attention on the quality of water consumed by the populations. Unfortunately, in most DC, analytical data of water quality are missing [4], although it is well known that the control of water in its different components is essential for the socioeconomic development of a country, and that also determine the implementation of the MDG in the other sectors [5,6].
Considering water access for populations in Burkina
Faso, the National Action Plan for Integrated Water Ma- nagement Resources [7] depicted the country as in situa- tion of hydric stress, the mean water resources available and accessible being 850 m3 per year and per inhabitant, compared to the threshold water shortage generally eva- luated to 1000 m3. The situation is partially related to the fact that in most parts of the country, the aquifer system is located in a sedimentary zone with hard stones repre-sented by sandstones and limestone-dolomites with a thickness estimated to a hundred meters [8,9] and that li- mits strongly the possibility to realize drillings with a high flow and at low cost. As a consequence, the urban hy-draulic resorts quite exclusively to surface waters to feet populations demand (i.e. dams of Ziga and Loumbila which actually aliment the capital of the country, Oua-gadougou) [10].
At national level, the regulation on the quality of water resources is sustained by a decree which fixes the stan- dards of pollutants in surface waters and drinking water as well with regards to WHO standards and the specific situations in the country [11]. Specifically for drinking water quality, the guideline values currently referred by the national office of water are the ones recommended by WHO [12].
According to the United Nations Development Pro- gram [13], the access to safe drinking water in Burkina Faso clearly improved these years with a national rate of water access passing from 18.3% in 1993 to 66.3% in 2007. These good performances are the consequence of the efforts undertaken by the country to achieve the Mil- lennium Development Goals (MDG). These efforts led to the reinforcement of the infrastructures of water supply. The network of drinking water adduction which was of 881 kilometers in 1986 reached 3129 kilometers in 2004 while between 2006 and 2007, the projects and programs allowed the realization of approximately 1882 drillings [13]. However, the situation is undoubtedly variable from one place to another in the country, the urban en-vironment being privileged compared to the rural one [14].
Although Burkina Faso already reached the MDG for the access to safe drinking water [13], the situation is not therefore satisfactory, in particular in rural environment where the populations are confronted with the optimal management of the water supply points. If in urban en- vironment, water distributed is subjected to regular con- trol, in rural area the indicators of drinking water quality are missing due to the lack of analytical data [15-17]. An improvement of knowledge is however essential to make the water services more efficient and to reinforce the policy for an effective access to safe drinking water in the country. From this view point, one of the recommen- dations of the National Action Plan for Integrated Water Management Resources (APIWRM), consists to the
in-stallation of networks for water analysis [7,18].
To meet this recommendation, a network for surface waters and groundwaters quality survey was initiated since 2006 within the framework of the Contract of the Sourou River [19]. Following a first investigation on the quality of surface waters [17], the present study examines the general physicochemical and bacterial parameters of water from wells and drillings consumed by populations in the Sourou valley.
After the presentation of the context of the study and the methodology used, the results obtained will be pre- sented. The quality of water will be discussed with re- gard to the national and WHO standards [11,12,20-22], and the environmental factors and socio-behavioral at- titudes impacting the access to safe drinking water be- fore proposing some issues in order to improve the si- tuation.
2. Study Context
As underlined in our previous works [15-17], the study was realized within the framework of the implementation of a project of river contract in the Sourou’ watershed. In 2003, through cooperation with the Walloon Region of Belgium, a river contract based on the Walloon model was initiated [19]. This model is an approach of integra- ted and participatory management which aims at gather- ing within a river committee the representatives of all the users of water in order to define and implement a restora-tion acrestora-tions program of the water resources, waterways and their accesses. This program was elaborated accord-ing to a consensual approach which takes care to inte-grate the concerns of each user while improving the pro-tection of environment. In Burkina Faso, it was proved that the river contract could also be an issue to fight against desertification and poverty [19].
This project which has been developed on nearly ten years was framed locally by a NGO, the Convention for the promotion of a sustainable development (COPROD) which dealt with the animation and the coordination of the activities. The Department of Environment of the University of Liege in Belgium ensured the general co- ordination and the scientific expertise for the account of the Walloon Region in collaboration with the Institute for Health Sciences Research (IRSS) of the Scientific and Technological National Research Center (CNRST) of Ouagadougou.
Considering the operational characteristic of the river contract, many field activities were performed [23]. The activities were divided into five sets of themes: 1) Coor- dination, animation and dialog between actors of water; 2) Improvement of knowledge through the data acquisition and the organization of many formations for the users of water and the local collectivities; 3) Communication,
information and sensitization of schools and water users; 4) Restoration of the water resources and the environ- ment which is concretized by an improvement of water access and environment protection (waterways protection and fight against desertification); and 5) Income-gener- ating activities in a context of fighting against poverty.
the Mouhoun loop (Figure 1). The Sourou River takes its source in Mali at the level of Baye. It makes border be- tween Burkina Faso and Mali, by then crossing the Bur- kina Faso from north to south before joining Mouhoun River at Léry. The Sourou’ watershed covers a surface of 16,200 km2 but only the central part located on the left bank of the river (approximately 5000 km2) is the object of this study.
The present study is in line with an improvement of knowledge related to the quality of water resources in the Sourou basin. It also meets one of measures recom- mended by the APIWRM in the actions field No. 2 “wa- ter information system”: action 2.2, the implementation of national networks to monitor the water quality, water uses, water requests and the risks [7].
The Sourou valley is especially known for its hydro- agricultural installations following the erection of dam valves at the junction of Sourou and Mouhoun rivers in 1984. The realization allowed to increase significantly the level of water of the Sourou River (600,000,000 m3) through the valley [15]. This availability of water thus allowed the creation of irrigated perimeters, making the Sourou valley an important agricultural production zone [15].
3. Study Zone
The Sourou valley as previously described [15-17] is lo- cated in the North-West of Burkina Faso, in the area of
Currently, the irrigated perimeters extend on a surface of 3200 ha (which will be soon increased with a new additional zone of 2033 ha) and are managed under the direction of the Sourou Valley Development Authority (SVDA). The Sourou valley thus constitutes an important agrarian production zone benefitting the whole country [14].
Drinking water access for Sourou populations is pos- sible from various sources of supply, mainly from ground- waters. Except for some more important localities like
Tougan, chief town of the Sourou Province, which prof-its from a partial system of water adduction, the rural populations generally feed on from traditional wells to a relatively dense network of drillings installed by NGO within the framework of cooperative projects or pro- grams supported by the Government, notably the second Soils Management National Plan (SMNP 2); however, populations of insular villages or close to the Sourou river use surface water for their alimentation (Figure 2).
Figure 2. Some aspects of drinking water access in the Sourou valley. (a) Getting water from Niassan-AMVS drilling (Janu-ary 2012); (b) Aspects of water sampled from drillings (November 2007); (c) Getting water from a modern well at Kouy (January 2012); (d) Getting water from the traditional well of Kouy-Mosque (March 2008); (e) Getting drinking water from Sourou River at Toma-island (January 2012); (f) Transportation of drinking water collected from drilling to home at Kiem-bara (January 2012).
The availability of groundwater is rather stable. The Sourou aquifer system is located in a sedimentary zone and consists of hard stones represented by sandstones and limestone-dolomites which can be crossed by faults. The thickness of the aquifers’ sandstones is estimated to a hundred meters [24]. The depth of drillings is about a sixty meters while the water level in the traditional wells is variable from one site to another, the depth being of approximately 10 to 20 m in the zone of the study.. The refill of the aquifer can be established through a slow infiltration in the subsoil. This diffuse refill could be supplemented by a preferential water flow through frac-tured zones [14].
Within the framework of the Sourou river contract, an inventory of wells and drillings were carried out [19]. This
inventory identified many non-functional works which were the object of repair within the framework of this river contract. More than 100 works were thus given back in activity.
4. Material and Methods
4.1. Water Sampling and Field Information Gathering
The groundwater resources focused in this study consisted of 10 drillings and 5 wells (traditional or modern, large diameter wells) located throughout the valley (Figure 3). Sampling campaigns were carried out in 2007, 2008 and 2012 during the dry season for which water demand and pressure on water sources were particularly high .
Echelle:1:300000 4 0 4 8 km
Figure 3. Location of sampling sources within the zone covered by the river contract in the Sourou valley [19]. Modern well (3); Traditional well (2); Drilling (10).
Water samples were collected aseptically in triplicate into sterile glass bottles at the field (Figure 2(b)). A total of 45 samples were taken and analyzed during each campaign. Samples collected at the field were preserved at 4˚C in cool boxes, carried to the National Laboratory for Water Analysis in Ouagadougou and stored in a re- frigerator at 4˚C before analysis. Some samples were blocked by the addition of mercuric chloride and analy- zed in Belgium for nitrates at the laboratory of water resources, University of Liège.
During sampling, field observations, supplemented by information collected from water users and local autho- rities fed the reflection in order to try to identify the sour- ces of constraints to safe drinking water access.
4.2. Sample Analysis
A total of 15 physicochemical parameters were determin- ed. Parameters such as pH and conductivity were mo- nitored on-site with a portable Hatch Multimeter and kit. Other parameters were determined from samples preser- ved at 4˚C in cool boxes by the National Laboratory for Water Analysis of the Ministry of Environment and Sus- tainable Development in Ouagadougou, in the 2 - 3 days following sampling, using standard methods [25, 26].
For nitrates/nitrites determination, proportioning was carried out by molecular absorption spectrophotometry through nitrates reduction in nitrites by cadmium (spectro Hach DR2400 method 8171).
Iron in the water samples was analyzed using Atomic Absorption Spectrophotometer (AAS) after pre-concen- tration [25,26].
Two bacterial indicators of fecal contamination name- ly Escherichia coli, and fecal Coliforms were enumera- ted 3 - 4 hours following sampling at the Laboratory of Tougan hospital, using the membrane filtration tech- nique [25]. Bacterial cells were concentrated on a 0.2 µm Millipore Membrane Filter followed by culture on the chromogenic RAPID E. COLI 2 AGAR (BIO RAD) medium which contains 2 substrates specific to the β-D- Glucuronidase (Gluc) and β-D-Galactosidase (Gal) en-zymes, respectively. Incubation was performed at 44.5˚C for 24 h. Colonies of E. coli (Gal+/Gluc+) ap-pears violet to pink while other coliforms colonies stain blue.
4.3. Statistical Method
Data obtained were analyzed for water source and sam- pling period variations using the Student’s t-test and XLSTAT 7.5.2 statistical software. Mean parameters concentrations were compared according to the Newman Keuls’ test.
5. Results and Discussion
5.1. Water Physicochemical Characteristics
The results of the statistical analysis on the data obtained are presented in Tables 1(a) and (b) while the mean cha- racteristics are shown in Tables 2(a) and (b).
The Student’s t-test revealed that all the characteristics of water were significantly related to the sampling site (p < 0.0001) and period as well (p < 0.0001), except cal- cium, magnesium and total hardness (Tables 1(a) and
(b)). The joined effects of site and period affected also
significantly (p < 0.0001) these characteristics except total hardness (p = 0.291). The spatio-temporal variation in response to water source and sampling period implied that water samples were collected from sources of dif- ferent physicochemical characteristics which are more influenced by the period of water collection.
Mean turbidity values recorded for some water sam- ples were higher than the national and WHO guideline value of 5 NTU for drinking water [11,12,20]. According to the sampling period, high turbidity of water was re- corded for the drillings of Kassoum-CEG (12 NTU in 2007), Yaba (14.6 NTU in 2007) and especially Sono (104-180 NTU in 2007-2008) (Table 2(a)). For the later, the turbidity seemed related to the oxidation of iron in contact of air as indicated by the reddish-brown color observed after a few minutes subsequent to water collec-tion into flasks (Figure 2(b)). All samples from wells showed uniformly turbidity over the WHO threshold value. Since wells are not protected, they can receive sus- pended material leading to turbidity increase as con-firmed our field observations. As also underlined in stu- dies, excessive turbidity may also be associated with un-pleasant tastes and odors [27]. Turbidity also correlates with iron content of water samples [28] as observed at some sampling periods for water samples of Sono and Yaba drillings (Tables 2(a) and (b), Figure 2(b)). As a consequence, the water source can be rejected by popula-tions and that corroborated the case of Sono drilling.
The mean pH of the water samples ranged from slight- ly acid (pH 5.96) to slightly basic (pH 7.70) (Table 2(a)). Although pH usually has no direct impact on consumers, high pH can affect the palatability. No healthbased guide- line value has been proposed for pH; however, an accep- table range for drinking water pH is from 6.5 to 8.5 [20- 22]. Corrosion effects may also become significant be- low pH 6.5 and that corroborated the case of Sono drill- ing, and at a less extent Yaba drilling!
Mean water conductivity values recorded ranged from 45 - 2465 μS·cm−1 (Table 2(b)). Although no health haz-ard for populations was found associated to conductivity, classification of potability based on electrical conductiv-ity ascribes <325 μS·cm−1 for fresh and potable water [29]. From the results obtained, 60% of the water sources
Table 1. (a) Variance of the physicochemical characteristics of water from drillings and wells with regard to sampling site and sampling period. (b) Variance of the physicochemical characteristics of water from wells and drillings with regard to sampling site and period (continued).
(a) Nitrates (mg NO3/l) Nitrites (mg NO2/l) pH Potassium (mg K+/l) (mg NaSodium +/l) Sulfates (mg SO24/l) Turbidity (NTU) Source of variation df MS p MS p MS p MS p MS p MS p MS p Site 14 312192.8 < 0.0001** 4882.4 < 0.0001** 0.982 < 0.0001**13572.61 < 0.0001**195.65 < 0.0001** 868184.6 < 0.0001** 5202.21 < 0.0001** Period 2 5512.7 < 0.0001** 0.002 < 0.0001** 0.128 < 0.004** 540.16 < 0.0001** 41.27 < 0.0001** 1371.13 < 0.0001** 24.24 < 0.0001** Site*Period 28 4882.4 < 0.0001** 0.001 < 0.0001** 0.101 < 0.0001** 371.42 < 0.0001** 3.25 < 0.0001** 1052.77 < 0.0001** 1600.09 < 0.0001**
MS means square; **significant p < 0.01.
(b) Ammonium (mg NH4+/l) Conductivity (µS/cm) Arsenic (µg As/L) Calcium (mg Ca2+/l) Calcium hardness (mg CaCO3/l) Total hardness (mg CaCO3/l) Total Iron (mg Fe/l) Magnesium (mg Mg2+/l) Source of variation df MS p MS p MS p MS p MS p MS p MS p MS p Site 14 1.993 < 0.0001** 3572554.2 < 0.0001** 0.00011.548 < ** 89167.4 < 0.0001** 553279 < 0.0001** 1136052.2 < 0.0001** 0.000127.17 < ** 7238.99 < 0.0001** Period 2 0.035 < 0.0001** 6154.45 < 0.0001** 2.118 < 0.0001** 2.164 0.754ns 74.63 0.018* 7329.80 0.0383ns 61.15 0.0001** 14.92 0.038* Site*Period 28 0.020 < 0.0001** 16955.9 < 0.0001** 0.239 < 0.0001** 40.929 < 0.0001** 233.61 < 0.0001** 8792.11 0.291ns 0.000115.38 < ** 31.45 < 0.0001**
MS means square; *significant p < 0.05; **significant p < 0.01; nsnot significant p < 0.05.
showed mean values of water electrical conductivity over the ascribed potability value of 325 μS·cm−1. Mean val-ues were particularly high throughout the 3 sampling periods for the drillings of Wawara (2215 - 2465 µS·cm−1), Diouroum (837 - 1168 µS·cm−1); Di (764 - 906 µS·cm−1), Niassan-AMVS (541 - 606 µS·cm−1) and Ni-assan-Clinic (557 - 600 µS·cm−1). The high conductivity of these ground-waters may be related to the bedrock they flow through as suggested [21].
Total Hardness values in the water samples ranged from 16.0 - 1447.3 mg/l CaCO3. This parameter varied significantly with only the sampling source (p < 0.0001) but not with the sampling period (p = 0.383) or both joined factors (p = 0.291). Water hardness was particu-larly remarkable for all the water sources studied, except the drilling of Kouy, the modern well of Yaba and the traditional well of Sono. A high and practically constant value throughout the study periods was recorded for the water of Wawara drilling (1446 - 1447 mg CaCO3/l). Hardness in water comprises the determination of cal-cium and magnesium as the main constituents and their widespread abundance in rock formations leads often to very considerable hardness levels in surface waters or groundwaters. One of several arbitrary classifications of waters by hardness includes: Soft, up to 50 mg/l;
Moder-ately Soft, 51 - 100 mg/l; Slightly Hard, 101 - 150 /l; Moderately Hard, 151 - 250 mg/l; Hard, 251 - 350 mg/l; Excessively Hard, over 350 mg/l [30]. The degree of hardness of drinking water is important for aesthetic ac-ceptability by consumers.
From the values recorded (Table 2(b)), waters were classified as Soft for the drilling of Kouy (18 - 20 mg CaCO3/l), the modern well of Kassoum-Market (25-35.3 mg CaCO3/l), and the traditional well of Kouy-Mosque (16 - 22.6 mg CaCO3/l); Moderately Soft for the drilling of Sono-Clinic (90.3 - 91 mg CaCO3/l) and the traditional well of Sono-Centre (62 - 64 mg CaCO3/l), Slightly Hard for the drillings of Kassoum-CEG (107.6-128.6 mg CaCO3/l) and Yaba-Clinic (142-146 mg CaCO3/l); Slightly-to-Moderately Hard for the drilling of Kassoum- School (117 - 240 mg CaCO3/l), Moderately Hard for the modern well of Yaba-Clinic (155 - 157.3 mg CaCO3/l), Hard for the drillings of Di (323.6 - 326 mg CaCO3/l), Niassan-AMVS (271 - 318.6 mg CaCO3/l) and Nias-san-Clinic (310 - 320 mg CaCO3/l); Slightly-to-Exces- sively Hard for the modern well of Diouroum (113.6 - 453 mg CaCO3/l) and Excessively Hard for the drillings of Diouroum (490 - 535.3 mg CaCO3/l) and Wawara (1446.3 - 1447.3 mg CaCO3/l). Although there is eviden- ce from epidemiological studies for a protective
Table 2. (a) Mean* physicochemical characteristics of water from wells and drillings during the dry season in 2007, 2008 and 2012 (*mean of 3 replicates). (b) Mean* physicochemical characteristics of water from wells and drillings during the dry sea-son in 2007, 2008 and 2012 (*mean of 3 replicates).
(a) Sampling Site Period (mg Nitrates /l)
3 NO Nitrites (mg NO2/l) pH Potassium (mg K+/l) (mg NaSodium +/l) Sulfates (mg 2 /l) 4 SO Turbidity (NTU) 2007 115g 0.027defghi 6.9bcdefgh 55f 7g 38c 1h 2008 126.5ef 0.013ghi 6.8cdefghi 120c 2.2klmn 40c 1h Di-CPD 2012 128ef 0.017fghi 7.0bcde 90d 5hi 42c 1.16gh 2007 860a 0.200b 6.46hijklm 6klm 14c 43c 1h 2008 610c 0.187b 6.46hijklm 5.03klm 9.1e 45c 1h Dioroum-COPRODD 2012 751.7b 0.290a 6.10no 5.13klm 12d 42c 1h 2007 3q 0.040cdef 6.6efghijkl 3lm 0.86no 5.66ij 12ef
2008 2.23q 0.014ghi 6.6efghijkl 4.2klm 0.53o 7hij 2.63gh
Kassoum-CEGD
2012 3q 0.011ghi 6.43ijklmn 2.8lm 0.83no 6ij 3gh
2007 19.3lmn 0.040cdef 7.13bc 6klm 2klmno 1.6j 1h
2008 23lm 0.035defg 7.0bcde 2.6lm 1.5klmno 2.3j 1.3gh
Kassoum-SchoolD
2012 24l 0.026efghi 6.96bcdef 5.7klm 1.8klmno 2j 1h
2007 19.5lmn 0.004hi 6.43ijklmn 0.20m 0.73no 1.7j 2.76gh
2008 19.9lmn 0.004hi 6.50ghijklmn 0.25m 0.8no 1.5j 2.73gh
Kouy-COPRODD
2012 13.8lmnopq 0.002i 6.63efghijk 0.23m 0.86no 1.76j 2.3gh
2007 12.1lmnopq 0.020fghi 7.0bcde 4klm 8.3ef 13.5fghi 1h
2008 12.6lmnopq 0.016fghi 7.0bcde 2.5lm 4.7hi 14.16fghi 1.3gh
Niassan-AMVSD
2012 18.3lmn 0.030defgh 7.0bcde 3.1lm 9e 15efghi 1.2gh
2007 11mnopq 0.010ghi 7.1bcd 3lm 9e 13fghi 1h
2008 15.3lmnop 0.010ghi 7.7a 4.4klm 4.9hi 14fghi 1.5gh
Niassan-ClinicD
2012 12.1lmnopq 0.010ghi 7.0bcde 5klm 7g 16defgh 4gh
2007 3q 0.040cdef 6.26klmno 2m 3jk 6ij 180a
2008 4pq 0.023efghi 6.16mno 1.9m 1.73klmno 5.33ij 104b
Sono-ClinicD
2012 4.23pq 0.012ghi 6.66defghijk 2.5lm 2.76jkl 8ghij 2.26gh
2007 122.3f 0.013ghi 6.03o 15j 9e 24de 14.66de
2008 134e 0.018fghi 6.20lmno 5.2klm 5.2hi 22def 2.8gh
Yaba-ClinicD
2012 82.7i 0.027efghi 5.96o 6klm 7.5fg 25d 4gh
2007 5.23opq 0.010ghi 6.73cdefghij 130ab 17b 1175b 1.2gh
2008 5.20opq 0.013ghi 6.70cdefghijk 132a 17b 1175b 1.2gh
Wawara-COPRODD
2012 2.5q 0.042cdef 6.66defghijk 128b 19a 1301.66a 4gh
2007 37.3k 0.021fghi 7.20b 32.3i 2klmno 16defgh 5gh
2008 96.7h 0.022fghi 7.20b 80e 1mno 17defg 2.5gh
Dioroum-PNGTMW
Continued
2007 15lmnop 0.010ghi 6.7cdefghijk 1m 3jk 2j 4gh
2008 13.7lmnopq 0.010ghi 6.8cdefghi 0.9m 1.3lmno 2j 2.4gh
Kassoum-MarketMW
2012 10.4nopq 0.010ghi 6.8cdefghi 3lm 1.5klmno 2j 6.43g
2007 240d 0.050cd 6.30jklmno 50g 5.1hi 39c 2.5gh
2008 93h 0.020fghi 6.30jklmno 50.7g 5.1hi 40c 3gh
Yaba-ClinicPM
2012 97.3h 0.060c 6.63efghijk 44.7h 5.8h 43c 4.9gh
2007 16lmno 0.030defgh 6.7cdefghijk 1m 4ij 1.63j 23.66c
2008 18.5lmn 0.025efghi 6.9bcdefgh 0.6m 2.8jkl 1.8j 22c
Kouy-MosqueTW
2012 20.5lmn 0.047cde 6.20lmno 0.8m 3jk 2j 23.36c
2007 46jk 0.010ghi 6.70cdefghijk 9k 2klmno 6ij 15de
2008 50.5j 0.018fghi 6.80cdefghi 4.3klm 1.66klmno 5ij 11.16f
Sono-CentreTW
2012 37.3k 0.010ghi 6.53fghijklm 8kl 2.53klm 8ghij 16.86d
Guideline values [20-22] 50 3 6.5 - 8.5 12 ≤200 ≤500 ≤5
Means with a same letter within a column are not significantly different according to Newman Keuls’ test p < 0.05. Ddrilling; MWmodern well; TWtraditional
well.
(b) Sampling Site Period (mg NHAmmonium
4+/l) Conductivity (µS/cm) Arsenic (µg As/l) Calcium
(mg Ca2+/l) Calcium hardness(mg CaCO 3/l) Total hardness (mg CaCO3/l) Total Iron (mg Fe/l) Magnesium (mg Mg2+/l)
2007 0.030nop 865f 2bc 68d 171def 323.6bcde 0.09jk 37e
2008 0.030nop 906e 1d 70d 174de 325bcde 0.1jk 38e Di-CPD 2012 0.030nop 764h 2bc 66d 176d 326bcde 0.09jk 36e 2007 0.430e 1079.3d 2bc 92c 231c 490bc 0.03k 62d 2008 0.553d 1168.6c 1.33cd 100b 249b 535.3b 9.8a 70c Dioroum-COPRODD 2012 0.380f 837.6g 1.66bcd 95c 235c 501.6bc 0.02k 65d
2007 0.050mnop 207.6vwu 2bc 20kl 50mn 107.6ef 0.05jk 14hijkl
2008 0.130ijklm 257.6u 1d 26hij 63.6l 128.6ef 0.2ijk 16hij
Kassoum- CEG D
2012 0.080jklmnop 260u 1d 23.33ijk 55m 111.6ef 0.02k 15hijk
2007 0.080jklmnop 440.3n 1.66bcd 44e 110.3i 240def 0.17jk 31.3f
2008 0.070klmnop 206.6vwu 1d 22kl 55m 117ef 0.3ijk 15hijk
Kassoum-SchoolD 2012 0.063lmnop 332.3t 1d 35fg 80jk 202ef 2.5g 18h 2007 0.020op 45z 1d 4o 10.3qr 18.6f 1.3 h 2.5m 2008 0.003p 46z 1d 4o 11.6qr 18f 1.5h 2.23m Kouy-COPRODD 2012 0.002p 54.6z 1d 5o 11.3qr 20f 0.29ijk 2.26m 2007 0.050mnop 580 j 1.93bc 63d 157.6g 282.6cdef 0.02k 39e
2008 0.160ij 606.3i 1d 69d 170.6def 318.6bcde 0.35ijk 26g
Niassan-AMVSD
Continued
2007 0.053mnop 582.3j 1.93bc 66d 163fg 315bcde 0.02k 37e
2008 0.060lmnop 600i 1.06d 66.6d 170def 320bcde 7c 37e
Niassan-ClinicD 2012 0.080jklmnop 557.3k 2bc 65d 150h 310bcde 0.02k 35e 2007 0.553d 217.3v 1.66bcd 17klm 42.6no 91ef 3.5e 12ijkl 2008 0.703c 204.6vwu 1d 15lm 38o 90.3ef 2.8f 13hijkl Sono-ClinicD 2012 0.700c 147.3y 1d 16lm 40.3no 90.3ef 0.25ijk 15hijk 2007 0.087jklmnop 422.6o 2bc 33fg 82.3jk 146ef 0.023k 15hijk 2008 0.150ijk 394pq 2bc 32fgh 79jk 138ef 5.35d Yaba-ClinicD 2012 0.083jklmnop 383qr 2.33ab 34fg 82.3jk 142ef 0.09jk 14hijkl 2007 1.95a 2465a 1d 407a 1015a 1447a 0.5i 105a 2008 1.95a 2465a 1d 410a 1015a 1447.3a 0.5i 105a Wawara-COPRODD 2012 1.65b 2215b 1d 405a 1012a 1446.3a 0.4i 100b 2007 0.020op 370.3rs 1d 32fgh 80jk 113.6ef 0.02k 9l 2008 0.013op 407.6p 1d 30fgh 75k 453bcd 0.3ijk 11jkl Dioroum-PNGTMW 2012 0.020op 360s 1d 28ghi 81jk 116ef 0.02k 10kl 2007 0.020op 71.3z 1d 11mn 28p 35.3f 0.04k 2m 2008 0.323g 60z 1d 8no 20q 27f 0.2ijk 2m Kassoum-MarketMW 2012 0.020op 51z 1d 15lm 18qr 25f 0.08jk 2m 2007 0.110ijklmn 467m 1d 35fg 87.3j 157.3ef 9.5b 17hi 2008 0.113ijklmn 468m 1d 35.66f 87.3j 157.6ef 9.5b 17hi Yaba-ClinicMW 2012 0.100jklmno 442n 1d 32fgh 85jk 155ef 0.1jk 17hi 2007 0.250h 46z 2.66a 4.16o 10qr 21f 0.08jk 3m 2008 0.250h 50z 2bc 3.1o 8r 16f 0.15jk 3m Kouy-MosqueTW 2012 0.500d 54z 2bc 5o 11qr 22.6f 0.32ijk 2.3m 2007 0.083jklmnop 172ux 1d 19kl 48mn 64ef 0.1jk 4m
2008 0.130ijklm 179wux 1d 19kl 47mno 63ef 0.4ij 4m
Sono-CentreTW
2012 0.180i 191wu 1d 18kl 46mno 62ef 0.3ijk 4m
Guideline values
[20-22] - <350 10 - - - ≤0.30 - -
Means with a same letter within a column are not significantly different according to Newman Keuls’ test p < 0.05. Ddrilling; MWmodern well; TWtraditional
well.
effect of magnesium, calcium or hardness on cardiovas-cular mortality, the evidence is being debated and does not prove causality. There are insufficient data to suggest
either minimum or maximum concentrations of minerals, as adequate intake will depend on a range of other factors. Therefore, no guideline values are proposed [20-22].
Out of the 15 water sources examined, 3 drillings (Di, Diouroum and Yaba) and one modern well (Yaba) pro-vided water with Nitrates concentrations exceeding the WHO and USEPA guideline value (50 mg NO3
/l) [15,
16]. The mean values for all the study periods were 123, 740, 113, and 143 mg 3/l for these water sources,
respectively. The highest concentrations of nitrates were recorded in 2007 for the drilling of Diouroum and the modern well of Yaba (860 and 240 mg/l, respectively), in 2008 for the drilling of Yaba (134 mg/l), and in 2012 for the drilling of Di (128 mg/l) (Table 2(a)). Nitrates con-centration in drinking water is more focused because high level can be hazardous to infants. The nitrate itself is not a direct toxicant but is a health hazard because of its conversion to nitrite, which reacts with blood haemo- globin to cause methaemoglobinaemia. Hence, 50 mg
3/l nitrate is set as Guideline standard for nitrate in
drinking water [20-22]. Concerning the study zone, con- centrations higher than 100 mg 3/l were observed by
FAO [31] in the areas of Mouhoun and Sourou. More- over, Nabayaogo [32] within the framework of a study on the impact of agricultural management on the water resources and the ecosystems of the Sourou valley, found nitrates contents of 2.7 to 37.2 mg/l for some wells and drillings located in Niassan village and on the riverside. These values reported by the author correspond appro- ximately to the range of values recorded in this same village for drillings during the present study (11 to 18.3 mg/l). Dugué [33] concluded that the pollution risk of the aquifer by nitrates of agricultural origin is nearly zero in the Sourou valley (zone of Di). However, concentrations reaching 41 mg 3/l were evidenced at the beginning
of rainy season in water of the Sourou River, particularly downstream Di village, within the framework of this project and these concentrations could be due to the cul-tivation practices in line with the production of tomato and onions [17]. For the nitrates concentrations in ground- water exceeding sometimes at a large extent the WHO standard in the Sourou valley, investigations were per- formed to elucidate the origin [15]. Several tracks of con- tamination were thus evoked near the works, in relation with the anthropic activities: animal and human wild de- fecation, waste discharges, wastewaters rejections and so on. It is particularly the case at Diouroum village where the ground is strewn with excrements. In addition, spe-cific organic matter deposits such as dunghills and com-posting areas can also generate rejections of nutrients. Latrines, although not very widespread in the Sourou villages can also punctually influence the quality of wa- ter (case of Yaba village), particularly in fractured zones where a fast contamination of the aquifer is possible. To these possible causes of nitrates pollution, the use of dy- namite for digging on the groundwater quality was sug- gested since many explosives contain in their structure a
nitrate radical which could remain in water after drilling. However, according to the authors, the precise diagnosis is not obvious to establish and it requires more in-depth investigation. Moreover, bacterial oxidation and fixation of nitrogen by plants can both produce nitrates [31]. Concerning nitrates originating from agricultural inputs, no connection between the fertilizers used and the con-tamination of groundwaters could be rigorously estab-lished, since most of the water supply points are far away from the hydro-agricultural perimeters. Moreover, sam-ples collected from Niassan village, next to the irrigated perimeters presented nitrates concentrations lower than the guideline value for drinking water [20-22].
NO
NO
NO
NO
Throughout the study periods, mean potassium con-centrations ranged from 0.2 - 132 mg K+/l (Table 2(a)). Rather high potassium concentrations were observed for 2 (13%) of the water sources examined, namely Wawara (128 - 132 mg/l) and Di (55 - 120 mg/l) drillings. As for nitrates, the variation in concentration, was related to the sampling period (p < 0.0001), the highest values being observed in 2008 for these water sources (132 and 120 mg/l, respectively). Potassium is an essential element in humans and is seldom, if ever found in drinking water at levels that could be a concern for healthy humans. The recommended daily requirement is greater than 3000 mg [20]. Potassium occurs widely in the environment, in-cluding all natural waters. Currently, there is no evidence that potassium levels in municipally treated drinking wa-ter, even water treated with potassium permanganate, are likely to pose any risk for the health of consumers [20]. Therefore, it is not considered necessary to establish a health-based guideline value for potassium in drinking water. Although potassium may cause some health ef-fects in susceptible individuals, potassium intake from drinking water is well below the level at which adverse health effects may occur. Health concerns would be re-lated to the consumption of drinking water treated by potassium-based water treatment (principally potassium chloride for regeneration of ion exchange water soften-ers), affecting only individuals in high-risk groups (i.e. individuals with kidney dysfunction or other diseases, such as heart disease, coronary artery disease, hyperten-sion, diabetes, adrenal insufficiency, pre-existing hyper-kalemia, people taking medications that interfere with normal potassium-dependent functions in the body, and older individuals or infants) [20].
For all the 15 water sources examined, the mean So-dium concentrations ranged from 0.5 to 19 mg Na+/l (Table 2(a)). Although concentrations of sodium in po-table water are typically less than 20 mg/l, they can greatly exceed this in some countries. No firm conclu-sions can be drawn concerning the possible association between sodium in drinking water and the occurrence of hypertension. Therefore, no health-based guideline value
is proposed. However, concentrations in excess of 200 mg/l may give rise to unacceptable taste [20].
The mean Magnesium and Calcium concentrations ranged from 2 - 105 mg Mg+/l and 4 - 410 mg Ca2+/l (Table 2(b)). Both parameters varied significantly with the water source (p < 0.01) and the sampling period (p < 0.05) (Table 1(b)). Garzon and Eisenberg [34] first showed that there is a large variation in mineral contents of commercially available bottled drinking waters. The magnesium content of bottled water available in North America ranged from 1 to 120 mg/l, and the calcium content ranged from 1 to 240 mg/l, whereas concentra-tion in bottled waters that are commercially available in Europe ranged from 0 to 546 mg/l for calcium and from 1 to 126 mg/l for magnesium. Comprehensive follow-up studies [35-37] on a wide range of commercially avail- able bottled waters suggested that the mineral levels va- ried tremendously in bottled waters within countries and around the world. As summarized by WHO [38] from the above sources, magnesium and calcium concentrations found in water ranged from 0 - 29 mg Mg2+/l and 2 - 83 mg Ca2+/l for surface water sources, 2 - 48 mg Mg2+/l and 26 - 85 mg Ca2+/l for groundwater sources, 1-130 mg Mg2+/l and 3 - 310 mg Ca2+/l for Mineral water. There-fore, out of the 15 water sources studied, only the drilling of Wawara (7% of the water sources) with concentrations of 100 - 105 mg Mg2+/l and 405 - 410 mg Ca2+/l can be classified as highly mineralized, while the other water sources (93%) crossed the values found for groundwater sources. Magnesium and Calcium are naturally occurring in surface or groundwater from erosion and weathering of soils, minerals or ores. There is no evidence of adverse health effects from calcium or magnesium in drinking water; both ions contribute to water hardness. Therefore, guideline values are not proposed [20,22,39].
Total Iron in water samples ranged from 0.02 - 9.8 mg Fe/l (Table 2(b)). These concentrations varied signifi-cantly with the sampling site and the sampling period as well (p < 0.0001; Tables 1(b) and 2(b)). Concentrations over the WHO and USEPA Guideline value (≤ 0.3 mg Fe/l) were found in water samples from the modern well of Yaba and the drillings of Diouroum, Niassan-clinic, Sono, Yaba and Kouy (6.3, 3.3, 2.3, 2.2, 1.8, and 1 mg Fe/l, respectively). Iron is one of the most abundant met-als in Earth’s crust. It is found in natural fresh waters at levels ranging from 0.5 to 50 mg/l [20]. Toxic effects have resulted from the ingestion of large quantities of iron, but there is no evidence to indicate that concentra-tions of iron commonly present in drinking water consti-tute any hazard to human health; hence, a maximum ac-ceptable concentration has not been set. However; at concentrations above 0.3 mg/l (drinking water standard), iron can stain laundry and plumbing fixtures and produce undesirable tastes in beverages. The precipitation of
ex-cessive iron impacts an objectionable reddish-brown co- lor to water and may also promote the growth of certain microorganisms (i.e. Iron-Reducing Bacteria), leading to the deposition of a slimy coating in water distribution pipes [20,31,39].
Ammonium concentrations in the water samples ranged from 0.002 - 1.95 mg NH4+/l (Table 2(b)). Con-centrations recorded in the water samples varied signifi-cantly with the sampling site and the sampling period as well (p < 0.0001, Table 1(b)). The term ammonia in-cludes the non-ionized (NH3) and ionized (NH4+) species. Ammonia in the environment originates from metabolic, agricultural and industrial processes and from disinfec-tion with chloramine. Natural levels in groundwater and surface water are usually below 0.2 mg/l. Anaerobic groundwaters may contain up to 3 mg/l. Intensive rearing of farm animals can give rise to much higher levels in surface water. Ammonia in water is an indicator of pos-sible bacterial, sewage and animal waste pollution. It represents a major component of the metabolism of mam- mals. Exposure from environmental sources is insig- nificant in comparison with endogenous synthesis of ammonia. Toxicological effects are observed only at ex- posures above about 200 mg/kg body weight. Ammonia in drinking-water is not of immediate health relevance, and therefore no health-based guideline value is proposed [20,22]. However, ammonia can compromise disinfect- tion efficiency, result in nitrite formation in distribution systems; it can also cause the failure of filters for the removal of manganese, taste and odor problems [20].
Mean Sulfates concentrations in the water samples ranged from 1.5 - 1301.66 mg /l (Table 2(a)). Con- centrations were significantly related to the sampling site and the sampling period as well (p < 0.0001: Table 1(a)). Sulfates occur naturally in numerous minerals and are used commercially, principally in the chemical industry. The highest levels usually occur in groundwater and are from natural sources. In general, the average daily intake of sulfates from drinking water, air and food is approxi- mately 500 mg, food being the major source. However, in areas with drinking water supplies containing high levels of sulfates, drinking water may constitute the prin- cipal source of intake [20-22]. No health-based guideline is proposed for sulfate. However, because of the gastro- intestinal effects (diarrhea or dehydration) resulting from ingestion of drinking water containing high sulfates lev- els, it is recommended that health authorities be notified of sources of drinking water that contain sulfate concen- trations in excess of 500 mg/l. The presence of sulfates in drinking water may also cause noticeable taste over 250 mg/l (threshold taste) and may contribute to the corrosion of distribution systems [20-22]. From the data recorded, out of the 15 water sources examined, only the drilling of Wawara (1175 - 1301.66 mg/l) appears to be of health
2 4 SO
concern regarding the defined standard (≤500 mg/l). The high sulfates levels leading to noticeable taste may par-tially explain the rejection by the village populations of this drilling for their alimentation as revealed our field investigations.
The mean Arsenic concentrations recorded for all the water sources studied were in the range of 1- 2.66 µg/l and crossed the guideline value for the maximum accep- table concentration of Arsenic in drinking water [20-22]. Arsenic is found widely in Earth’s crust in oxidation states of −3, 0, +3 and +5, often as sulfides or metal senides or arsenates. In water, it is mostly present as ar-senate (+5), but in anaerobic conditions, it is likely to be present as arsenite (+3). Levels in natural waters gener-ally range between 1 and 2 μg/l, although concentrations may be elevated (up to 12 mg/l) in areas containing na- tural sources [20]. Arsenic has not been demonstrated to be essential in humans. The acute toxicity of arsenic compounds in humans is predominantly a function of their rate of removal from the body. Arsine is considered to be the most toxic form, followed by the arsenites, the arsenates and organic arsenic compounds. Acute arsenic intoxication associated with the ingestion of well water containing very high concentrations (21.0 mg/l) of arse-nic has been reported [20]. Numerous epidemiological studies have examined the risk of cancers associated with arsenic ingestion through drinking water. The Interna-tional Program on Chemical Safety (IPCS) concluded that long-term exposure to arsenic in drinking-water is causally related to increased risks of cancer in the skin, lungs, bladder and kidney, as well as other skin changes, such as hyperkeratosis and pigmentation changes. In view of the practical difficulties in removing arsenic from drinking water, particularly from small supplies, and the practical quantification limit for arsenic (1 - 10 µg/l), the guideline value of 10 μg/l is retained as a goal [20].
5.2. Water Microbiology
The results of the microbiological examination of the water sources samples showing Escherichia coli and fe-cal Coliforms cells count throughout the sampling peri-ods are presented in Tables 3 and 4. All the drillings were exempt of fecal pollution and crossed the recom-mended guideline values [20-22]. By contrast, water from wells appeared uniformly polluted with concentrations exceeding sometimes 103 and 104 CFU/100 ml for E. coli and fecal Coliforms, respectively (Table 4). For the lat-ters, water pollution by both indicators was significantly (p < 0.0001) related to the water source location and the sampling period as well (Table 3). Since wells are not protected from environmental contaminations (Figures
3(c) and (d)), they may receive several depositions with
regard to the absence of latrines in rural area, animals
frequentation and the atmospheric conditions leading to water microbial pollution [15,17]. These potential sources or amplifying factors of microbial pollution may vary with the sampling source location and/or the sampling period as evidenced the data recorded (Table 3).
Field investigations showed a preference of wells as source of water for the alimentation of populations in the Sourou Valley, and that appeared mainly related to the high water hardness or sulfates content (noticeable taste) of water provided by some drillings (i.e. Wawara), pov-erty and cultural considerations. Therefore, these popula-tions are exposed to health risks [20-22] as underlined previous investigations in the zone [40-42].
5.3. Drinking Water Quality
Physico-chemical and microbiological parameters were analyzed to identify the physical status, impurities, other dissolved substances and microorganisms that affect wa-ter used for domestic purposes in the Sourou valley.
From the 15 water sources examined, water from 4 (26%) drillings was of health concern in view of nitrates concentration (Di, Yaba and Diouroum), sulfates content (Wawara) and the guideline values for these parameters, respectively [11,12,20-22]. The 6 other drillings (40%) can be classified as safe sources for drinking water with regards to the physico-chemical and microbiological qualities, guideline standards and health risks.
All water samples from wells (33% of water sources studied) appeared uniformly polluted from fecal con-taminations with concentrations of E. coli and fecal Coli- forms largely over the guideline values [11,12,20-22].
Overall, 9 (60%) of the water sources examined do not provide safe water for populations alimentation. As a consequence of such unhygienic water quality, water- borne diseases have proven to be the biggest health threat worldwide and they contribute between 70% - 80% of health problems in developing countries [1,28]. These diseases continue to be a major cause of human mortality and morbidity. Diarrheal diseases remain a leading cause of illness and death in the developing world which alone causes 2.2 million of the 3.4 million water-related deaths per year, 90% of these deaths involving children less than five years [1,20,28].
As revealed studies [17,40] and the present investiga-tions, populations in the Sourou valley are preferentially getting drinking water from wells and even do from the surface water of the Sourou River, although presenting unsafe quality. What could be the reasons undergoing such situation in the Sourou valley?
Field investigations (group discussions and interviews) were performed to elucidate the situation and to propose some issues for improving safe drinking water access for
Table 3. Variance of bacterial fecal pollution indicators in water from drillings and wells with regard to sampling site and sampling period.
Escherichia coli (CFU/100 ml) Fecal Coliforms (CFU/100 ml)
Source of variation df MS p MS p Site Period Site*Period 14 2 28 2414336.67 3171524.12 1440370.22 <0.0001** <0.0001** <0.0001** 68372495.25 76018114.69 33793213.73 <0.0001** <0.0001** <0.0001** MSmean square; **significant p < 0.01.
Table 4. Means* concentrations of E. coli and fecal Coliforms in water from drillings and wells during the dry season in the Sourou valley in 2007, 2008, and 2012 (*mean of 3replicates).
Sampling Site Period E. coli (CFU/100 ml) Fecal Coliforms (CFU/100 ml)
2007 0l 0m 2008 0l 0m Di-CPD 2012 0l 0m 2007 0l 0m 2008 0l 0m Dioroum-COPRODD 2012 0l 0m 2007 0l 0m 2008 0l 0m Kassoum- CEG D 2012 0l 0m 2007 0l 0m 2008 0l 0m Kassoum-SchoolD 2012 0l 0m 2007 0l 0m 2008 0l 0m Kouy-COPRODD 2012 0l 0m 2007 0l 0m 2008 0l 0m Niassan-AMVSD 2012 0l 0m 2007 0l 0m 2008 0l 0m Niassan-ClinicD 2012 0l 0m
Continued 2007 0l 0m 2008 0l 0m Sono-ClinicD 2012 0l 0m 2007 0l 0m 2008 0l 0m Yaba-ClinicD 2012 0l 0m 2007 0l 0m 2008 0l 0m Wawara-COPRODD 2012 0l 0m 2007 274h 4136k 2008 75.3k 334.6k Dioroum-PNGTMW 2012 800d 2203.3f 2007 127j 3167.3e 2008 140j 234l Kassoum-MarketMW 2012 4400a 7033.3d 2007 60.3k 1381.6g 2008 314.6g 840i Yaba-ClinicPM 2012 398.3f 21050a 2007 599.3e 800i 2008 890c 10722c Kouy-MosqueTW 2012 2801.6b 11993.3b 2007 220i 407.3k 2008 780d 1140h Sono-CentreTW 2012 200i 670j Guideline values [20-22] 0 0
*Means with a same letter within a column are not significantly different according to Newman Keuls’ test p < 0.05. Ddrilling; MWmodern well; TWtraditional well.
populations in the Sourou valley.
5.4. Problematic of Safe Drinking Water Access in the Sourou Valley
Although according to the United Nations Development Program, Burkina Faso already reached the MDG for the access to safe drinking water [13], the situation is not-therefore satisfactory, in particular in rural environment as underlined the Ministry in charge of water management [14].
The improvement these years in the access to safe drinking water in the country, focused mainly on the quan- titative aspect through the reinforcement of the infra-structures of water supply [13]. However, beyond the quantitative aspect, it is also advisable to take considera-tion on the quality of water consumed by populaconsidera-tions.
In the Sourou valley, populations fed on water from drillings, modern and traditional wells, and from the sur-face water of the Sourou River as well (Figures 2(a)-(e)) [17,40]. As revealed the data recorded, if some drillings (60% of those examined) provide safe drinking water, in contrast, other drillings (40%) deliver water with either high nitrates [10] or sulfates concentrations over the guideline values [11,12,20-22]. Moreover, water from all the wells examined (100%) was microbiologically pol-luted (Table 4).
Field investigations revealed some factors contributing to the non-achievement in the access to safe drinking wa- ter for populations in the Sourou valley.
5.4.1. The Non-Regular Control of Water Quality
If in urban environment, distributed water is the object of regular control, it is not the case in rural environment where the indicators of drinking water quality are miss-ing due to the lack of analytical data. For all the drillmiss-ings examined in the study, no report attesting the quality of water provided by the hydraulic realization prior to populations’ utilization was found. This situation illustrates clearly a lack of control during the realization of drillings.
As a consequence, some drillings are providing unsafe drinking water to populations. Moreover, although the APIWRM recommended the installation of national net-works to monitor water quality, water uses, water requests and health risks, such operational structures remain to be created.
In line with this gap and to meet the recommendation of APIWRM [7,18], the present study intends to improve the knowledge related to the quality of drinking water resources in the Sourou basin [15-19].
5.4.2. The Lack of Self-Management of
Infrastructures for Drinking Water Supply
During field investigations, several drillings were found broken down and not repaired. According to Ouédraogo
[43], this apparent indifference in the water resource ma- nagement, could be related to the fact that water is free and in addition, the hydraulic realization is a donation of government or NGO. Therefore, populations are just wait- ing for the donators to repair.
Such situation was well illustrated during the cam-paign of drillings restoration by the COPROD, one action of the Sourou river contract. Within this framework, a hundred broken down drillings were repaired but some were broken down again after a few months and were never been repaired by the populations [16]. This nega-tive perception of self-water resource management by populations could be in line with a lack of education and sensitization. These gaps can be overcome, since primary school through the sensitization for an efficient integra- ted water resources management [16]. Unfortunately, such pedagogic activities are relatively scarce in Burkina Faso, although the intention is underlined in the APIWRM ac-tion plan [7].
5.4.3. Socio-Cultural Considerations
During samples collection, one remarkable observation was that water sources are mainly frequented by women and children (Figures 2(a) and (d)). This situation is re-lated to the socio-cultural context, for which these frac-tions of the population are mainly in charge of household chores [19].
Moreover, wells appeared much more frequented than drillings for drinking water gathering in some villages (Figure 2(c)). As revealed investigations from water users, collecting water from wells gives opportunity to exchan- ge on social and current events than drillings can afford [23].
For populations of villages located on the Sourou River, only the surface water is used for their alimentation (Figure 2(e)). All efforts from local authorities encour- aging these populations to leave the unsafe environment were unsuccessful. This attitude in line with traditional believes leads these populations to consume unsafe water exposing them to waterborne diseases as revealed pre- vious investigations in the zone [17,40-42].
5.4.1. The Lack of Hygiene and Basic Sanitation
In developing countries, the lack of hygiene and basic sanitation is still among the main factors limiting the access to safe drinking water for rural populations, de- spite efforts at international and national levels to pro- vide water facilities. In addition to the factors limiting safe drinking water access evoqued above, the absence of disinfecting methods of drinking water in household should be also evoqued [44-47]. It has also been indi- cated that even do for water distribution networks, the duration of water storage in pipe, temperature variations and pipe materials can lead to bacterial proliferation in
water collected in household from water pump [48,49]. Although we didn’t examine the quality of drinking water in households, field observations supported a poor microbial quality of water from drillings in households as revealed the aspects of water collecting and storing ma- terials (Figure 2(a)) and the method of water transporta- tion to household (Figure 2(f)). The conesquences of such practices and attitudes on the quality of drinking water were highlighted in previous studies [44,50].
5.5. Some Issues to Improve Drinking Water Quality and Access in the Sourou Valley
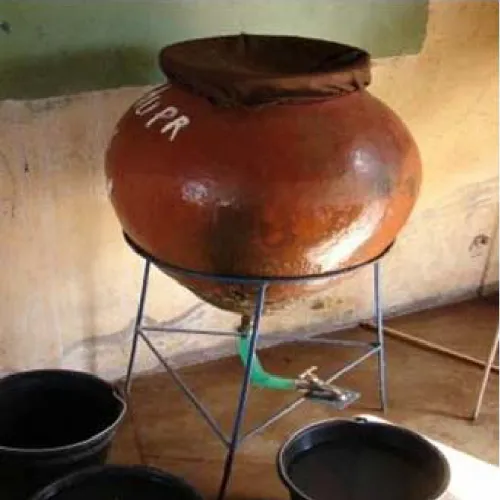
In line with the limited safe drinking water access for populations in the Sourou valley, the OXFAM Belgique in collaboration with the Water Unit of Liège University and the Rotary Club Burkina Faso undertook to equip school classes with a local material-based technology (Figure 4) for preserving drinking water safety for school children. Over improving drinking water quality, these actions contributed to the fight against poverty through a financial support to local associations in charge of setting the technology design. Although the analysis of water is-
sued from the disposal showed a rather good quality at microbiological level (data not shown), some improve- ment of the technology is needed to obtain a safe drinking water in line with the guideline standards [11,12,20-22].
Investigations using local plant material (grains of Moringa oleifera) to improve the quality of some surface waters and water from wells which feed the populations in the Sourou valley are currently performed [47]. These investigations, the ones in RDC Congo [45,46] and the outputs from previous studies in Burkina Faso [44,50] may help improving the quality of drinking water for rural populations in Sub-Saharan developing countries.
Beyond these direct actions intending to improve the quality of drinking water, it is also advisable within the framework of an integrated approach, to develop preven- tive measures at land management and soil occupation nearby water sources, and at hygiene and basic sanitation levels as well.
Therefore, the construction of protection zones around drinking water sources, the promotion of hygiene-based rules and the installation of bottom-tight latrines could help improving drinking water quality for rural popula-tions in the Sourou valley and in developing countries.
Figure 4. Technology based on local material experienced in schools of the Sourou valley for the preservation of safe drinking water quality.
6. Conclusions and Prospects
Access to safe drinking water for rural populations in the Sourou valley is still facing the optimization of water re- sources management. The lack of an efficient network of water quality survey and a self-management of drinking water sources facilities, the inertia of mentalities and tra- ditional believes appear the main constraints governing this problematic in the Sourou valley. To overcome these constraints, information and sensitization actions on wa-ter resources management and on wawa-ter and health rela-tionships are required. This approach involves pedago- gic aspect and should therefore be performed in collabo-ration with school teachers, focusing children and wo- men the main actors at the center of the problematic.
In addition, scientific expertise, through improving knowledge on water resources quality and providing ap-propriate methods for water disinfection in households could help solving the problematic. Moreover, an integ- rated approach which associates water and land mana- ments could allow setting preventive measures for the protection of drinking water sources in the Sourou valley.
Overall, these proposed issues for improving the ac- cess to safe drinking water for populations must be pro- vided to the institutions in charge of the water policy and to the local collectivities, which within the framework of the decentralization, were seen entrusted the responsibi- lity for the natural resources management. It is also ad- visable that local participating structures as the Local Water Committees (LWC) catch these problems in order to improve the water services in response to the popula- tions needs with respect to the national and international standards of drinking water.
6. Acknowledgements
The authors would like to express profound gratitude to the Walloon Region of Belgique, University of Liège, CNRST/IRSS, INERA-Di, COPROD, LNAE and Tou- gan Hospital for providing financial support, laboratory and other facilities.
REFERENCES
[1] World Health Organization, “Guidelines for Drinking Water Quality,” 3rd Edition, World Health Organization, Geneva, 2008.
[2] United Nations Development Programme, “Burkina Faso: Access to Safe Drinking Water Has Improved a Lot,” 2010.
[3] United Nations Environment Program, UNEP, “The Pro- blematic of Water in the Democratic Republic of Congo,” Technical Report, 2011.
[4] K. G. R. Kouam, H. G. Mpakam, S. A. Ndonwy, S. L. D. Bopda and G. E. Ekodeck, “Integrated Management of Water Resources and Millennium Development Goals for
the Development of Africa: Case study of Cameroun,”
Vertigo, 2006, Vol. 7, No. 2, pp. 1-9.
[5] F. Julien, “Water Control and Sustainable Development in West Africa: A Need of a Regional Cooperation on the Trans-Boundaries Hydrologic Systems,” Vertigo, Vol. 7, No. 2, 2006, pp. 1-18.
[6] D. J. H. Phillips, M. Daoudy, S. C. McCaffrey and A. J. R. Öjendal, “Trans-Boundary Water Cooperation as a Tool for Conflict Prevention and Broader Benefit Sharing,” Swedish Ministry of Foreign Affairs, Stockholm, 2006, p. 249.
[7] Ministry of Agriculture, “National Action Plan for Inte-grated Water Resources Management (APIWRM),” Hy-
draulics and Fishing Resources, Ouagadougou, 2003, p.
62.
[8] Ministry of Water, “Leaflet of the Hydrogeological Map of Burkina Faso, Scale 1:500,000, Sheet Bobo-Dioulas- so,” Direction of Hydraulics Resources Inventory, 1993, p. 40.
[9] Ministry of Agriculture,“Conception Plan and Implemen- tation of the National Water Information System,” Direc-
tion of Hydraulics Resources Inventory, Hydraulics and Fishing Resources, 2004, p. 135.
[10] Ministry of Agriculture, “National Program of Drinking Water and Sanitation Supply for the 2015 year issue (NP- DWSS2015),” Direction of Hydraulics Resources Inven-
tory, Hydraulics and Fishing Resources, 2006, p. 43.
[11] Ministry of Water and Environment, “Decree n 2001-185/ PRES/PM/MEE, Fixing the Standards of Pollutants in Air, Water and Soil,” 7 May 2001.
[12] World Health Organization, “Guidelines for Drinking Wa- ter Quality,” Third Edition, Geneva, 2004.
[13] United Nations, United Nations Development Programme, “Access to Safe Drinking Water,” 2010.
[14] Ministry of Agriculture, “IWRM 2010 and 2011 Perspec-tives,” Hydraulics and Fishing Resources, Ouagadougou, 2011, p. 29.
[15] F. Rosillon, B. Savadogo, A. Kaboré, H. Bado-Sama and D. Dianou, “Attempts to Answer on the Origin of the High Nitrates Concentrations in Groundwaters of the Sourou Valley in Burkina Faso,” Journal of Water Resource and
Protection, Vol. 4, No. 8, 2012, pp. 663-673.
doi:10.4236/jwarp.2012.48077
[16] F. Rosillon, B. Savadogo, A. Kaboré, H. Bado-Sama and D. Dianou, “Estimation of the Nitrates Contents in Waters by Using Reagent Strips: An Environment Education Exercise in the Sourou Valley in Burkina Faso,” Vertigo, Vol. 12, No. 2,
[17] D. Dianou, B. Savadogo, D. Zongo, T. Zougouri, J. N. Poda, H. Bado and F. Rosillon, “Surface Waters Quality of the Sourou Valley: The Case of Mouhoun, Sourou, Debe and Gana Rivers in Burkina Faso,” International
Journal of Biological and Chemical Sciences, Vol. 5, No.
4, 2011, pp. 1571-1589.
[18] Ministry of Agriculture, “IWRM 2010 and 2011 Perspec- tives,” Hydraulics and Fishing Resources, Ouagadougou, 2011, p. 29.
![Figure 1. Map showing the catchment area of the Sourou valley and the zone covered by the river contract [19]](https://thumb-eu.123doks.com/thumbv2/123doknet/6697106.184024/3.892.86.807.467.1067/figure-showing-catchment-sourou-valley-covered-river-contract.webp)

![Figure 3. Location of sampling sources within the zone covered by the river contract in the Sourou valley [19]](https://thumb-eu.123doks.com/thumbv2/123doknet/6697106.184024/5.892.130.757.417.1063/figure-location-sampling-sources-covered-contract-sourou-valley.webp)