Third International Conference on Buckling and Postbuckling behanvior of Composite Laminated Shell Structures, March 25-27, 2014, Braunschweig, Germany
PROGRESSIVE DAMAGE MODELING IN COMPOSITE:
FROM AEROSPACE TO AUTOMOTIVE INDUSTRY
J.P. Delsemme 1, M. Bruyneel 1, Ph. Jetteur 1, B. Magneville 2, T. Naito 3, Y. Urushiyama 3
1
SAMTECH (A Siemens Company) Liège, Belgium 2
SAMTECH (A Siemens Company) Toulouse, France 3
Honda R&D, Tochigi, Japan
Keywords buckling, progressive damage, delamination, intra-laminar, finite element, SAMCEF
Abstract
In this paper we will review the progressive damage modeling implemented in finite element code SAMCEF.
Starting from simplified formulations used during the European projects COCOMAT and ALCAS with main results of panel buckling, post-buckling and also skin-stringer separation and ply failure, the results of more advanced models recently obtained in cooperation with Honda R&D will be presented. These models rely on better understanding of progressive damages and specially the shear behavior of UD ply. In a second time, a detailed description of that model and parameter identification procedure will be given. Finally, some industrial applications will be presented.
1 Introduction
One of the main goals of COCOMAT1 project was to demonstrate the possibility to simulate thin walled structure in compression not only up to buckling and post-buckling but also taking into account material degradation. This possibility increases the load-carrying capacity and helps to make lighter structures.
To achieve this goal, several progressive damage models inspired by work done by Ladevèze et al. at LMT Cachan (Ref. 2-8) have been implemented in the FE code SAMCEF (Ref. 9-12). Depending on the model complexity, several parameters are needed. The simplest model requires only the material allowable
stresses (i.e. strengths in traction/compression in fiber and transverse direction, allowable in shear). The more sophisticated model requires more data and in particular for shear behavior a non-linear damage evolution function of thermo dynamical force is needed.
An interface element has also been developed to simulate delamination and skin-stringer separation. For that element, specific material laws are available. They require material parameters like critical energy release rates and local stiffness. That kind of simulation will not be discussed here.
During COCOMAT and ALCAS projects, several test cases have been analyzed with the simplified model. They will be briefly presented here after. In more recent works, in cooperation with Honda R&D, new studies have been carried-out. The goal was to characterize basic material parameters like elastic properties and allowable stress but also
advanced parameters like nonlinear evolution of damage in shear. Identification procedure used for that latter parameter will be described here after. Finally some results obtained with these parameters will be presented.
2 Intra-laminar damage modeling
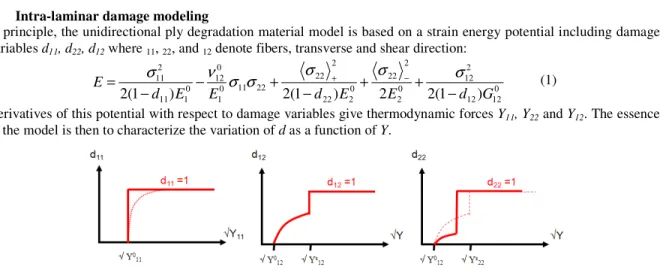
In principle, the unidirectional ply degradation material model is based on a strain energy potential including damage variables d11, d22, d12 where 11, 22, and 12 denote fibers, transverse and shear direction:
0 12 12 2 12 0 2 2 22 0 2 22 2 22 22 11 0 1 0 12 0 1 11 2 11 ) 1 ( 2 2 ) 1 ( 2 ) 1 ( 2 d E E d E E d G E − + + − + − − =
σ
ν
σ
σ
σ
+σ
−σ
(1)Derivatives of this potential with respect to damage variables give thermodynamic forces Y11, Y22 and Y12. The essence
of the model is then to characterize the variation of d as a function of Y.
Figure 2: Example of evolution of damage variables as a function of thermodynamic forces
Figure above shows example of damage evolution functions. In the fiber direction, the failure is fragile and d11 steps from 0 to 1 according to a threshold that is related to maximum stress in traction or compression. The shear behavior is more complex, it is related to several phenomena like matrix failure, fiber-matrix de-cohesion; a coupling with transvers direction is also observed. If function g11(Y11) giving damage d11 is a single step, function g12(Y12) giving damage d12 is non-linear. Identification of this function will be shown in paragraph 4, detail description of material parameters can be found in Ref. 12.
The damage onset is most of the time sudden. In order to smooth the damage evolution, a delay effect is introduced as described by the equation below:
[
− − − +]
= agY d c e d 1 1 ( ) τ (2)The delay effect requires a new parameters τc that is not an intrinsic material property, it is a numerical free parameter and its influence must be tested to validate analysis results. It is generally taken as a fraction of the minimum analysis time step.
3 First results: panel buckling and post-buckling simulation in ALCAS project.
During ALCAS project, a real test panel was analyzed with the simplified model. The panel was 2700 mm high, 1100 mm wide, and had a radius of curvature of 1900 mm. It was stiffened by 3 stringers made of CFRP and 4 aluminum frames. The skin had 12 plies and a total thickness of 2.21mm. See Figure 3 or read full description in Ref. 13. To perform buckling and post-buckling analysis one must pay attention to convergence problem. A lesson learned from the project is that we must add some damping proportional to the stiffness. Figure 3 shows that a too high value increases the maximum load. A smaller value doesn't influence the maximum load but increases the computation time. For interface element, the maximum stress in traction can also influence the maximum load. This parameter is not an intrinsic material parameter and must be adjusted based on a DCB test simulation.
Influence of damping 0 200 400 600 800 1000 1200 0 2 4 6 8 10 Displacement [mm] F o rc e [ k N ] damping 0.01 damping 0.001 damping 0.0001
Max. Normal Stress
500 600 700 800 900 1000 4 5 6 7 8 9 Displacement [mm] F o rc e [ k N ] Linear max. Szz=3 N/mm2 max. Szz=4 N/mm2
Figure 3 : Panel used in ALCAS project, load-displacement curve, influence of simulation parameters
4 Identification of stress–strain behavior in shear for a UD ply.
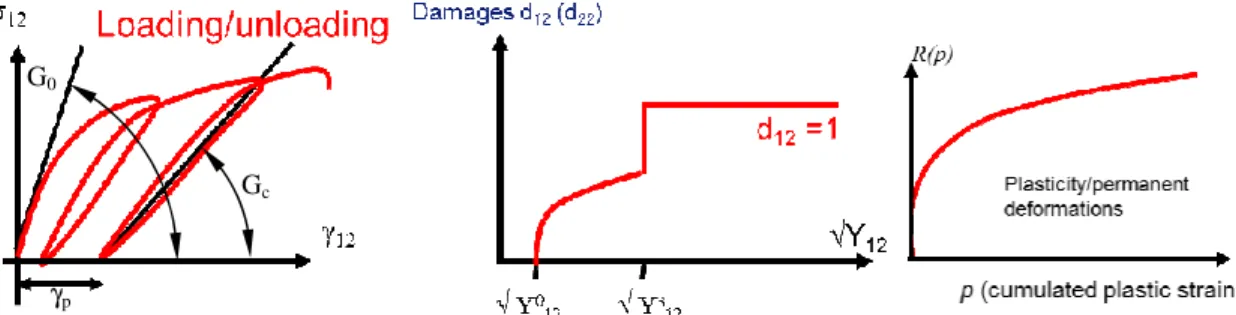
To identify the stress-strain relation in shear it can be shown from CLT that a test on [+45,-45] specimen must be carried out. Figure 4 shows a typical curve, one can see the softening due to the damage onset. At a given point, if the specimen is unloaded, we observe an average elastic line that has a smaller slope than the original one. According to the continuum damage mechanics theory, this is due to the damage d12 such as Gc = (1-d12) G0. If we repeat the procedure for several points one can obtain the nonlinear curve: d12 = g12(Y12). Figure 4 also shows the typical g12 function. Remark that below a critical threshold Y012 there is no damage and above YS12 the damage jumps to 1. One more time, at that point, the delay effect (eq. 2) can help facilitate the transition.
In the stress-strain curve, one can also see a residual strain γp after unloading. In the material model this plasticity is taken into account by a classical power lawf(σ~,p)= σ~122 +aσ~222 −R0−Kpγ. That introduces 4 new parameters to adjust. The complete description of the identification procedure can be found in Ref. 12.
5 Industrial application: three points bending of a composite box.
To validate the model and adjusted parameters several test-case have been analyzed. The simulation results have been compared to test results obtained by Honda R&D. The test here is a 3 points bending of a composite box with a squared hollow section. The size of the beam is 100×100×600 mm and the distance between supports is to 500 mm. The beam is made of UD carbon plies and several stacking have been
tested up to 16 plies. The zone of interest is of course the central section where the bending moment is maximum. For that reason, the FE model contains a mix of shell elements and solid elements. To be able to simulate delamination in the central section, the model contains one solid element per ply joined by interface elements. In the experiment, the load is introduced by 3 metallic cylinders, in the FE model they are supposed to be rigid cylindrical surfaces. Figure 5 shows the FE model and load introduction device.
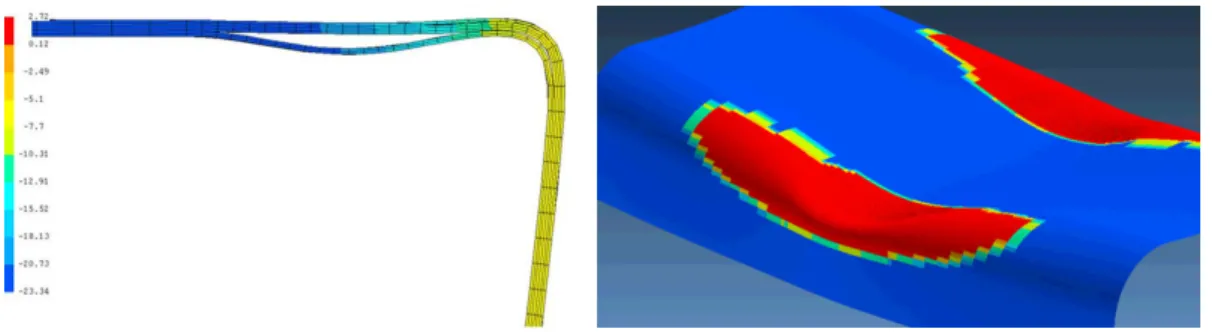
Nonlinear static analyses were run with an automatic increment size until convergence failure. Figure 6 shows a typical final deformed shape and a typical Load – displacement curve. The analysis doesn't allow predicting deep post failure behavior but a fine analysis of degradation onset shows that first delaminations and ply failures can be predicted. First delamination load have been compared to sound in the video record and slope change in the load-displacement curve.
Figure 7 shows a typical delamination observed in the central region that is similar to those observed by Honda in tested specimens.
Figure 4: Typical Stress–Strain curve for shear 1-2, nonlinear evolution of d12 function of Y12, typical hardening law
γp
Gc G0
Figure 5: FE model
6 Conclusions
During the past few years, a lot of improvements have been introduced in SAMCEF to simulate composite material degradation simulation. Thanks to COCOMAT project, several phenomena have been simulated like panel buckling and post-buckling as well as skin stringer separation and ply degradation. More recently, progressive damage simulation has been improved taking into account nonlinear damage growth and plasticity. Material parameter identification has been explored and a comprehensive procedure has been setup. Finally, the whole approach has been validated on several test cases.
References
1. R. Degenhardt, R. Rolfes, R. Zimmermann, K. Rohwer, COCOMAT - Improved MATerial Exploitation at Safe Design of
COmposite Airframe Structures by Accurate Simulation of COllapse, Composite Structures, Vol. 73 (2006) pp. 175-178.
2. Ladeveze P., and Le Dantec S. Damage modeling of the elementary ply for laminated composites, Composites Science and
Technology, 43, 1992.
3. Ladevèze P. and Lubineau G. On a damage mesomodel for laminates : micro-meso relationships, possibilities and limits.
Composites Science and Technology, 61, 2149–2158, 2001.
4. Allix O. and Ladevèze P. Interlaminar interface modelling for the prediction of laminate delamination, Composite Structures,
22, 235-242, 1992.
5. Allix O., Lévêque D. and Perret L. Interlaminar interface model identification and forecast of delamination in composite
laminates. Comp. Sci. Techn. 56, 671-678, 1998.
6. Ladevèze, P. et al. A Computational Method for damage Intensity Prediction in a Laminated Composite Structure,
Computational mechanics—New Trends and Applications In: Idelsohn, S., Oñate E., and Dvorkin E., (eds.) CIMNE, Barcelona, Spain, 1998.
7. Abisset E. Un mésomodèle d’endommagement des composites stratifiés pour le virtual testing: identification et validation,
PhD Thesis, ENS Cachan, France, 2012.
8. Lubineau G. and Ladeveze P. Construction of a micromechanics-based intralaminar model and illustrations in Abaqus
standard, Computational Materials Science, 43(1), 137-145, 2008.
9. Brauner C., Delsemme J.P. Jetteur Ph., Bruyneel M., and Kuhlmann G. Non linear failure analysis of a reinforced composite
curved beam with delamination and ply degradation, NAFEMS World Congress, 16-19 June 2009, Crete, Greece.
10. Bruyneel M., Delsemme J.P., Jetteur Ph. and Mertens T. Recent results in damage modelling of composites, NAFEMS World
Congress, May 23-26, 2011, Boston, USA.
11. Bruyneel M., Delsemme J.P., Jetteur P., Germain F. Modeling inter-laminar failure in composite structures: illustration on an
industrial case study, Applied Composite Materials, 16(3), 149-162, 2009.
12. M. Bruyneel, J.P. Delsemme, A.C. Goupil, P. Jetteur, C. Lequesne, T. Naitod, Y. Urushiyamad, Damage modeling of
laminated composites: Validation of the Intra-laminar law of SAMCEF at the coupon level for UD plies, ECCM16 - 16TH
European Conference On Composite Materials, Seville, Spain, 22-26 June 2014
13. J-P. Delsemme, C. Brauner, M. Bruyneel, P. Jetteur, Simulation of Stiffened Composite Panel Buckling Considering Ply
Degradation and Skin-Stringer Separation, SAMPE Europe SEICO 10, Int. Conf. Paris.