The Canadian Public Venture Capital Market
34
0
0
Texte intégral
(2) CIRANO Le CIRANO est un organisme sans but lucratif constitué en vertu de la Loi des compagnies du Québec. Le financement de son infrastructure et de ses activités de recherche provient des cotisations de ses organisations-membres, d’une subvention d’infrastructure du Ministère du Développement économique et régional et de la Recherche, de même que des subventions et mandats obtenus par ses équipes de recherche. CIRANO is a private non-profit organization incorporated under the Québec Companies Act. Its infrastructure and research activities are funded through fees paid by member organizations, an infrastructure grant from the Ministère du Développement économique et régional et de la Recherche, and grants and research mandates obtained by its research teams. Les partenaires du CIRANO Partenaire majeur Ministère du Développement économique, de l’Innovation et de l’Exportation Partenaires corporatifs Banque de développement du Canada Banque du Canada Banque Laurentienne du Canada Banque Nationale du Canada Banque Royale du Canada Banque Scotia Bell Canada BMO Groupe financier Caisse de dépôt et placement du Québec DMR Fédération des caisses Desjardins du Québec Gaz de France Gaz Métro Hydro-Québec Industrie Canada Investissements PSP Ministère des Finances du Québec Power Corporation du Canada Raymond Chabot Grant Thornton Rio Tinto Alcan State Street Global Advisors Transat A.T. Ville de Montréal Partenaires universitaires École Polytechnique de Montréal HEC Montréal McGill University Université Concordia Université de Montréal Université de Sherbrooke Université du Québec Université du Québec à Montréal Université Laval Le CIRANO collabore avec de nombreux centres et chaires de recherche universitaires dont on peut consulter la liste sur son site web. Les cahiers de la série scientifique (CS) visent à rendre accessibles des résultats de recherche effectuée au CIRANO afin de susciter échanges et commentaires. Ces cahiers sont écrits dans le style des publications scientifiques. Les idées et les opinions émises sont sous l’unique responsabilité des auteurs et ne représentent pas nécessairement les positions du CIRANO ou de ses partenaires. This paper presents research carried out at CIRANO and aims at encouraging discussion and comment. The observations and viewpoints expressed are the sole responsibility of the authors. They do not necessarily represent positions of CIRANO or its partners.. ISSN 1198-8177. Partenaire financier.
(3) The Canadian Public Venture Capital Market Cécile Carpentier * , Jean-Marc Suret † Résumé / Abstract Nous décrivons et analysons l’utilisation d’un marché boursier pour le financement d’entreprises émergentes, alors que ce rôle est généralement dévolu aux investisseurs en capital de risque (le capital de risque privé). Le taux de succès de ce marché public de capital de risque Canadien est prés de quatre fois supérieur à celui mesuré pour le marché privé. Au Canada, le marché public amène sept fois plus de nouvelles inscriptions sur le marché principal, le TSX, que ne le fait le capital de risque privé. Pour un horizon de cinq ans, le taux de disparition des entreprises nouvellement inscrites sur la Bourse de croissance est beaucoup moindre que le taux d’échec rapporté par le capital de risque. Enfin, le rendement du marché public est largement supérieur à celui du marché privé du capital de risque. Nous en déduisons que le marché public du capital de risque est parfaitement capable de concurrencer le marché privé, même s’il ne dispose pas des outils, habiletés et moyens d’ajout de valeur que l’on associe généralement au capital de risque conventionnel. Mots clés : Capital de risque, petites et moyennes entreprises, marché boursier, Canada, réglementation des valeurs mobilières, politiques publiques.. We describe and analyze how a stock exchange can be used to finance emerging companies and to assume the role usually played by private VCs. We find that the Canadian public VC market has a success rate which is approximately four times the corresponding rate for private VC. The public VC market provides approximately seven times as many new listings to the main market as private VCs. For a five-year horizon, the delisting rate of newly listed companies is much lower than the failure rate observed for the private VC sector in Canada. Finally, the comparison of the returns shows that the public VC market outperforms the private one. We conclude that a public VC market is indeed able to compete with a private one, even if it does not have the tools, skills and value added capabilities usually attributed to private VCs. Keywords: Venture Capital, small business, stock market, Canada, securities. regulation, public policy.. *. Professor, Laval University and CIRANO Fellow, Faculty of Administrative Science, School of Accountancy, Pavilion Palasis-Prince, 2325 de la Terrasse, Laval University, Québec (Québec) Canada, G1V 0A6, phone: (418) 656-2131 # 6385, fax: (418) 656-7746, email: Cecile.Carpentier@fsa.ulaval.ca. † Professor, Laval University and CIRANO Fellow, Faculty of Administrative Science, School of Accountancy, Pavilion Palasis-Prince, 2325 de la Terrasse, Laval University, Québec (Québec) Canada, G1V 0A6, phone: (418) 656-7134, fax: (418) 656-7746, email: Jean-Marc.Suret@fsa.ulaval.ca..
(4) INTRODUCTION Venture capital (VC) is typically associated with the private placement of equity or quasi-equity by specialized institutional investors. For Gompers and Lerner (2001, p.155), “specialized financial intermediaries, such as venture capital organizations, can alleviate the information gaps, which allows firms to receive the financing that they cannot raise from other sources.” VC investors have developed methods, expertise and tools to screen, fund, advise and monitor the most promising ventures. Even if some of them act as business angels, individual investors are generally not associated with VC activities. This is probably because, as Fenn et al. (1996, p.1) note, “few investors had the skills necessary to invest directly in this asset class, and those that did found it difficult to use their skills efficiently.” Accordingly, a public VC market, where individual investors finance emerging companies, should not succeed or even survive. In Europe, several countries have implemented new (or junior) stock markets, devoted to the financing of growing companies. They apply more lenient listing rules and often do not require profitability. To be listed, companies must meet the minimal listing requirements that exclude nascent companies. These junior markets are commonly used as an exit vehicle by private VC providers, and are generally considered as failures (Bottazzi and Da Rin 2002). This verdict is consistent with the proposition that public markets are not well suited for financing growing companies, even if these companies are no longer in the early stage of development. In this context, the creation of a public VC market devoted mainly to early stage companies can be considered an unrealistic objective. Nonetheless, this type of market has long been active in Canada. To our knowledge, the TSX Venture Exchange (TSXV) is the only public VC market in the world. Although one might argue that the London Alternative Investment Market (AIM) and First North in the Nordic countries could claim this status because they apply principle-based listing standards instead of quantified minimum listing requirements, firms listed on the AIM are very similar to those listed on the main Canadian stock market, the Toronto Stock Exchange (TSX). On First North, the mean market capitalization and initial public offering (IPO) gross proceeds represent respectively four and ten times those observed on the TSXV. The Canadian situation provides a unique opportunity to analyze the extent to which a public VC market can stimulate the success of emerging businesses while mitigating the multiple. 1.
(5) consequences of the large asymmetry of information prevailing in this type of financing. This situation also allows us to compare the outcome of two approaches to growing business finance. The TSXV is totally free of public policy grants and advantages, while the VC market is heavily distorted by generous public policies, in particular the Labour-sponsored VC fund program, which represents approximately half of the Canadian VC activity during the period examined (Cumming and MacIntosh 2007). This chapter describes and analyzes how a stock exchange can be used to finance emerging companies and to assume the role usually played by private VCs. We find that this public VC market has a success rate which is approximately four times the corresponding rate for private VC. The public VC market provides approximately seven times as many new listings to the main market as private VCs. For a five-year horizon, the delisting rate of newly listed companies is much lower than the failure rate observed for the private VC sector in Canada. Finally, the comparison of the returns shows that the public VC market outperforms the private one. We conclude that a public VC market is indeed able to compete with a private one, even if it does not have the tools, skills and value added capabilities usually attributed to private VCs The rest of the chapter is organized as follows. In the following section, we analyze the public VC market from a conceptual perspective and evidence the large differences between the public and the private approach to VC. The various mechanisms new firms use to enter the TSXV and to raise successive financings are described in Section 3. We also summarize, in this section, the main characteristics of the newly listed companies. In Section 4, we study the results of this experimentation, both in terms of failures and successes (graduation to the main exchange). In Section 5, we compare the rate of return of the public and the private VC markets in Canada. The last section is devoted to discussion of the lessons of the Canadian experimentation in terms of regulation, public policy and financing strategy for growing firms. DESCRIPTION AND CONCEPTUAL ANALYSIS OF THE SITUATION The Canadian stock market and venture capital market In Canada, nascent companies wishing to obtain equity finance after the seed money stage of development can choose between two paths, as illustrated in Figure 1. The first option is to turn to the Canadian classic VC market, which is generally considered the third largest in the world in terms of available funds. The second path is the TSXV, the public VC market. At the entrance, 2.
(6) subsequent rounds of financing and exit stages, both markets present similarities. Newly created companies with no history or sales are allowed to list on the TSXV because of very lenient listing requirements. They can enter the market using a Reverse Merger (RM) on a public shell, an IPO or a Capital Pool Company (CPC). The CPC program has been implemented in Canada as a clone of the U.S. blind pool program, to help emerging companies access the stock market. Similar to the classic VC market, the TSXV offers several equity financing avenues. In both markets, investors can provide subsequent rounds of financing. Private placements are also commonly used by the TSXV listed companies. Lastly, just as the most profitable exit for classic VCs is an IPO, the objective of the TSXV is to graduate its best performers to the TSX. **Insert Figure 1 about here** In addition to the TSX and the TSXV, there are two secondary and more recently created markets: the NEX and the Canadian National Stock Exchange (CNSX). 1 There were 1,578 issuers listed on the TSX and 2,261 issuers listed on the TSXV at November 30, 2008. The main market itself is equivalent to the London AIM in terms of characteristics of listed companies, and can be considered a market devoted to growing companies (Rousseau 2006). All but the largest 245 companies on the TSX are small or micro capitalization companies according to Nicholls (2006, p.160). A leading law firm in the country considers that the AIM and the TSX offer “a real exit for mature companies not ready for the pros.” 2 The TSXV aims to feed this market. This creates an original situation where a junior market is fed by a public VC market whereas in most countries, the conventional VC market is the natural feeder of the junior exchange. The TSXV 3 calls itself a “public venture market.” Kevin Strong, the manager of the Winnipeg Office of the TSXV, describes this market as a “national market for publicly traded venture companies offering venture companies and their investors a quality, liquid and efficient 1. CNSX, formerly known as the Canadian Trading and Quotation System inc. (CNQ), listed 100 securities in November 2008 (see: www.cnsx.ca). NEX is a separate trading board of TSXV where firms that do not fulfill the ongoing listing requirements are moved. According to NEX’s website: “NEX issuers have the opportunity to refinance, reactivate or reinvent themselves in order to re-apply to TSX Venture Exchange provided they can evidence their compliance with TSX Venture Listing Requirements.” 2 See Eric M Levy, Heenan Blaikie LLP, Alternative Capital Markets for U.S. Issuers: TSX and AIM, at http://www.abanet.org/buslaw/committees/CL650000pub/materials/goingpublic.pdf 3 We use the term TSXV to refer to this exchange and its predecessors. In 2001 the TSX Group acquired and renamed the Canadian Venture Exchange (CDNX), previously created by the merger, in 1999, of the Alberta and Vancouver Exchanges. In 2001, the Montreal Exchange opted to specialize in derivatives, and transferred its small capitalization securities to the CDNX.. 3.
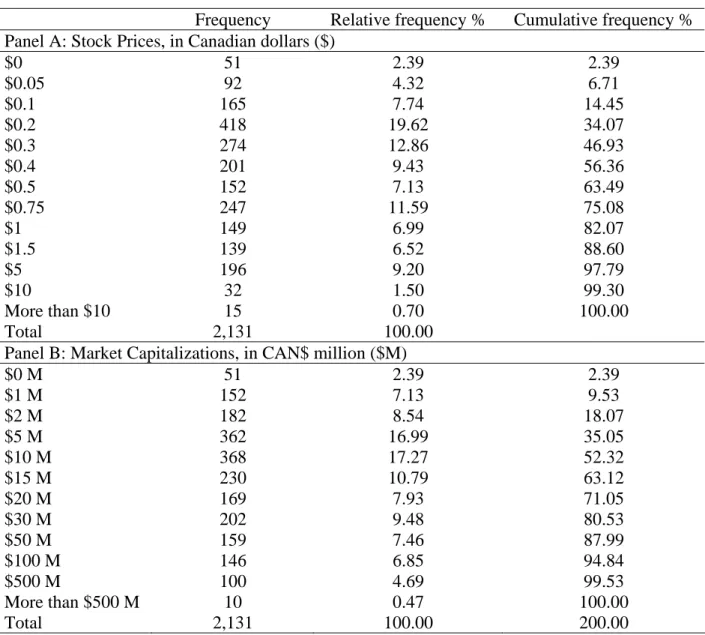
(7) environment for capital raising and investing,” and “a fully-regulated national stock exchange that exists to improve access to capital and provide public company experience and mentorship to emerging companies prior to graduation to a senior stock exchange.” Notably, the TSXV aims to provide the management of newly public companies with mentoring and streamlined graduation to the TSX. 4 This exchange has very low initial and ongoing listing requirements. New companies can list with no revenues. Their stock price should be higher than CAN$0.15, and their minimum net tangible assets, including the IPO proceeds, have been set at CAN$500,000 or CAN$750,000 depending on the period. 5 If we apply the definitions of small and micro caps stated by the Advisory Committee on Smaller Companies (SEC 2006), about 98% of the TSXV companies could be considered micro capitalization companies (Nicholls 2006). The TSXV lists a large number of resources companies, a sector in which VC involvement is traditionally low. It is generally assumed that over 50% of the world’s traded mining companies are listed on one of the two main Canadian Exchanges, and resources companies represent approximately 50% of the new listings on the TSXV. In this sector, the listing requirements are minimal. For a Tier 2 listing, an Exploration Company should have spent at least CAN$100,000 in the past three years, must have geologic merit and a planned work program valued at CAN$200,000 or more. At the time of listing, the company must have sufficient funds to carry out the planned work program plus meet all required property or option payments and general and administrative costs for 12 months. No requirements apply to net tangible assets. The consequences of these very low listing requirements are illustrated in Table 1, where we report the distribution of stock prices and market capitalization at the end of 2006. Accordingly, this table illustrates that more than 82.07% (97.79%) of TSXV-listed stocks trade at prices lower than one (five) dollars, and 80.53% of TSXV firms have a market capitalization lower than CAN$30 million. **Insert Table 1 about here** The large relative weight of resources companies is probably a partial explanation for the growth of this public VC market in Canada. Classic VCs generally do not invest in natural resources, and 4. See http://www.tsx.com/en/pdf/TSXVentureSuccessStories.pdf To list on NASDAQ from June 1999 to June 2001, a company had to post a stock price higher than US$4, shareholders’ equity of US$4 million and market capitalization of US$5 million at least. 5. 4.
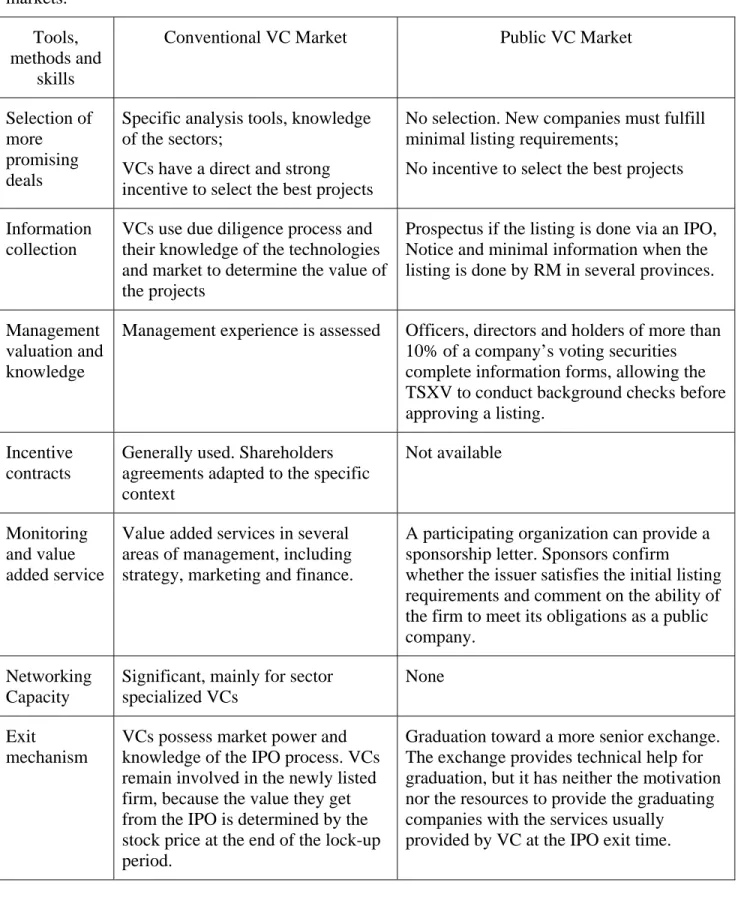
(8) the public market could be required to obviate the lack of equity financing for this sector. However, the Canadian situation can also be attributed to the inefficiency of the conventional VC market, largely influenced by public policies promoting poorly designed Labour-Sponsored VC funds (Cumming and MacIntosh 2006; Cumming and MacIntosh 2007). In consequence, the stock market has been largely used as a substitute for the VC market. As Cumming (2006, p.221) notes, “the comparatively lower quality of Canada’s VC market gives rise to a need for Canadian companies to access public capital markets earlier than their counterparts in the U.S.”. In Canada, new business financing provided by the public VC market has largely exceeded that provided by the private market since 2002, as illustrated in Figure 2. **Insert Figure 2 about here** Most of the theoretical research devoted to venture capitalists (VCs) concludes that a public VC market could not succeed in the long run. The next section explains why. Why a public VC market should not succeed Several theoretical arguments assert that the development of new ventures through a stock market is not feasible, consistent with the evidence provided by experimentation with new markets in Europe. A stock market and individual investors have neither the tools nor the capacity to resolve the agency and asymmetric information problems associated with new and growing businesses. As Amit et al. (1998) posits, information asymmetries are the key to understanding the VC industry. To circumvent these asymmetries, VCs have developed particular tools and methods, which are briefly presented in Table 2 along with the equivalent (if any) in the public VC market. The first, and perhaps most significant, difference between the private and the public market lies in the screening of venture projects. A stock market with listing requirements based on minimal quantitative benchmarks cannot perform a due diligence review of listing candidates. All firms fulfilling the minimal listing requirements can list on the TSXV, while the VCs generally finance a very low proportion of the projects they analyze. VCs choose a project following a thorough due diligence process concerning the various dimensions of the venture, including its management and the market for the product or service. A second important difference between the public and the private market is the use, by the latter, of incentive contracts and specially designed securities. These tools serve to control agency problems and associated risks. The public venture market has only conventional stocks and warrants at its disposal. Private VCs are 5.
(9) presumed to provide value added services in several areas of firms’ activities. The public market cannot provide these services, and the sponsor’s role is limited to ascertaining that the firm is suitable for the market. Moreover, in several cases, the sponsor is not involved in the listing process. The stock exchange exempts an issuer from the sponsorship requirements when it raises an IPO and the prospectus is executed by at least one member of the exchange, and, since the 2002 revision of the TSXV policy, a CPC is no longer required to retain a sponsor for an IPO, provided that it has an agent sign the CPC prospectus as an underwriter. 6 **Insert Table 2 about here** One can argue that firms that opt for the public venture market cannot benefit from value added activities usually provided by VC. Further, firms financed by the public VC market are likely to reach the main market under less favorable conditions than companies backed by VCs. These VCs spend considerable time monitoring firm management before the IPO (Gompers 1995) because they have incentives to set strong governance structures in their portfolio firms (Hochberg 2006); this is known as the “monitoring effect.” Moreover, as underlined by Lerner (1995) and by Barry et al. (1990), VCs frequently retain a seat on the newly listed firm’s board even after cashing out. Lerner argues that it might be expected that these firms will experience fewer agency problems because VCs are specialized providers of oversight. VCs have strong incentives to set optimal governance systems before their portfolio firm goes public, because their returns depend on the share price when the lockup rules permit them to sell their stake. This is called the “oversight effect.” Finally, Chemmanur and Loutskina (2006) evidence a “market power effect.” VCs develop long-term relationships with participants in the IPO market, e.g. underwriters, institutional investors and analysts. These relationships increase the participation by these market players in the IPOs. The comparison between the tools, resources and skills of a private and a public market for VC illustrates that only the former can resolve the asymmetry, risk and agency problems that prevail in the financing of new ventures. As Korcsmaros (2002, p.4) maintains, “the jury is still out on the accomplishments attained by stock exchanges dedicated to serving SMEs and the extent to which they have been successful in bringing SMEs to the capital market.” There is support for the notion that, especially for emerging economies, stock exchanges are particularly relevant to help 6. http://www.tsx.com/en/pdf/ManualUpdateAug-2002.pdf. 6.
(10) medium-sized indigenous firms gain access to finance and promote local market development. However, there are specific doubts regarding the suitability of financing emerging ventures through an exchange. Consequently, the analysis of the Canadian public venture market is of great interest. ENTRANCE Mechanisms The Penny Stock IPO Process In the U.S., several regulatory changes strongly restrict the issuing of penny stock IPOs. The Penny Stock Reform Act of 1990 (PSRA) was mainly an attempt to curb fraudulent security issues by placing severe restrictions on IPOs priced below $5. As evidenced by Bradley et al. (2006), penny stock IPOs are rare in the U.S. From 1990 to 1998, these authors mention 251 penny stock IPOs and 2,707 ordinary IPOs. However, the gross proceeds of the penny stocks of their sample ($5.7 million) are approximately four times those reported in Canada during the same period. This illustrates the distinctive situation of the stock market in Canada. This situation prevails because the Canadian and U.S. stock exchanges and regulators have followed opposite paths. In Canada, there are no requirements for minimum stock price, and companies are allowed to list at a pre-revenue stage, with minimal shareholders’ equity and prices generally lower than one Canadian dollar. The initial listing requirements changed several times over the years, and vary by sector. As a result, characterization of the newly listed companies illustrates the requirements more clearly than the list of criteria would. For the last twenty years, the median issue price, pre-issue shareholders’ equity and gross proceeds were CAN$0.75, CAN$180,000 and CAN$550,000 respectively. Almost 59% of issuers report no revenues and 84% report negative earnings. The majority of Canadian IPOs can be considered penny stock IPOs, while in most countries, minimal listing requirements exclude micro-capitalization and start-up companies from the market. However, consistent with the arguments of several practitioners and academics that the listing rules are too restrictive, alternative listing modes have been developed and actively promoted by the exchanges. They include the RM listing method and the use of the CPC Program.. 7.
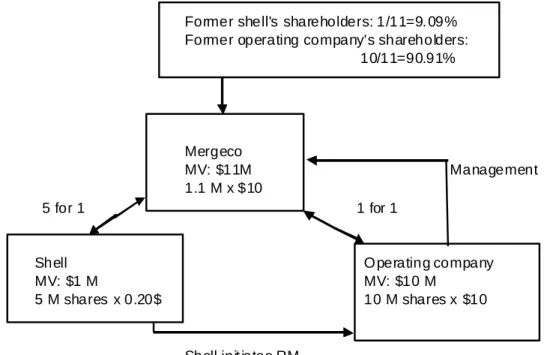
(11) Reverse Mergers An RM listing is a merger between a public shell company, generally inactive, and the target, a privately held company. The shell generally has a very low market value. For the illustration presented in Figure 3, we use a value of CAN$1 million, comprised of 5 million shares priced at CAN$0.20. Operating closed firms that seek listing generally have a much higher value: for illustration purposes, we attribute to such a firm a value of 10 million shares priced at CAN$10. The resulting company, which we name Mergeco, results from the merger of the two former firms. The merger entails an exchange of shares, and a private placement is often raised. Because of the difference in value between the shell and the operating company, the shareholders of the operating company acquire the majority of the shares of the resulting entity. These shareholders ultimately control the public shell company, which is why this transaction is called a Reverse merger. RMs take place in the exempt market: this means that newly listed companies are exempt from filing a prospectus and need not comply with the registration requirements prevailing for IPOs. 7 Moreover, during an RM, the company cannot issue equity publicly, because these transactions are not considered public offerings and are not associated with the approval of a prospectus by the authorities. As a result, the private company becomes public by buying the shell and does not need to issue a prospectus, sell new shares to the public or meet the minimum listing requirements. **Insert Figure 3 about here** The frequency of RM is constrained by the availability of shells. “Classic” shells are once active companies that failed to develop and ceased or strongly reduced their activities. They are mostly NEX listed companies that could not meet the ongoing listing requirements of the other exchanges. “Manufactured” shells are created specifically from zero, using the CPC program. The CPC Program The first Junior Capital Pool program was launched in Alberta at the end of 1986. This program was an adaptation of the U.S. Blind Pool (Blank Check Company, BCC) program. In 1997, a similar program was adopted in British Columbia. The CPC program replaced the two previous programs following the merger of the Vancouver and Alberta Stock Exchanges in November 7. The disclosure requirements for these transactions vary over time and between provinces. In 2005, the exchange modified the policy to require prospectus-like disclosure. 8.
(12) 1999. In Ontario and Quebec, the program has been in force on the TSXV since 2002. The CPC program is a two-stage process. The first stage involves the completion of the IPO and the listing of the CPC on the exchange. The CPC is a listed corporation with no assets or business plan, no operating history, and no assets except cash. Its sole goal is to find and acquire assets or companies as takeover targets. The second stage involves an agreement in principle relative to a qualifying transaction. Once this transaction is completed, the new entity must satisfy the exchange’s minimum listing requirements for the particular industrial sector. The resulting issuer (RI) may be listed for regular trading either in Tier 1 or Tier 2. In the U.S., BCCs commonly used in the ‘80s as shells have been severely restricted by the Securities and Exchange Commission (SEC), which enacted Rule 419 in 1992, designed to protect investors against fraud in RM transactions (Feldman 2006 Chap 4). However, creative lawyers developed the Special Purpose Acquisition Company (“SPAC”) 8 to work around the new regulations without defeating the regulations’ purpose of investor protection (Heyman 2007). A picture of the new listings In Table 3, we report the main characteristics of the firms that have accessed the TSXV during the last two decades, by sub-period and by type of listing method. These firms are microcapitalization. corporations:. their. pre-money. shareholders’. equity. is. approximately. CAN$300,000. The listing does not coincide with collection of significant amounts of cash. If we consider the private placements occurring during RM as the equivalent of the IPO’s gross proceeds, we get a median (mean) gross proceeds of CAN$650,000 (CAN$2 million) for all new listings. Moreover, 80.14% of newly listed firms report negative earnings at the listing time, and close to 50% of companies access the market at a pre-revenue stage. These issuers have median assets of CAN$0.71 million. There are only slight differences between the companies, depending on the listing mode. The median shareholders’ equity is larger for RMs (CAN$710,000) than for IPOs (CAN$180,000) and RIs of CPCs (CAN$320,000). The proportion of companies reporting no revenues (earnings) at the listing time ranges from 30% (72%) for RIs of CPCs to 59% (84%) 8. An SPAC is a company that has no specific business plan or purpose or has indicated that its business plan is to engage in a merger or acquisition with an unidentified company or companies, other entity, or person within a specified time period, typically within a span of eighteen months, according to the SEC. These companies are “development stage companies.” There are considerable differences between BBC and SPACs in terms of regulation, size and the number of shareholders. The average proceeds of the 62 IPOs of SPACs analyzed by Jog and Sun (2007) during the 2003-2006 period are US$65 million, an amount which is unrelated to those found in the CPC program.. 9.
(13) for IPOs. Overall, the operational characteristics of firms financed through the TSXV resemble those of firms that can be financed by early stage private VCs. A very large proportion (more than 48%) of newly listed companies specialize in natural resources, including energy and mining. The proportion of technological firms (19.29%) appears low compared with the proportion of such investment by VCs in the U.S., which is generally between 80% and 90%. 9 However, Brander et al. (2008) report that 33% of private VC investees are in technology sectors in Canada. The focus of VC thus differs sharply between the two countries. According to Baygan (2003), in 2001, deals valued at CAN$5 million and above represented about 80% of all Canadian VC transactions, and the average deal size reached CAN$4.5 million at the beginning of the ‘00s. Similar figures are provided by Industry Canada: the average deal size in VC reached CAN$3.0 million in 2002, after peaking at CAN$4.3 million in 2000—a 72percent increase from the CAN$1.8 million average in 1996 (Industry Canada 2002). Accordingly, the median proceeds raised by newly listed Canadian companies (CAN$0.65 million) are significantly lower than the average deal in the Canadian VC market. The TSXV indeed competes with the early stage component of the VC market, but the TSXV new listings are even smaller than the firms financed by private VCs. By summing the gross proceeds and the pre-money shareholders’ equity, we estimate the median post-money shareholders’ equity at CAN$1 million. **Insert Table 3 about here** Subsequent financing rounds In the conventional VC market, staging is a current practice and the financed companies are provided with successive financing rounds. The situation is similar in the public VC market, where the listed companies issue a large number of private placements and subsequent public offerings. Most of these financing rounds occur when the companies do not report positive earnings or even sales. Table 4 summarizes the financing activity of firms that list on the TSXV between 1993 and 2006. A surprising result is that a large proportion of the firms analyzed had no financing activity following the listing. 39.38% of the IPOs issue neither private nor public. 9. From PWC data at: http://www.pwcmoneytree.com/moneytree/nav.jsp?page=notice&iden=B. 10.
(14) equity. The same situation prevails for RMs (44.26%) and RIs of CPCs (46.10%). The reasons such companies list are unclear, but growth financing does not seem to be among them. The most plausible explanation is that a large proportion of newly listed companies do not fulfill the minimal conditions required to secure private or public outside equity. Based on an extensive analysis of 3,720 private VC investments from 1996 to 2004, Brander et al. (2008 note 10, p.12) report that “as of five years after first investment, about 10% of venturesupported enterprises have an IPO, about 25% are acquired by a third party, about 45% go out of business, and the remainder either experience another type of venture capital exit or simply continue as a venture-supported privately held enterprise.” The proportion of TSXV newly listed companies that do not get subsequent rounds of financing is in the same range as the failure rate observed in the private VC market. Following listing, a large proportion of firms (32%) issue private placements exclusively. Our analysis of these private placements indicates that they are essentially provided by individual investors. This is a puzzling result, especially for the backdoor new listings. Indeed, if these firms do not raise public offerings, they will never create a public market for their shares, and their stock liquidity will be low. One of the main advantages of a public listing is the decrease in the cost of equity through the creation of a liquid market for shares. Our analysis shows that the firms listed on the TSXV are not actively seeking this advantage. The total financing obtained by the 854 firms involved in private placements is low: CAN$15.8 billion or CAN$18.5 million over an average time frame of 10 years. Only 25.41% of the newly listed firms get financing through a subsequent public offering. The mean time to raise this financing is approximately 17 months after the listing date. The median time ranges from 6 months for CPCs to 13 months for IPOs. Overall, a small sub-sample of firms (7.49%) obtained 4 financings or more, but they raise 41.48% of the total gross proceeds. From the financing strategy standpoint, firms that choose the public market exhibit a pattern of staged finance similar to the one observed in the private market. **Insert Table 4 about here**. 11.
(15) PERFORMANCE OF THE PUBLIC VENTURE MARKET IN DEVELOPING NEW VENTURES The performance of a venture market can be measured in several ways. We focus on the following dimensions. 10 First, we analyze the failure--or delisting--rate of new listings. Second, we study the success rate of the same listings. For VCs, the most successful exit is the IPO. In Canada, Brander et al. (2008, p.18) consider that the IPO market is divided into two segments: “the senior exchanges (TSX), which signal that an enterprise has achieved a certain maturity and viability, and the junior exchanges, which do not guarantee either maturity or viability of the enterprise.”. We then compare the rate of VC-backed IPOs on the TSX with the rate of. graduation from the TSXV to the same main market. A third pertinent dimension is the rate of return investors earn. Definition and Measures Delisting In Canada, the delisting rules have allowed securities to stay listed for a very long period, even if they are traded at a very low price or not at all. For example, in December 2001, 313 stocks listed on the TSXV had prices equal to 3 cents or less. Several of these stocks have been used as shell companies during an RM listing. Before the creation of the NEX in 2003, companies falling below TSXV's ongoing listing standards were designated inactive and given 18 months to meet the standards or be delisted. However, the delisting is not systematic; the stock exchange uses flexibility and discretion in applying the rules. 11 The ongoing listing standards to Tier 2 of the junior market refer to a minimal market capitalization of CAN$100,000 (in 2007), minimal working capital of CAN$50,000 and significant operating revenues in the previous 12 months; or at least CAN$100,000 in expenditures directly related to the development of assets in the. 10. This section of the chapter draws upon the papers by Carpentier and Suret (2008) and Carpentier et al. (2008) 11 According to the TSX Manual (2007, policy 2.5, p.3) “If an Issuer has a viable business although it does not meet certain elements of the Tier 2 TMR, the Exchange may determine that it is not appropriate to transfer the Issuer to NEX. The Exchange will consider the seasonal or other cycles which affect an Issuer’s business. If an Issuer’s Working Capital is low because of seasonal or other temporary conditions, the Exchange may delay enforcement of this Policy but will continue to monitor the Issuer.”. 12.
(16) previous 12 months. No conditions apply to the stock price. By comparison, similar limits for the NASDAQ are $5 million for market capitalization and $1 for the stock price, under standard 1.12 To be able to estimate a failure rate, we applied a rule which mimics the NASDAQ delisting practice as well as the decision criteria used by Demers and Joos (2007), among others. We consider as “dead” any stock that maintains a price lower than CAN$0.10 for seven consecutive months. We use the 10-cent limit given that Canadian IPO prices are on average one tenth of prices in the U.S. 13 This rule affects approximately 10% of newly listed companies, yet in many cases, the application of the rule has the sole effect of producing a delisting rule that is earlier than the date reported by the exchanges. We also consider as non-surviving a stock which is used as a shell for an RM, all companies whose stocks were delisted by the exchange, or subject to an issuer cease trade order at the time of the analysis, failed companies that are not yet delisted, and those whose stocks are only traded OTC or NEX. Mergers and acquisitions In the case of mergers, we assume that the resulting company is a continuation of the issuer. The issuer status is then one of a merged company. In the case of acquisitions, we collected the acquisition price per share (including the value of share exchanges) and qualified as failures the cases where the acquisition price is lower than CAN$0.10. Success The TSXV considers that a company succeeds if it graduates to the main Canadian market. To graduate, TSXV listed companies have to comply with the TSX minimal listing requirements. Even if these requirements are higher than those prevailing on the TSXV, they appear to be very low relative to international standards. In 1998, the TSX introduced the “technology company standards,” which required that companies have a minimum of CAN$12 million in treasury, adequate funds to cover all planned research and development (R&D) expenditures, general and administrative expenses and capital expenditures for a period of at least two years and a minimum two-year operating history that included R&D activities. Accordingly, these listing standards allow developing companies to access the market easily while reporting negative 12. According to the Listing Standard and Fees document, available on the NASDAQ site (last visited January 15, 2009, at http://www.nasdaq.com/about/nasdaq_listing_req_fees.pdf 13 Demers and Joos (2007) report a mean and median issue price in the vicinity of US$15 to US$16. The corresponding value is US$2 (CAN$3).. 13.
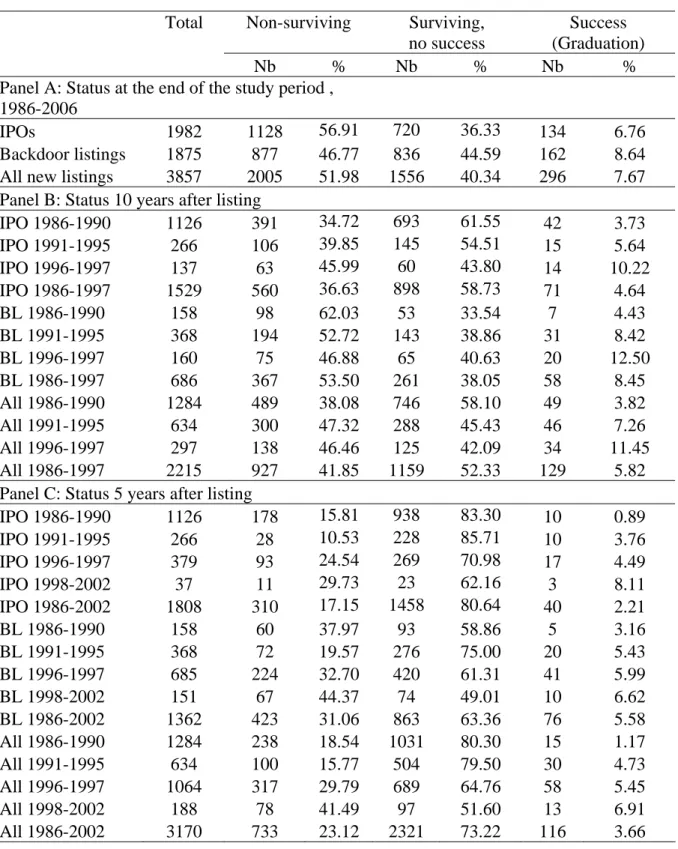
(17) earnings, even at a pre-revenue stage of development. 14 For mineral exploration and development-stage companies, the only quantified requirements are working capital of at least CAN$2 million and net tangible assets of CAN$3 million. For industrial companies “forecasting profitability,” the TSX requires net tangible assets of CAN$7.5 million and evidence (satisfactory to the TSX) of earnings from ongoing operations for the current or next fiscal year of at least CAN$200,000. As its website states, the TSXV promotes the migration of growing companies, which it strives to help graduate from the TSXV to the TSX “in a more efficient and economical manner than ever before (…) Once a company has gained the skills necessary to operate successfully as a public venture and built a solid financial foundation, it's possible to graduate to a senior exchange such as TSX.” The TSXV proposes the following benefits for graduation: 15 1) TSX listing application fee will be waived for eligible TSXV issuers; 2) certain issuer information on file with TSXV can be accessed by the TSX; 3) sponsorship requirements may be waived for qualified TSXV issuers; and 4) a business development service helps the company in the graduation process. Graduations are proudly highlighted on the website. The opportunity to graduate is a central argument in the promotion of actions organized by the exchange to attract new listings. 16 The results of the Public VC Market An extensive data collection process enabled us to establish the status of 3,430 of the 3,857 newly listed firms included in the initial sample (88.93%). The missing observations mostly concern firms that list at the beginning of our period of analysis for which no data are subsequently available. A status of failure is probably the best guess for these firms. Table 5 presents the distribution of the status by cohort and by listing method. We group RMs and RIs of CPCs (backdoor listings) because we do not observe material differences between these two categories in terms of evolution and status.. 14. See Harris (2006) for an analysis of this change in the listing requirements, and more generally of the listing standards in Canada. 15 See http://www.tsx.com/en/listings/venture_issuer_resources/graduation_to_tsx/index.html. 16 The TSXV organizes “Accessing Public Venture Capital Workshops” that “go beyond the basics of public venture capital and delivers compelling, first person perspectives on public financing, building your business and sustaining growth. And it provides access to leading public venture capital experts— investment bankers, lawyers, auditors and TSX Venture professionals.” The cases of graduating companies are presented as success stories (http://www.tsx.com/en/pdf/TSXVentureSuccessStories.pdf).. 14.
(18) Overall, Panel A shows that, at the end of the study period, non-surviving issuers represent 51.98% of the sample. The success rate (graduation or cross-listing) is 7.67% for the whole period. A proportion of 40.34% of issuers remains listed, but they do not graduate to a higher exchange. Therefore, in the long-run, approximately 5 out of 10 new issuers in Canada fail, 1 succeeds and 4 survive but do not progress. The failure rate of IPOs is slightly higher than the rate observed for the firms that use a backdoor listing method (56.91% versus 46.77%) and the success rate is also lower for the first group (6.76% versus 8.64%). This can indicate that IPO firms are, on average, of lower quality than the firms that use the backdoor listing method. However, no definitive conclusion can be reached without carefully controlling for sector and size of newly listed companies. Panel C of Table 5 allows a comparison with the results of previous studies, where failure and survival rates are generally estimated after three, four and five years. The proportion of nonsurviving firms thus falls to 23.12%. Three U.S. studies deal specifically with penny stocks, comparable to, albeit larger than Canadian IPOs. Weber and Willenborg (2003) report a delisting rate of 25.3% after 4 years, Bradley et al. (2006) a rate of 31.5% after 3 years, and Dalbor and Sullivan (2005) estimate the failure rate at 44%. In a recent paper, Espenlaub et al. (2008) estimate the delisting rate at 21.68% after only two years for newly listed companies on the AIM. Despite listing requirements that are significantly more permissive than in the U.S. and even the fact that a large proportion of new issuers report no sales, the survival rate of new issuers in Canada after about five years seems to be lower or in the same range as the rate observed in other countries. This situation can probably be explained by the capacity of developing listed firms to issue private or public equity, even with negative earnings or no revenues, which would allow emerging firms to finance their growth. Moreover, the failure rate observed on a 5-year horizon is lower than the rate reported by Brander at al. (2008 note 10, p.12) for the Canadian private equity market; they estimate that, at five years after first investment, about 45% of venture-supported enterprises go out of business. According to this statistic, the rate of mortality of newly financed firms is lower for the TSXV than for the private VC market. Panel B of Table 5 allows a comparison with the few studies that report failure rates over a long horizon (e.g. Fama and French 2004). The table shows that 41.85% of the new listings did not survive after 10 years. This rate is lower than the rate reported by Henser et al. (1997) for the same time horizon (55.1%). It is also consistent with the one reported by Fama and French (2004). 15.
(19) for their IPO issuers whose assets are below those of the median NYSE firm, but the size of these NASDAQ-listed companies is much larger than that of firms observed on the TSXV. Albeit much smaller and less mature than their U.S. equivalents, Canadian newly listed companies exhibit a similar or higher survival rate. We report, in Table 5, the failure rates by cohort of newly listed companies, for each listing mode. This value indicates the extent to which the failure rate is increasing, as asserted in the U.S. by Fama and French (2004). After five years (Panel C), the rate of failure increases sharply for IPOs, from 15.81% to 29.73% for the 1998-2002 cohort. This failure rate also increases for backdoor listings and, overall, the proportion of failure at five years has doubled from the end of the ‘80s to the beginning of the 2000s. The examination of the failure rate after ten years does not evidence a similar pattern. For all the new listings, the rate increases from 38.08% to 41.85%. This rate of failure increases slightly for IPOs and decreases for backdoor listings. The large increase in failure that we observe for the five year horizon is partially attributable to listing of emerging firms in the sector of internet and technologies. However, this phenomenon is not a fully satisfactory explanation, given that the failure rate increases for firms listed during the previous sub-period. We report, in the rightmost column of Table 5, the number of newly listed companies that graduate to the TSX by entry mode. For IPOs, the average graduation rate is 6.76% (Panel A): only 134 of the 1,982 IPOs of the period graduate. The proportion is 8.64% for backdoor listings (162 graduations per 1,875 listings). Overall, the success rate of the TSXV is 7.67%. Comparable statistics are provided by Brander et al. (2008) for the conventional VC market, after an extensive survey of all the VC investments in Canada over the 1996-2004 period. They examine 3,720 VCbacked firms, and show that 115 of these firms subsequently raise an IPO, 68 of which are followed by listing on a main exchange and 47 on the TSXV. The success rate reported by Brander et al. for the conventional VC market is thus a meager 3.1% for the population. The rate decreases to 1.8% if we consider IPOs on the TSX only. By comparison, the rate we estimate for the VC stock market is 7.67%. Although we cannot test the significance of this difference using the available data, the public venture market in Canada seems to provide a graduation rate for TSXV listed companies that is approximately four times the exit rate by IPOs on the main market estimated for VCs **Insert Table 5 about here**. 16.
(20) THE PERFORMANCE OF THE PUBLIC VENTURE MARKET: THE INVESTOR’S PERSPECTIVE Comparing the returns of a VC and a public market is a challenging task. VC returns are internal rates of return. The comparison with the classic rates of return of indexes cannot be based on statistical tests. Moreover, in Canada, indexes are available only from 1995 to 2005. The estimation of returns for the TSXV is also problematic, because this market results from the merger of several markets. The S&P TSXV index was created in 2002. Previously, a CDNX index was available since 1999. Before that time, the venture market was composed of several entities, each with their own index. As a result, we cannot use the official indexes for a long-term analysis. Moreover, the S&P TSXV index does not include newly listed companies. For these reasons, our analysis cannot provide a definitive conclusion on the relative performance of both markets. Nonetheless, the results are striking. Table 6 reports the value-weighted returns of an index of new listings on the public VC market. We use all the stocks that list on the TSXV or its predecessors, from their listing date. The new listings include IPOs, RMs and RIs of CPCs. The weights are based on the market capitalization at the beginning of each month. 17 For comparison purposes, we report 1) statistics on the return distribution of the TSX for the same period, 2) the official index returns for both markets, from 2001 to 2006 and 3) the new listings’ return for the 1995-2005 period, for a comparison with the conventional VC market’s return. Our first observation is that the TSXV outperforms the main market. The newly listed firm index posts an average rate of return of 15.69%, while the return of the main market was 10.70%. Nonetheless, the standard deviation is 35.40% for the former market vs. 14.34% for the latter one. We get similar results when the official indexes are used. Note that this market is highly volatile and illiquid, and is dominated by small and growth stocks. The TSXV probably does not compensate investors adequately for the various forms of risk associated with the ownership of small and growth stocks. The second observation is that the public VC market outperforms the private one considerably. From June 1995 to June 2005, the private VC industry reports a meager net annual internal rate 17. To limit the influence of the outliers, we set the maximum monthly return to 1000% (roughly 0.03% of the distribution). The equally weighted index is largely influenced by the spectacular returns of several very small stocks, which soar from 1 to 10 cents. Consequently, we report and discuss the value-weighted returns exclusively.. 17.
(21) of return of -3%.18 The net annual rates of return are in the same range for early stage VC. (-. 3.4%), balanced VC (-2.8%) and later stage VC (-3.3%). During the same period of time, the new listings index posts an 11.96% annual rate of return. The VC market’s performance is abnormally low in Canada relative to the U.S., which reports an annual return of 27.6% for the same period, according to the Canadian Venture Capital Association (CVCA). The difference between the returns of the public and private venture markets is economically very large, but we cannot assess its statistical significance because the two returns are not estimated the same way. This unexpected result contradicts the proposition that conventional VCs benefit from significant advantages in financing new ventures. In Canada, the public VC market outperformed the private one. One explanation for this is that the reported VC return is abnormally low, because it includes the very poor return of Labour-Sponsored VC Funds, which receive large tax subsidies but suffer from poor governance (Cumming and MacIntosh 2006). According to this explanation, during the studied period the larger players in the VC market have not demonstrated the capacity and skill usually attributed to private VCs. A second explanation could be that the TSXV is heavily exposed to the natural resources sector, while the VC is not. Nonetheless, excluding this sector does not change the conclusion, since the difference between the public and the private market return is still higher than 1000 basis points per year (Carpentier et al. 2008). A third explanation for the observed difference could be a competition effect. With quicker and lighter procedures (mainly in the case of RMs) the TSXV may have captured a significant market share of promising companies usually oriented toward traditional VC. We left the test of these propositions for further research. **Insert Table 6 about here** CONCLUSION This paper describes and analyzes how a stock exchange can be used to finance emerging companies and to assume the role usually played by private VCs. Our analysis of the population of new listings in the Canadian venture stock market--the TSXV--during the 1986-2006 period. 18. See Canadian VC & Private Equity Industry Performance data, online on the site of Reseau Capital (the Quebec VC and Private Equity Association), last visited January 15, 2009, at: http://www.reseaucapital.com/Statistiques/Stat2005/Performance%20Study%20June%202005.pdf The performance of the US VC industry is also available (last visited January 15, 2009) at: http://www.reseaucapital.com/Statistiques/Stat2006/2006_Q4_ForumCanada-France.pdf. 18.
(22) illustrates the openness of this market to early stage companies. The size and the gross proceeds of newly listed companies are generally lower than those reported for VC investments, and far less than those observed in the junior markets in Europe. The TSXV is indeed a public market for VC, which provides equity to early stage companies well before they reach the profitability stage, and even before they report revenues. Canada has developed a specific path to finance emerging firms, probably because of the poor performance of a VC market hampered by questionable public policies and minimally interested in small deals, combined with the steady rate of business creation in the natural resources sector, where VC involvement is typically low. The Canadian experience thus illustrates that a mode other than classic VC can provide businesses in the pre-profitability stage with equity. The question is whether such a tool can be economically viable. Several dimensions of this experimentation deserve attention. We measured the success rate of new entrants, and estimated the rate of failure/success. We then compared these data with data reported for traditional VCs, which usually consider an IPO to be a success. We find that the success rate of the public venture market is approximately four times the corresponding rate for traditional VC. This surprising result is not consistent with the lack of screening and monitoring by the venture stock exchange. However, the public venture market admits more new firms than the VC market usually does, and seems to accept companies at an earlier development stage. The bottom line is that during the period under analysis, the ratio of graduations to the total sample of VC-backed IPOs is approximately seven to one. For a horizon of five years, the delisting rate of newly listed companies is lower than the one reported in the U.S., and much lower than the failure rate observed for the private VC sector in Canada. This result is surprising because of the apparently poor quality of the new issuers on the public market and the lack of value added activity usually associated with conventional VC providers. In particular, the delisting rate is much lower than the failure rate of 45% reported during 1996-2004 by Brander et al. (2008) for private VCs. This situation is probably attributable to two factors. First, a Canadian company can easily issue private or public equity, even if it has not reached the profitability or even the sales stage. In this sense, the Canadian seasoned equity market contrasts sharply with the U.S. market. The second explanation is the tolerance of the exchange for delisting of non-operating companies. The exchange is probably less prone to delist. 19.
(23) than VCs are to write off. Nevertheless, the observation that a public market devoted to early stage companies exhibits a lower failure rate than the private VC market is not in line with the theoretical literature, which gives private VC a strong advantage in financing new ventures. In the same vein, the observation that the rate of return of a public VC market can surpass that of a private VC market, in the same country, is another unexpected result. Further research is needed to determine if the poor performance of the Canadian VC market is linked to the existence of the public VC market, and to what extent these markets are competing with each other. In any case, this evidence clearly argues in favour of a reexamination of public policy devoted to VC in Canada.. 20.
(24) REFERENCES Amit, Raphael, James Brander and Christoph Zott. 1998. "Why do Venture Capital Firms Exist? Theory and Canadian Evidence." Journal of Business Venturing 13:6, 441-466. Barry, Christopher B, Chris J. Muscarella, John W. Peavy and Michael R. Vetsuypens. 1990. "The Role of Venture Capital in the Creation of Public Companies: Evidence from the Going-Public Process." Journal of Financial Economics 27, 447-471. Baygan, Günseli. 2003. "Venture Capital Policies in Canada." OECD Science, Technology and Industry Working Papers, 2003/4, OECD Publishing. Bottazzi, Laura and Marco Da Rin. 2002. "Venture Capital in Europe and the Financing of Innovative Companies." Economic Policy : A European Forum 17:34, 231-69. Bradley, Daniel J., John W. Cooney, Steven D. Dolvin and Bradford D. Jordan. 2006. "Penny Stock IPOs." Financial Management 35:1, 5-29. Brander, James A., Edward J. Egan and Thomas F. Hellmann. 2008. "Government Sponsored Venture Capital in Canada: Effects on Value Creation, Competition and Innovation." NBER conference on International Differences in Entrepreneurship. http://www.nber.org/~confer/2008/IDE/hellmann.pdf Carpentier, Cécile, Jean-François L'Her and Jean-Marc Suret. 2008. "Stock Exchange Markets for New Ventures." Forthcoming in Journal of Business Venturing. http://ssrn.com/abstract=1132285 Carpentier, Cécile and Jean-Marc Suret. 2008. "The Survival and Success of Penny Stock IPOs: An analysis of the Consequences of Low Listing Requirements." Forthcoming in Small Business Economics, Available at SSRN : http://ssrn.com/abstract=1070855. Chemmanur, Thomas J. and Elena Loutskina. 2006. "The Role of Venture Capital Backing in Initial Public Offerings: Certification, Screening, or Market Power?" Available at SSRN. http://ssrn.com/paper=604882 Cumming, Douglas. 2006. "Do Companies Go Public too Early in Canada?" Research Study Commissionned by the Task Force to Modernize Securities Legislation in Canada. Cumming, Douglas and Jeffrey MacIntosh. 2006. "Crowding out Private Equity: Canadian Evidence." Journal of Business Venturing 21:5, 569-609. Cumming, Douglas and Jeffrey MacIntosh. 2007. "Mutual Funds that Invest in Private Equity? An Analysis of Labour Sponsored Investment Funds." Cambridge Journal of Economics 31:3, 445-487. Dalbor, M. C. and M. J. Sullivan. 2005. "The Initial Public Offerings of Restaurant Firms: The Case of Industry-Specific Micromarket Capitalization Offerings." Journal of Small Business Management 43:3, 226-242. Demers, Elizabeth A. and Philip Joos. 2007. "IPO Failure Risk." Journal of Accounting Research 45:2, 333-371. Espenlaub, Susanne, Arif Khurshed and Abdul Mohamed. 2008. "Is AIM A Casino? A study of the survival of new listings on the UK Alternative Investment Market (AIM)." European Financial Management IPO Symposium 2008, Oxford http://efmaefm.org/0EFMSYMPOSIUM/oxford-2008/Susanne.pdf Fama, Eugene F. and Kenneth R. French. 2004. "Newly Listed Firms: Fundamentals, Survival Rates, and Returns." Journal of Financial Economics 73:2, 229-169. Feldman, David N. 2006. Reverse Mergers : Taking a Company Public Without an IPO. New York, Bloomberg Press. 21.
(25) Fenn, George-W, Nellie Liang and Stephen Prowse. 1996. "The Economics of the Private Equity Market." Federal Reserve Bulletin (January). http://www.federalreserve.gov/pubs/staffstudies/1990-99/ss168.pdf, 1-69. Gompers, Paul A. 1995. "Optimal Investment, Monitoring, and the Staging of Venture Capital." The Journal of Finance 50:5, 1461-1489. Gompers, Paul A. and Josh Lerner. 2001. "The Venture Capital Revolution." Journal of Economic Perspectives 15:2, 145-168. Harris, A. Douglas. 2006. "The Impact of Hot Issue Markets and Noise Traders on Stock Exchange Listing Standards." University of Toronto Law Review. 56:Summer, 223-280. Hensler, Douglas A., Ronald C. Rutherford and Thomas M. Springer. 1997. "The Survival of Initial Public Offerings in the Aftermarket." Journal of Financial Research 20:1, 93-110. Heyman, Derek K. 2007. "From Blank Check to SPAC: The Regulator's Response to the Market, and the Market's Response to the Regulation." Entrepreneurial Business Law Journal 2:1, 531-552. Hochberg, Yael. 2006. "Venture Capital and Corporate Governance in the Newly Public Firm." Working Paper Kellogg School of Management, Northwestern University,. http://www.kellogg.northwestern.edu/faculty/hochberg/htm/VCCG.pdf Industry Canada. 2002. Canadian Venture Capital Activity: An Analysis of Trends and Gaps 1996-2002, Industry Canada: 292 p. Jog, Vijay and Chengye Sun. 2007. "Blank Check Ipos: A Home Run for Management." Available at SSRN: http://ssrn.com/abstract=1018242. Korcsmaros, K. 2002. "Can Capital Markets Meet The Financing Needs of SMEs." Infrastructure and Financial Markets Review 8:4, 4-6. Lerner, Josh. 1995. "Venture Capitalists and the Oversight of Private Firms." The Journal of Finance 50:1, 301-318. Nicholls, Christopher. 2006. "The Characteristics of Canada’s Capital Markets and the Illustrative Case of Canada’s Legislative Regulatory Response to Sarbanes-Oxley." Research Study Commissioned by the Task Force to Modernize Securities Legislation in Canada. Rousseau, Stephane. 2006. "The Competitiveness of Canadian Stock Exchanges: What Can We Learn from the Experience of the Alternative Investment Market?" Research Study Commissioned by the Task Force to Modernize Securities Legislation in Canada. SEC. 2006. "Final Report of the Advisory Committee on Smaller Public Companies to the U.S. Securities and Exchange Commission." Report, SEC: Washington DC. Weber, Joseph and Michael Willenborg. 2003. "Do Expert Informational Intermediaries Add Value? Evidence from Auditors in Microcap Initial Public Offerings." Journal of Accounting Research 41:4, 681-720.. 22.
(26) Figure 1: The Canadian market for growing business financing, as depicted by a professional in the field. TSX Venture Exchange provides emerging companies with an alternative source of capital through access to public funds. Financing Options Private Equity - Venture Capitalists –. - TSX - Other -. Seed Money Start-Up Company. Senior Markets. - Angel Investors - Government Public Venture Capital - TSX Venture Exchange -. Source: Public Venture Capital. Kevin Strong. Manager, Winnipeg Office. TSX Venture Exchange. SATA. May 10, 2006. www.sata.ca/docs/2006%2005%2010%20SATA.ppt. 23.
(27) Table 1: Main characteristics of TSXV-listed companies at the end of December 2006, according to the TSXV Review. Stocks not traded during the year are set to 0. Panel A reports the stock price distribution in Canadian dollars. Panel B reports the market capitalization in CAN$ million. Frequency Relative frequency % Panel A: Stock Prices, in Canadian dollars ($) $0 51 2.39 $0.05 92 4.32 $0.1 165 7.74 $0.2 418 19.62 $0.3 274 12.86 $0.4 201 9.43 $0.5 152 7.13 $0.75 247 11.59 $1 149 6.99 $1.5 139 6.52 $5 196 9.20 $10 32 1.50 More than $10 15 0.70 Total 2,131 100.00 Panel B: Market Capitalizations, in CAN$ million ($M) $0 M 51 2.39 $1 M 152 7.13 $2 M 182 8.54 $5 M 362 16.99 $10 M 368 17.27 $15 M 230 10.79 $20 M 169 7.93 $30 M 202 9.48 $50 M 159 7.46 $100 M 146 6.85 $500 M 100 4.69 More than $500 M 10 0.47 Total 2,131 100.00. Cumulative frequency % 2.39 6.71 14.45 34.07 46.93 56.36 63.49 75.08 82.07 88.60 97.79 99.30 100.00. 2.39 9.53 18.07 35.05 52.32 63.12 71.05 80.53 87.99 94.84 99.53 100.00 200.00. 24.
(28) $ m illio n s. Figure 2: Financing on TSXV compared with VC Disbursements, 2000-2005. Public Companies on TSX Venture raised $920 million more than private companies in Q1 2005. $2 000 $1 800 $1 600 $1 400 $1 200 $1 000 $800 $600 $400 $200 $0 Q12000. Q3 2000. Q12001. Q3 2001. Q12002. VC Disbursements. Q3 2002. Q12003. Q3 2003. Q12004. Q3 2004. Q12005. TSX Venture Financings. * TSX Venture figures include Resources (Mining and Oil & Gas) and Real Estate sectors financing statistics.. Source: Public Venture Capital. Kevin Strong, manager, Winnipeg Office. TSX Venture Exchange. SATA. May 10, 2006. www.sata.ca/docs/2006%2005%2010%20SATA.ppt. The data originate from TSX Group and Macdonald & Associates as at March 2005.. 25.
(29) Table 2: Comparison of tools and skills available to conventional and public venture capital (VC) markets. Tools, methods and skills. Conventional VC Market. Public VC Market. Selection of more promising deals. Specific analysis tools, knowledge of the sectors;. No selection. New companies must fulfill minimal listing requirements;. VCs have a direct and strong incentive to select the best projects. No incentive to select the best projects. Information collection. VCs use due diligence process and their knowledge of the technologies and market to determine the value of the projects. Prospectus if the listing is done via an IPO, Notice and minimal information when the listing is done by RM in several provinces.. Management valuation and knowledge. Management experience is assessed. Officers, directors and holders of more than 10% of a company’s voting securities complete information forms, allowing the TSXV to conduct background checks before approving a listing.. Incentive contracts. Generally used. Shareholders agreements adapted to the specific context. Not available. Monitoring Value added services in several and value areas of management, including added service strategy, marketing and finance.. A participating organization can provide a sponsorship letter. Sponsors confirm whether the issuer satisfies the initial listing requirements and comment on the ability of the firm to meet its obligations as a public company.. Networking Capacity. Significant, mainly for sector specialized VCs. None. Exit mechanism. VCs possess market power and knowledge of the IPO process. VCs remain involved in the newly listed firm, because the value they get from the IPO is determined by the stock price at the end of the lock-up period.. Graduation toward a more senior exchange. The exchange provides technical help for graduation, but it has neither the motivation nor the resources to provide the graduating companies with the services usually provided by VC at the IPO exit time.. 26.
(30) Figure 3: Illustration of the reverse merger listing method frequently used on the TSXV market. Former shell's shareholders: 1/11=9.09% Former operating company's shareholders: 10/11=90.91%. Mergeco MV: $11M 1.1 M x $10 5 for 1. Management 1 for 1. Shell MV: $1 M 5 M shares x 0.20$. Operating company MV: $10 M 10 M shares x $10. Shell initiates RM. 27.
(31) Table 3: Main characteristics of 3,857 new listings on the TSXV during the 1986-2006 period, by listing method.. Type of listing Number Mean Gross proceeds, in $M Median Gross proceeds, in $M Assets, in $M Shareholders' equity, in $M % of High Tech issuers % of Natural Resources issuers % of issuers without revenues at the issue % if issuers with negative EPS at the issue. Initial Public Offering 1,982 1.61 0.55 0.54 0.18 16.04 55.55 58.68. Reverse Merger 825 2.94 0.66 1.60 0.71 14.67 41.58 41.00. 83.57. 77.84. Resulting issuer All new from CPC listings 1,050 3,857 2.36 2.08 1.14 0.65 0.80 0.71 0.32 0.26 29.12 19.29 39.27 48.14 29.96 49.26 72.33. 80.14. CPC means Capital Pool companies. Mean and median gross proceeds, assets and shareholders’ equity are in CAN$ million ($M). % means percentage. EPS means earnings per share. Source: Carpentier et al. (2008). 28.
(32) Table 4: Distribution of subsequent financing activity, between 1993 and 2006, of companies newly listed on the TSXV. Total gross proceeds (GP) are in CAN$ million. Mean and median time until the first subsequent financing is in months. IPO means initial public offering. RM means reverse merger. CPC means capital pool company. % # of firms. #. Panel A: IPO no financing 484 39.38 1 financing 379 30.84 197 2 financings 168 13.67 98 3 financings 85 6.92 46 >=4 financings 113 9.19 62 Total 1229 100.00 403 Panel B: RM no financing 274 44.26 1 financing 186 30.05 91 2 financings 74 11.95 53 3 financings 40 6.46 27 >=4 financings 45 7.27 32 Total 619 100.00 203 Panel C: Resulting Issuers from CPC no financing 378 46.10 1 financing 278 33.90 132 2 financings 78 9.51 47 3 financings 44 5.37 36 >=4 financings 42 5.12 33 Total 820 100.00 248. Private Placements mean median time time. total GP. #. Seasoned offerings mean median total GP time time. 28.65 26.21 23.64 18.88 25.98. 16.39 13.83 17.18 9.30 14.32. 2351.88 2461.55 1542.91 3154.69 9511.03. 182 70 39 51 342. 20.49 20.15 18.67 13.72 19.20. 13.68 13.22 14.19 11.27 12.57. 6363.46 3723.65 7005.91 16410.04 33503.05. 28.06 18.17 14.14 17.15 21.91. 13.86 10.51 5.75 6.97 9.40. 868.54 779.16 525.12 1339.24 3512.05. 95 21 13 13 142. 19.95 10.85 15.16 7.49 17.02. 7.82 2.40 8.48 3.32 6.80. 1098.37 1061.27 1110.18 680.43 3950.25. 28.48 22.97 14.58 26.68 25.18. 15.72 6.90 7.74 18.04 12.32. 707.68 146 557.60 31 607.15 8 907.99 9 2780.42 194. 15.04 12.75 15.26 19.03 14.87. 6.19 4.60 7.79 14.06 6.11. 656.18 603.69 399.79 493.26 2152.92. 29.
(33) Table 5: Distribution of IPOs, backdoor listings (BL) and all new listings (All) between 1986 and 2006, by status at the end of the study period (June 2007, Panel A), ten years after listing (Panel B) and five years after listing (panel C). BL means backdoor listings. Total. Non-surviving. Nb % Panel A: Status at the end of the study period , 1986-2006 56.91 IPOs 1982 1128 Backdoor listings 1875 877 46.77 All new listings 3857 2005 51.98 Panel B: Status 10 years after listing 34.72 IPO 1986-1990 1126 391 39.85 IPO 1991-1995 266 106 45.99 IPO 1996-1997 137 63 36.63 IPO 1986-1997 1529 560 BL 1986-1990 158 98 62.03 BL 1991-1995 368 194 52.72 BL 1996-1997 160 75 46.88 BL 1986-1997 686 367 53.50 All 1986-1990 1284 489 38.08 All 1991-1995 634 300 47.32 All 1996-1997 297 138 46.46 All 1986-1997 2215 927 41.85 Panel C: Status 5 years after listing 15.81 IPO 1986-1990 1126 178 10.53 IPO 1991-1995 266 28 24.54 IPO 1996-1997 379 93 29.73 IPO 1998-2002 37 11 17.15 IPO 1986-2002 1808 310 BL 1986-1990 158 60 37.97 BL 1991-1995 368 72 19.57 BL 1996-1997 685 224 32.70 BL 1998-2002 151 67 44.37 BL 1986-2002 1362 423 31.06 All 1986-1990 1284 238 18.54 All 1991-1995 634 100 15.77 All 1996-1997 1064 317 29.79 All 1998-2002 188 78 41.49 All 1986-2002 3170 733 23.12. Surviving, no success Nb %. Success (Graduation) Nb %. 720 836 1556. 36.33 44.59 40.34. 134 162 296. 6.76 8.64 7.67. 693 145 60 898 53 143 65 261 746 288 125 1159. 61.55 54.51 43.80 58.73 33.54 38.86 40.63 38.05 58.10 45.43 42.09 52.33. 42 15 14 71 7 31 20 58 49 46 34 129. 3.73 5.64 10.22 4.64 4.43 8.42 12.50 8.45 3.82 7.26 11.45 5.82. 938 228 269 23 1458 93 276 420 74 863 1031 504 689 97 2321. 83.30 85.71 70.98 62.16 80.64 58.86 75.00 61.31 49.01 63.36 80.30 79.50 64.76 51.60 73.22. 10 10 17 3 40 5 20 41 10 76 15 30 58 13 116. 0.89 3.76 4.49 8.11 2.21 3.16 5.43 5.99 6.62 5.58 1.17 4.73 5.45 6.91 3.66. 30.
(34) Table 6: Comparison of Canadian raw returns. Raw returns are measured for newly listed firms on the TSXV and the main market (TSX). The internal rate of return of the conventional venture capital (VC) comes from the Canadian VC Association. Portfolios are value-weighted. NA means not available. Annual Return. Standard Deviation. 1,626 newly listed firms on the TSXV, 1986-2006. 15.69%. 35.40%. TSX S&P Index, 1986-2006. 10.70%. 14.34%. TSXV S&P Index, 01/2001 to 12/2006. 23.57%. 23.07%. TSX S&P Index, 01/2001 to 12/2006. 13.08%. 11.19%. 1,144 newly listed firms on the TSXV, 06/1995 to 06/2005. 11.96%. 34.78%. Internal rate of return of conventional VC, 06/1995 to 06/2005. -3.00%. NA. Source: Carpentier et al. (2008). 31.
(35)
Figure


+6


Documents relatifs
EDBT/ICDT 2020 Joint Conference, “Climate Change (Online) Session”.. April 1 st , 2020, Copenhagen, Denmark – Amarilli
Among examples, one can mention ePortfolio technology in connection with learning environments, the integration of “intelligent” modules to current LMS systems for language
The theory of capital taxation that I present in Capital in the Twenty-First Century is largely based upon joint work with Emmanuel Saez ( see, in particular, Piketty and Saez
En application des articles 140 et suivants du règlement, est créée une commission d’enquête de trente membres chargée d’investiguer sur les conditions d’introduction en
A LAIN BOCQUET, tendant à la création d’une commission d’enquête sur les conditions d’introduction en bourse d’EDF, sur l’ouverture de son capital au marché financier,
Two years later, as the president of ABECAN, I had the opportunity to experience the anguish, together with my colleagues from other Associations for Canadian Studies, at that
Are there examples of minimal uniquely ergodic GIETs whith mean zero non-linearity for which renormalisation does not converge to affine.. On Lebesgue ergodicity for
collected here. Recent results in dynamical systems theory allow us to precise some of the conclusions, and to generalize these theorems to the C 1 ° 1 class.
