HAL Id: hal-02100676
https://hal-mines-albi.archives-ouvertes.fr/hal-02100676
Submitted on 6 Nov 2019
HAL is a multi-disciplinary open access
archive for the deposit and dissemination of
sci-entific research documents, whether they are
pub-lished or not. The documents may come from
teaching and research institutions in France or
abroad, or from public or private research centers.
L’archive ouverte pluridisciplinaire HAL, est
destinée au dépôt et à la diffusion de documents
scientifiques de niveau recherche, publiés ou non,
émanant des établissements d’enseignement et de
recherche français ou étrangers, des laboratoires
publics ou privés.
A correlation between tribological behavior and crystal
structure of cobalt-based hardfacings
E. Cabrol, Christine Boher, Vanessa Vidal, Farhad Rezai-Aria, F. Touratier
To cite this version:
E. Cabrol, Christine Boher, Vanessa Vidal, Farhad Rezai-Aria, F. Touratier. A correlation between
tribological behavior and crystal structure of cobalt-based hardfacings. Wear, Elsevier, 2019, 426-427
(Part B), pp.996-1007. �10.1016/j.wear.2019.01.091�. �hal-02100676�
A correlation between tribological behavior and crystal structure of
cobalt-based hardfacings
E. Cabrol
a,b, C. Boher
b, V. Vidal
b, F. Rezaï-Aria
b, F. Touratier
c aUniversité de Lyon, Ecole Nationale d’Ingénieurs de Saint-Etienne, LTDS, UMR CNRS 5513, France bInstitut Clément Ader (ICA), Université de Toulouse, CNRS, Mines Albi, UPS, INSA, ISAE-SUPAERO, France cAubert & Duval, FranceKeywords:
Cobalt-based hardfacings Plastic deformation mechanisms Friction coefficient evolution Phase transformation Surface texturation Work-hardening
A B S T R A C T
This paper deals with the influence of the mechanisms of plasticity on the evolution of the friction coefficient in cobalt-based hardfacings. Particularly depending on the alloying element content and so on the stacking fault energy, plasticity in Co-based alloys may occur through mechanisms involving either perfect dislocations gliding and/or partial dislocation gliding. As the coalescence of stacking faults by partial dislocations promotes the phase transformation of the Co, this study focus on the impact of this phase transformation on the evolution of the friction coefficient.
Stellite 21 (Co-27Cr-5Mo-0.25C) hardfacings deposited on a steel substrate by two different processes, namely metal inert gas (MIG) and laser, are studied. The tribological properties are evaluated with a ring on disc tribometer under high load (800 daN) and continuous sliding (5 mm/s) at room and high temperatures (450 °C and 600 °C). The wear volume is characterized by confocal microscope. From micro-hardness measurements and SEM observations the work-hardening and the plastic strain of the Tribological Transformations of Surfaces are identified in relationship with chemical analysis (by EDS). Moreover X-rays diffraction and EBSD reveal the crystal structure evolution.
As-deposited Co-based hardfacings have a face-centered cubic (FCC) structure. Meanwhile depending on the process of deposition on the steel substrate, the nominal composition of the Stellite 21 can be modified due to dilution effect. So, the iron content is found to be higher in the MIG hardfacing than in the laser one, leading to different mechanisms of plasticity, respectively by perfect dislocations gliding and by phase transformation (FCC to hexagonal closed-packed (HCP)). Moreover, a significant influence of the phase transformation on the friction coefficient has been evidenced: without phase transformation the cobalt remains in the FCC structure and the friction coefficient is stable during the test, while a decrease of its value occurs during the FCC to HCP phase transformation.
1. Introduction
The industrial context of this study is the hot forging of aeronautic parts, which are mainly made of nickel-based alloys. During forging, the surfaces of the dies are exposed to a combination of thermo-mechanical loadings: preheating of the dies themselves (around 450 °C), contact with the preheated forged metal (> 1000 °C), me-chanical pressure exerted by the press (several thousand tons) and friction induced at the interface between the die and the forged metal. In the case of hot forging of aeronautic parts, the main damage me-chanism, limiting the lifetime of the dies to a few forged parts, is the large plastic deformation in the die radii. In this context, the steel dies are commonly hardfaced, on few millimeters thick, by a cobalt-based alloy (Stellite 21) manually deposited by arc welding process (MIG).
However, this "conventional" hardfacing is not satisfactory because it is itself strongly damaged after only a few forged parts. The aim of this study is to assess the surface damage mechanisms of cobalt-based hardfacings, especially induced by plastic deformation, in order to identify improvement ways to increase the service life of hardfaced forging dies.
The cobalt-based alloys, mainly known as Stellite®, are cobalt alloys containing mainly Cr, C, W and/or Mo as alloying elements. The cobalt-based alloys are generally described as wear-resistant, corrosion-re-sistant and stable at elevated temperature. They are commonly used as hardfacing coatings of mechanical parts (forging dies, valve seats …) in order to enhance their surface properties. Cobalt-based alloys can be deposited by processes using high energy density sources such as arc welding or laser cladding.
E-mail address:[email protected](E. Cabrol).
The pure cobalt exhibits two allotropic phases: a high-temperature phase with a face-centered cubic (FCC) structure and a low temperature phase with a hexagonal closed-packed (HCP) structure. The allotropic transformation FCC-HCP of the cobalt is classified as martensitic as it takes place diffusionless, by shear mechanism. From a structural point of view, the FCC and HCP structures are closed-packed structures that only differs from the stacking order, respectively ABCABC… and ABABAB…. The FCC-HCP martensitic transformation corresponds to a change in the stacking order by introduction of an intrinsic stacking fault, via the motion of single Shockley partial dislocations, each second compact planes (i.e. each second {111} planes)[1]. The stability of the two allotropic phases is correlated to the stacking-fault energy (SFE) of the material that is the energy necessary to dissociate a perfect dis-location into two-partial Shockley disdis-locations. The SFE depends on the alloying elements: Cr, Mo, W, Si stabilizes the HCP phase (i.e. increase the equilibrium temperature) and decrease the SFE, while Fe, Ni, Mn, V, Ti, C stabilize the FCC structure (i.e. decrease the equilibrium tem-perature) and increase the SFE[2]. The equilibrium temperature for pure cobalt is about 419 °C whereas, for example, it is about 970 °C for Co-27Cr-5Mo-0.05C alloy [3]. Despite this, the cobalt-based hard-facings can retain their FCC structure after deposition (and so because of high cooling rate), even at room temperature. This metastable FCC can be mechanically transformed into HCP structure by strain-induced transformation during tribological tests. The influence of the tribolo-gical test parameters (contact pressure[4], temperature[5]) and of the chemical composition of the Stellite[6,7]on this phase transformation has been investigated on various tribological devices. Person[4]has shown that there is a threshold of contact pressure (undefined, but between 20 MPa and 2 GPa) above which the FCC to HCP phase transformation is observed. In addition, Atamert[6]and Kashani[7], have shown that the higher the iron content in the Stellite hardfacing, the lower the rate of FCC to HCP phase transformation during tribo-logical tests.
The main objective of this study is to investigate the influence of the crystal structure (FCC or HCP) on the friction coefficient evolution in cobalt-based hardfacings. For that, a commercially available Stellite 21 hardfacing (Co-27Cr-5Mo-0,25C) deposited on a steel substrate has been studied. Two welding processes having a different heat input (MIG and LASER) have been chosen to study the influence of the deposition process on the wear behavior of the cobalt-based hardfacings. The "conventional" hardfacing (Stellite 21 deposited by MIG process) has thus been compared to the Stellite 21 deposited by laser process, an emerging process in the field of hot forging. The heat input difference has produced hardfacings with different microstructure sizes (solidifi-cation rate) and different iron contents (dilution effect). It will be shown that the iron content can play a key role as it influences the plasticity mechanisms involved during tribological loads by inducing or not FCC to HCP phase transformation. This differences have made it possible to highlight a clear correlation between the cobalt phase transformation and the evolution of the friction coefficient.
2. Materials and experimental procedure
2.1. Materials
The cobalt-based hardfacings investigated in this study are com-mercially available Stellites grade 21 alloys deposited onto 40NiCrMo18 tempered martensitic tool steel plates (Table 2) using the MIG and the laser processes. The schematic illustration of the MIG and the laser processes is shown inFig. 1. For the MIG process, the filler material is on the form of a wire (Table 2) and the energy source is an electric arc. For the laser process, the filler material is on the form of powder (Table 2) and the energy source is a laser beam. The steel plates are pre-heated at 500 °C and a stress relieving has been applied after deposition (2 h/500 °C). The main deposition conditions are listed in
Table 1. After machining of the tribological samples, the thickness of
the hardfacings is between 0.5 and 2 mm for the ST21-MIG hardfacings and around 4 mm for the ST21-laser ones. The thickness variations can be attributed to the technical difficulty due to the deposition processes and to the machining of the tribological samples from the hardfaced plates. The chemical composition of the hardfacings sliding layers are given inTable 3. These results highlight, depending on the process, more or less important chemical composition modifications of the nominal chemical composition of Stellite 21. The most impacted ele-ment is iron and it can be attributed to the dilution of the steel substrate in the hardfacing during the deposition process. The high iron content of 36.5 wt% for the ST21-MIG hardfacing can be correlated with the high welding heat input (i.e. welding energy) that is equal to 578 J/mm and to the fact that it is a mono-layer hardfacing. For the ST21-laser hardfacings, the chemical composition of the external layer is sensibly the same as the nominal composition of the filler material, the iron content is less than 1 wt%. This result can be explained by the fact that (i) the welding heat input is equal to 200 J/mm, so about three times lower than for the MIG process, and that (ii) the hardfacing is multi-layer.
2.2. Tribological device
The tribological device is a high load and induction-heated trib-ometer where a level arm applies the defined normal load to a torus (R = 10 mm) on plane contact configuration (Fig. 2). The tests are per-formed under dry conditions at room temperature (RT) and high tem-peratures (450 °C and 600 °C). The upper specimens (Rings) were ma-chined from cobalt-based hardfaced plates. The lower specimens (Discs) were machined from Inconel 718, a nickel-based superalloy (Al 0.5; C 0.04; Cr 18; Fe 18.5; Mo 3; Nb 5.2; Ti 0.9; bal. Ni) with a mean hardness of 466 HV0.3. The target roughness was Ra = 0.4 µm for the rings and
Ra = 0.6 µm for the discs. The tribological test parameters are sum-marized inTable 4: the static cobalt-based hardfacings slides against a rotation nickel-based superalloy counterface at a nominal velocity of 5 mm/s and a nominal load of 8000 N for 4 m. The friction coefficient is calculated from the recording of the normal and tangential forces (measured by deformation gauge sensors) by an acquisition system written in the Labview® software, with an acquisition frequency of
10 Hz. The friction coefficient is presented as a percentage of a constant value chosen arbitrarily for confidential reasons. The evolution of the friction coefficient is plotted versus the sliding distance and is treated by a moving average (160 points) to make trends easier to see. The room temperature experiments were repeated twice in order to ensure the reliability of the tribological device.
Table 1
Main conditions of deposition.
Deposition process MIG LASER
Power (W) 5200 4000
Travel speed (mm/s) 9 20
Metal flow rate (g/s) 1,56 0,58
Welding energy (J/mm) 578 200
Number of layer Mono-layer Multi-layer
Table 2
Chemical composition of base material (40NiCrMo18) and filler materials (Stellite 21), as given by suppliers.
Co Cr Mo Ni Mn Fe Si C
40NiCrMo18 steel plate
substrate – 1.5 0.5 4.5 – Bal. – 0.4
Stellite 21 wire filler Bal. 28.0 5.0 2.4 1.0 3.5 1.3 0.3
2.3. Characterizations 2.3.1. Wear investigations
The wear volumes have been quantified by surface topography measurements using a confocal microscope (Altisurf520®from Altimet)
with a chromatic confocal probe (measure range of 3 mm) and an axial resolution of 90 nm. Measurements have been performed before and after tribological tests in order to subtract the initial form of the sample linked to the radius of curvature. On each sample, four zones of 5 mm (step of 20 µm) × 11 mm (step of 5 µm) are scanned. The scanned surfaces are then treated with the software Altimap®to extract the wear
profile and the wear volume is finally calculated by multiplying the medium area of the wear profiles by the circumference of the wear track.
2.3.2. Microstructure investigations and chemical composition measurements
The microstructure characterizations have been performed by scanning electron microscopy (SEM) on a NOVANANOSEM™ 450 from FEI. The samples have been cross sectioned parallel to the sliding di-rection, mounted in an electrically conducting material (KonductoMet®), grinded from 80 to 1200 grit paper, polished with
diamond particles down to 1 µm. Finally, the microstructure has been revealed by an electrolytic etching with a 50 vol% hydrochloric acid and 50%vol ethanol reagent by using 0.8 A of current for 20 s.
The chemical compositions have been measured in the upper layer (i.e. the sliding layer) of the samples by EDS. The analyses have been done in cross-sections, on an area of 120 µm × 25 µm, under an ac-celerating voltage of 15 kV.
2.3.3. Hardness evaluations and mapping
The hardfacings work-hardening has been measured by micro-hardness mapping (Vickers, 300 g) on cross-section perpendicular to the sliding direction. Filiations have been performed in the plastically sheared area with an increment step of 100 µm in depth every 250 µm in width. The first measurement is located at 30 µm from the surface because of the size of the Vickers indentations. The presented results are the average hardness profile of the cross-sections under the wear track.
Fig. 1. Schematic illustration of the deposition processes: (a) MIG[8]and (b) LASER[9]. Table 3
Chemical composition of the hardfacings sliding surfaces (measured post mortem, in cross-sections, by EDS on areas of 120 µm × 25 µm; Carbon is not measurable by EDS).
Co Cr Mo Ni Mn Fe Si
ST21-MIG Bal. 19.0 2.9 3.0 1.2 36.5 0.9
ST21-laser Bal. 26.6 4.6 2.5 0.8 0.5 0.9
Fig. 2. Side view (a) and plan view (b) of the contact geometry between the ring (torus or horizontal cylinder shape) and the disc (plan shape).
Table 4
Tribological tests parameters.
Normal load Hertz contact pressure Sliding speed Sliding distance Temperature
N MPa mm/s Disc rotation rpm m Number of turns of the rotating disc °C
2.3.4. Crystallographic structure investigations
The crystallographic analyses (crystal structure and texture) have been achieved by X-ray diffraction (XRD) and electron backscatter diffraction (EBSD) techniques.
The XRD analyzes have been performed on top surface of the hardfacings to achieve a global measurement of the crystallographic phases and the grains orientations on an analyzed depth estimated to 10 µm. Classical θ-θ measurements and pole figure measurements have been performed on a PANalytical X′Pert Pro diffractometer with a co-balt anticathode (λKα1 = 1,789 Å) using an iron filter to limit the fluorescence effect of the cobalt.
As a complement to XRD results, EBSD analyzes have been per-formed on cross-sections parallel to the sliding direction to focus on the gradients of both the FCC to HCP phase transformation and the pre-ferred grain orientation on the 100 first micrometers under the sliding surface. The EBSD measurements have been performed on a SUPRA 55-VP SEM from Zeiss and the data have been post-processed by different software from Oxford Instruments: Aztec®for indexation, Mambo® for
inverse pole figures and Tango®for orientation maps. It can be noted
that in order to minimize the induced residual deformation by me-chanical preparation of the EBSD samples, a vibratory polishing has been performed on colloidal silica during 8 h.
3. Results
3.1. Characterization of the Co-hardfacings before tribological load 3.1.1. Microstructure investigations
The microstructures of the two hardfacings are given inFig. 3, as observed by SEM on a cross-section perpendicular to the substrate-hardfacing interface. Both substrate-hardfacings have shown morphologically textured columnar grains with dendritic microstructures. This mor-phological texture is characteristic of the welded hardfacings and re-sults from the thermal gradient of solidification inherent to the welding processes[10]. The comparison of the MIG and laser hardfacings mi-crostructures reveals different characteristic sizes of the primary den-drites widths, respectively 13 µm and 6 µm. This difference can be correlated with the deposition rate: the higher the deposition rate, the thinner the microstructure (faster solidification rate). At a higher magnification, it is observed that the dendritic matrix is surrounded by interdendritic carbides (Fig. 4) which are essentially chromium-based (EDS analyses).
3.1.2. Hardness evaluations
The mean initial hardness is 307 HV0.3 for the ST21-MIG
hard-facings and 428 HV0.3for the ST21-laser hardfacings. The deposition
process, as discussed in the previous paragraph, has induced different microstructures sizes that can affect the hardness due to the Hall-Petch effect. The ST21-laser hardfacings (thin microstructure) have a higher hardness than the ST21-MIG hardfacings (larger microstructure). The iron content (dilution effect) is also to be taken into account to explain this difference in initial hardness of the two hardfacings: the higher the iron content, the lower the content of carbide-forming elements (Cr, Mo). These elements impact the structural hardness and the solid so-lution strengthening[11]. By decreasing their content (due to dilution), lower is the hardness.
3.1.3. Crystallographic structure investigations
According to classical θ-θ XRD measurements, the as-deposited hardfacings have a FCC crystallographic structure, regardless of the deposition processing (Fig. 5). According to the Co-Cr binary equili-brium diagram for a chromium content between 20 and 30 wt%, the RT stable phase of the cobalt has a HCP structure[12]. The presence of such “metastable” FCC phase has also been quoted by several authors
[4,13,14]. It has been attributed to a non-equilibrium solidification due to the high cooling rate of the deposition processes[15]. The compar-ison of hardfacings XRD patterns with the FCC-Co JCPDS file which is for randomly oriented grains has shown significant differences in the
Fig. 3. Microstructures of the two investigated Stellite 21 hardfacings as seen by SEM: (a) ST21-MIG hardfacing, (b) ST21-laser hardfacing.
Fig. 4. Description of the characteristic microstructure of the Stellite 21 hard-facings as seen by SEM, example of the ST21-MIG hardfacing.
relative intensities of the diffraction peaks. These differences highlight a preferred crystallographic orientation of the as-deposited hardfacings. As also been reported by other authors[5,15], the {200}-FCC planes are preferentially oriented parallel to the sliding surface (i.e. perpendicular to the substrate-hardfacing interface). The growth direction of den-drites is generally < 100 > in FCC structures. The grains oriented with the < 100 > direction close to the heat flow extraction direction will grow fastest and hinder the growth of other grains, leading to the preferred crystallographic orientation.
The preferred orientations of the as-deposited hardfacings suggested by θ-θ measurements have been confirmed by pole figure measure-ments (Fig. 6). For both hardfacings, the {200}-FCC pole figures (Fig. 6b, d) have shown a preferred orientation of the {200}-FCC planes
almost parallels to the sliding surface. The normalized intensities of the poles have shown that the preferred orientation is more significant for the ST21-laser hardfacings (≈14) than for the ST21-MIG ones (≈11). Thus, the homogeneity of the melting pool is more or less important depending on the deposition process. This has been confirmed by the dispersion of the {200}-FCC planes which is particularly small for the ST21-laser hardfacings, indicating that the grains have the most pro-nounced preferred orientation. This can also be correlated to the soli-dification rate, the latter being faster for the laser process. Whatever the deposition process, a slight inclination of about 10° of the {200}-FCC planes with respect to the sliding surface can be noted. These inclina-tion can be explained by the inclinainclina-tion of the torch and so of the heat flux direction, but also by the solidification isotherms in the melting pool generated by the advancement of the torch head that promote the preferred grain growth “parallel” to the welding direction. This type of inclination has also been observed by Chassignole in the context of austenitic stainless steel welds of piping systems[16]. The {111}-FCC pole figures (Fig. 6a, c) have shown no preferred orientation indicating a randomly distribution of the grains in the lateral direction.
3.2. Characterization of the Co-hardfacings after tribological load 3.2.1. Friction coefficient
3.2.1.1. Evolution of the friction coefficient. The evolution of the friction
coefficient versus the sliding distance (Fig. 7) exhibits behaviors extremely different from the surfaces of the two studied hardfacings, MIG and LASER, in response to a tribological loading. Thus, the evolution of the friction coefficient versus sliding distance makes it
Fig. 5. XRD patterns of the ST21-MIG and ST21-laser hardfacings compared with JCPDS files of FCC-Co and HCP-Co.
possible to identify two types of behavior:
– A stable friction coefficient during all the friction tests: the ST21-MIG hardfacings, whatever the test temperature, exhibit a friction coefficient rapidly stabilized with respect to the sliding distance. – An evolution of the friction coefficient during the friction tests: A
first period with continuously decreasing friction coefficient fol-lowed by a constant friction coefficient for the remainder of the sliding distance: the ST21-laser hardfacings, whatever the test temperature, exhibit an immediate and progressive drop in the friction coefficient followed by a steady-state value. The steady-state value has been reached for sliding distances lower than 2 m.
3.2.1.2. Value of the steady-state friction coefficient. The value of the
steady state friction coefficient is depending on both the hardfacings process and the test temperature, with some differences between these two parameters (Fig. 8).
For the ST21-MIG hardfacings, high temperature friction coeffi-cients are higher than RT one. This behavior is quite different for the ST21-laser hardfacings, where high temperature friction coefficients are lower than RT one. No significant differences can be underlined for the effect between the two high temperatures of 450 °C and 600 °C.
3.2.2. Wear volume
The wear volume of the hardfacings is presented versus deposition process and versus temperature inFig. 9. The ST21-MIG hardfacings exhibit a higher wear volume than the ST21-laser hardfacings. This wear volume evolution could be related to the initial microstructure fineness and hardness: the thinner and harder the microstructure, the lower the wear volume.
It can also be observed that the wear volume tends to increase with the temperature for the ST21-MIG hardfacings and to decrease with the temperature for the LASER-hardfacings. The evolutions of wear vo-lumes are close from the evolutions of the steady friction coefficients. As previously, these values are depending on both hardfacing deposi-tion condideposi-tions and on test temperatures with small differences between the high temperature tests.
3.2.3. Cross-section observations
After tribological tests, microstructural observations have been carried out by SEM, in cross-sections of the rings, in the direction parallel to the sliding. The plastic deformation of the Stellite is well demonstrated, with a reorientation of the dendrites according to the sliding direction (Fig. 10, Fig. 11). Whatever the hardfacing, at the extreme surface of the wear track, the dendrites are sheared and plastic deformation is observed for all test parameters.
The plastic deformation of dendrites is more important for ST21-MIG than for ST21-LASER. For ST21-ST21-MIG hardfacings, the dendrites are completely “rolled” in extreme surface, their principal axes are no longer perpendicular, but are parallel to the sliding surface and the width of the dendrites becomes submicronic. The deformation has been estimated at several hundreds of percent. Regarding the affected depth, the micrographic observations show a plastic strain evolution of the dendritic matrix over less than one hundred first micrometers.
At higher magnification, it can be observed that the plastic de-formation is totally supported by the dendritic matrix and that the in-terdendritic carbides are totally or partially sheared. The carbides and/ or debris of carbides are thus more or less “embedded” in the plastic flow and become markers of the plastic deformation by shearing. On the firsts micrometers under the contact surface the microstructure of the hardfacing is almost no longer recognizable.
From these observations, it can be concluded that one of the me-chanism of accommodation of the velocity differences in the contact
Fig. 7. Friction coefficient versus sliding distance of (a) ST21-MIG hardfacings and (b) ST21-laser hardfacings.
Fig. 8. Steady-state friction coefficient of the ST21-MIG and the ST21-laser hardfacings at different test temperature.
between the static ring and the rotating disc is the plastic deformation of the dendrites and the interdendritic spaces under the shearing effect.
3.2.4. Hardness evolution and affected depth
The work-hardening has been determined by harness mappings (Vickers, 300 g). The measurements verify that, whatever the hard-facing deposition process, the Stellites are work-hardened under tri-bological load, through the width of the wear track. Moreover, ac-cording to the average hardness profiles under the wear track (Fig. 12), a gradient of hardness is observed on the first 500 µm from the sliding surfaces, independently of the test parameters (Fig. 12).
In the upper part of the TTS, the hardness reached maximum values of about 600 HV0.3for the ST21-MIG hardfacings and about 700 HV0.3
for the ST21-laser hardfacings. These values seem to correspond to the “ultimate” hardness of the hardfacings before emission of wear particles
in the contact. For both hardfacings, a strain-hardening is observed and the affected depth from the sliding surface is about 500 µm. The dif-ference of “ultimate” hardness can be attributed to several elements: the microstructure size of the hardfacings, the iron content on the hardfacing and/or the plasticity mechanisms involved during tribolo-gical test.
Contrary to the SEM observations, presented earlier, the hardness measurements reflect more accurately the thickness actually affected in the regions beneath the sliding surface (Fig. 13).
3.2.5. Phase analyses and preferred orientation
3.2.5.1. Phase analyses. The variations of tribological characteristics,
such as friction coefficient evolution, wear rates, work-hardening variations and also cross-section observations have conducted to be interested more precisely on the modification of the phases of the
Fig. 10. Plastic deformation of the upper part of the rings observed in cross-section by SEM for (a) ST21-MIG hardfacing and (b) ST21-laser hardfacing; Examples of the tests performed at 450 °C.
Fig. 11. Plastic deformation of the upper part of the rings observed in cross-section by SEM for (a) ST21-MIG hardfacing and (b) ST21-laser hardfacing; Examples of the tests performed at 450 °C.
surfaces of the hardfacings under tribological loadings.
As it was mentioned, the initial structure of the hardfacings is “metastable” FCC type. This structure is due to the fast solidification rate inherent to the deposition process. The XRD analyses realized in top surface, in the wear track of the samples, have shown different phases after tribological tests, depending on the deposition process (Fig. 14). In the Stellite 21 deposited by MIG process (Fig. 14a), for all test temperatures, only the FCC-Co phase has been observed. In the Stellite 21 deposited by laser process (Fig. 14b), for all test tempera-tures, only the HCP-Co phase has been observed. For ST21-laser hard-facings, the FCC to HCP phase transformation has therefore been pro-duced under tribological loadings regardless of the test temperature.
3.2.5.2. Grain orientation
3.2.5.2.1. XRD analyses in θ/θ configuration. The study of relative
intensities of diffraction peaks has given information on the preferential orientation of the grains after tribological loads.
Concerning the hardfacings retaining a FCC structure after tribolo-gical test (i.e. ST21-MIG), the relative intensities of the five firsts dif-fraction peaks have been calculated and compared with the JCPDS-FCC-Co (Fig. 15). The significant increase in the relative intensities of some diffraction peaks compared to the JCPDS-FCC-Co has revealed preferred orientation of the grains (Fig. 15). These results confirm that before tribological test, the hardfacings have an initial preferred or-ientation with the {200}-FCC planes predominantly parallel to the sliding surface (as already revealed by pole figure measurement). These
results have also shown significant modifications about the grain or-ientation after tribological tests. Indeed, most of the grains are oriented with their {111}-FCC planes parallel to the sliding surfaces. Note that these latter belongs to the main slip planes (i.e. the highest atomic density planes) in a FCC structure. The grains orientations evolution under tribological loadings corresponds to the self-accommodation of the FCC slip planes (i.e. {111}-FCC planes) along the sliding surface and can be directly linked to dislocation activity.
Concerning the hardfacings transformed from FCC to HCP phase during tribological test (i.e. ST21-LASER), the relative intensities of the five firsts diffraction peaks have been calculated and compared with the JCPDS-HCP-Co (Fig. 16). The differences of relative intensities peaks have highlighted that the HCP phase induced during tribological tests has a preferred crystallographic orientation. Indeed, the majority of the crystallographic planes that are parallel to the sliding surfaces are {0002}-HCP.
These classic XRD measurements have shown significant evolutions of the preferred orientation of the grains under friction loading. Whatever the phase present at the extreme surface after tribological test, FCC or HCP, the highest atomic density planes are parallel to the sliding surface, respectively {111}-FCC and {0002}-HCP.
3.2.5.2.2. EBSD analyses. EBSD investigations have been carried
out on ST21-LASER hardfacings after tribological test only at RT. The analyzed area is situated on the firsts 90 µm under the sliding surface (Fig. 17).
3.2.5.2.3. Band contrast map. The band contrast map is Fig. 12. Evolution of the hardness of the hardfacings under tribological loads for (a) ST21-MIG hardfacing and (b) ST21-laser hardfacings.
Fig. 13. Comparison of the affected depth by plastic deformation between (a) hardness measurements and (b) SEM observations (example of the Stellite 21 deposited by laser process with the test at 450 °C).
representative of the presence of defects (such as dislocations, stacking defects, grain boundaries, etc.) in the material (the more defects there are, the darker the color). After tribological test, the band contrast map (Fig. 18-a) has revealed a large number of defects that cause significant difficulties for extreme surface analysis despite careful sample preparation. These defects can be related to the intrinsic work-hardening of the material. They induce indexation difficulties on the first 10–20 µm under the sliding surface (Fig. 18-a). The evolution of the indexing rate versus depth (Fig. 18-b) has confirmed the presence of defects in the extreme surface of the hardfacing (less than 10% of indexation in the first 20 µm). The indexation rate is increasing with the depth and 100% indexation is obtained at about 90 µm from the sliding
surface. This observation can be considered as the signature of a gradient of defects on the tribological surfaces of the hardfacings.
3.2.5.2.4. Phase contrast map. The phase contrast map (Fig. 19) has revealed the presence of the FCC and HCP phases and has shown their distribution in the Tribologically Transformed Surface (TTS) of the sample. An FCC to HCP phase transformation evolution is observed in the TTS. The HCP-Co phase content as a function of depth (Fig. 20) has shown that the FCC to HCP strain-induced phase transformation is almost totally achieved (> 90%) on the first 20 µm. Although the indexation rate is extremely low in this analyses area (Fig. 18), based on the results of conventional XRD (which analyzed a depth of about 10 µm), it can be considered that the HCP-Co content is representative of reality. The HCP-Co phase content decreases between 20 µm and 70 µm and the initial FCC-Co structure is found at a depth of about 70 µm.
3.2.5.2.5. Crystallographic orientation maps. For these maps, the
chosen axes are the same as the SEM image axes (Fig. 17). The X axis corresponds to the horizontal axis of the image (sliding direction), the Y axis corresponds to the vertical axis of the image (normal to the friction surface) and the Z axis corresponds to the normal axis to the image (normal to the direction of slip).
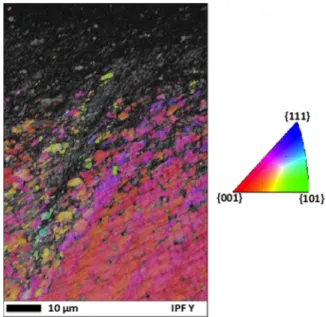
The orientation of the FCC-Co and the HCP-Co are represented using Inverse Pole Figures which shows the distribution of crystallographic directions parallel to certain sample directions. For the FCC-Co, the IPF Y is presented onFig. 21and for the HCP-Co, the IPF X, Y and Z are presented onFig. 22.
For the retained FCC phase, on the first 90 µm below the friction surface, the grains have their planes {200}-FCC (noted {001} in the IPF) mainly parallel to the sliding surface. A slight crystallographic
Fig. 14. XRD patterns of worn surfaces compared to JCPDS files of FCC-Co and HCP-Co for (a) ST21-MIG hardfacings and (b) ST21-laser hardfacings.
Fig. 15. Comparison of the relative intensity of the diffraction peaks between the JCPDS file of FCC-Co, the ST21-MIG hardfacing before tribological test and the ST21-MIG hardfacing after tribological test. (Example of RT tribological test).
Fig. 16. Comparison of the relative intensity of the diffraction peaks between the JCPDS file of FCC-Co, the ST21-LASER hardfacing before tribological test and the ST21-LASER hardfacing after tribological test. (Example of RT test).
reorientation can be observed with a grain orientation intermediate between the {200}-FCC and the {111} planes parallel to the sliding surface (Fig. 21).
Fig. 22shows that the HCP grains have a preferred orientation along the three axes X, Y and Z. Therefore, the grains seem to be all oriented in a similar way with respect to the sliding load. As schematized on
Fig. 23the {0001}-HCP planes (i.e. the basal planes, noted {001} in the IPF) are preferentially oriented parallel to the sliding surface (Fig. 22 -IPF Y) and the {01−10} planes (i.e. the prismatic planes, noted {010} in the IPF) are preferentially oriented perpendicular to radial direction (Fig. 22-IPF Z).
4. Discussion
As shown in this study, the FCC to HCP phase transformation (i.e. martensitic transformation) of the cobalt can be achieved or not on the
Fig. 18. Comparison between (a) the EBSD band contrast map and (b) the indexation rate versus the depth under the sliding surface.
Fig. 19. EBSD phase map showing the FCC-Co phase in blue and the HCP-Co phase in red.
Fig. 20. Evolution of the HCP-Co content versus depth under the sliding sur-face.
Tribologically Transformed Surface (TTS). Indeed, as a result of the friction, the surface crystal structure of ST21-MIG hardfacings remained FCC while the surface crystal structure of ST21-laser hardfacings transformed from the initial FCC structure into the HCP structure. As the iron is known to have a strong influence on the SFE, stabilizing the FCC structure[2], these behavior differences can be correlated with the iron content in the hardfacings (dilution effect, number of layers).
4.1. Correlation between friction coefficient and crystal structure in the TTS
The friction coefficient evolutions versus sliding distance has shown two extremely different behaviors. A stable friction coefficient has been observed for the ST21-MIG while a decreasing and then stabilized friction coefficient has been observed for the ST21-laser hardfacings. Due to the crystal phase analyzes these differences in friction coefficient evolution can be related to the crystal structure of the TTS. Indeed, a stable friction coefficient could be associated with a FCC structure of the TTS while a friction coefficient decrease could be associated with a HCP structure of the TTS. This hypothesis has been reinforced by ad-ditional friction tests performed on a slightly different hardfacing (Stellite 6) deposited by laser process. Five tribological tests have been performed in the same conditions (Table 4at RT) and they have been stopped at different friction coefficient values. The quantification of the crystal structures in the TTS has been performed by using classical θ-θ measurement and the Rietveld method[17]. The results (Fig. 24) have demonstrated a very good relationship between the decrease of the friction coefficient and the HC phase content in TTS. So, the decrease of the friction coefficient can be correlated to the progressive martensitic transformation of the TTS. When the upper layers of the TTS are
completely transformed into HCP, there is no more decrease of the friction coefficient, i.e. the friction coefficient is constant at low values for the remainder sliding distance. As the FCC-Co has twelve operating slip systems while the HCP-Co has three operating slip systems (the c/a ratio is more than 1.62 for HCP-Co, so, it should exhibit basal slip), the difference of tribological behavior of the FCC and HCP crystal structure of the cobalt is believed to be related to the differences in slip behavior. The lower number of slip systems for the HCP structure of the cobalt than for the FCC structure of the cobalt may induce less “surface re-activity” under friction stresses.
The results have also shown that both hardfacings undergo a strong grain reorientation under friction loadings. Concerning the ST21-MIG hardfacings, remaining their FCC structure, the grains orientations evolution under tribological load corresponds to the alignment of the {111}-FCC planes (i.e. the main FCC slip planes) with the sliding sur-face. This grain reorientation can be directly linked to dislocations ac-tivity. Concerning the ST21-laser hardfacings, that undergo an FCC to HCP phase transformation, a texture is also observed with the align-ment of the {0002}-HCP planes with the sliding surface. This grain orientation in the TTS, also well demonstrated by Person in ST21-laser hardfacings by TEM observations[4], could be explained by the or-ientation relation between FCC and HCP structure during the phase transformation. The latter is given by the Shoji-Nichiyama equation: {111}FCC// {0002}HCP: < 110 >FCC// < 1120 >HCP. It would mean
that before phase transformation, the FCC structure had already its grains reoriented with the {111}-FCC planes parallel to the sliding
Fig. 22. IPF maps of the HCP-Co.
Fig. 23. Scheme of the preferred orientation of the HCP grains at the sliding surfaces of ST21-laser hardfacings.
surface. So, before the crystallographic transformation, the grains had enough time to deform plastically by dislocations slip and thus to change orientation. The phase transformation is then achieved and the new phase has the same orientation of the FCC parent phase. Plastic deformation of the induced HCP phase seems to be too low to be re-sponsible to the observed grain reorientation. It can be noted that no impact of the grain reorientation has been observed on the friction coefficient evolution. The latter is stable versus sliding distance for the ST21-MIG hardfacings despite a strong grain reorientation.
The temperature influence on the steady-state coefficient value has been studied in view of the crystal structure. The steady-state friction coefficient is lower at room temperature (≈52.7%) than at high tem-perature (≈73.7%) for an FCC structure. Thus, the FCC crystal-lographic structure “slides” better at room temperature then at high temperature. In contrary, the friction coefficient at room temperature (≈28.6%) is slightly higher than the friction coefficient at high tem-perature (≈39.9%). Thus, the HCP structure “slides” better at high temperature than at room temperature. However, the influence of the test temperature is less pronounced for the HCP structure than for the FCC structure.
4.2. Correlation between wear and crystal structure in the TTS
Concerning the plastic deformation, the higher ductility of the ST21-MIG hardfacings than the ST21-laser can also be explained thanks to crystallographic characterizations. As the FCC structure is well known to have more slip systems than the HCP structure, the fact that the ST21-MIG hardfacings stay under FCC structure could be re-sponsible of a higher ductility and so an easiest and more important plastic deformation. By the way, the high texture of the TTS goes also in the direction of plasticity via essentially the sliding of perfect disloca-tions. Concerning the ST21-laser hardfacings, the plastic deformation would be less important because once the FCC to HCP transformation is achieved, the mechanisms of plasticity are less numerous (because HCP has much less sliding systems than FCC).
In parallel, the work-hardening for the ST21-MIG hardfacings seems to be mainly due to the multiplication and entanglement of dislocations in the FCC structure. The microstructure refinement could also be re-sponsible of the increase of the hardness. For the ST21-laser, the work-hardening can also be correlated to the multiplication of dislocations in the FCC phase and to the presence of HCP phase. The latter could limit the hardfacing ductility due to low slip systems. A good wear resistance is so observed for the ST21-laser that is less deformed under friction loading.
5. Conclusions
The tribological behavior of cobalt-based hardfacings has been in-vestigated under sliding wear on a monolayer MIG hardfacing and a multilayer laser hardfacing, differing mainly in their iron content. Based on the results obtained in this work, the following conclusions can be drawn:
– Particularly depending on the iron content, and so on the stacking-fault energy, the plasticity mechanisms involved can be perfect dislocation gliding and/or FCC to HCP phase transformation (i.e.
martensitic transformation).
– The work-hardening and the grain reorientation of the Tribologically Transformed Surfaces (TTS) can be correlated to plasticity mechanisms by perfect dislocation gliding.
– A relationship has been demonstrated between the friction coeffi-cient evolution and the FCC to HCP phase transformation (i.e. the HCP content in the TTS) in cobalt-based hardfacings.
– The HCP-Co crystal structure exhibits a lower friction coefficient, a lower ductility and a lower wear volume than the FCC-Co structure.
Acknowledgements
This work is part of ROOF2 project. It is a FUI12 project labialised by the competitiveness clusters ViaMeca, Aerospace Valley and the European ceramics centre. The ROOF2 project is funded by the Auvergne FEDER, the Auvergne Region, the Allier General Council, the FUI, the Saint-Etienne Metropolis, the Indre General Council, the Limousin Region and the Limousin FEDER.
References
[1] G.B. Olson, M. Cohen, A general mechanism of martensitic nucleation: Part I. General concepts and the FCC→HCP transformation, Metall. Trans. A 7A (1976) 1897–1904,https://doi.org/10.1007/BF02659822.
[2] C.T. Sims, N.S. Stoloff, W.C. Hagel, Superalloys II, Wiley, New York, 1987. [3] A.J. Saldívar Garciá, A.M. Medrano, A.S. Rodríguez, Formation of hcp martensite
during the isothermal aging of an fcc Co-27Cr-5Mo-0.05C orthopedic implant alloy, Metall. Mater. Trans. A 30 (5) (1999) 1177–1184, https://doi.org/10.1007/s11661-999-0267-6.
[4] D.H.E. Persson, On the Mechanisms Behind the Tribological Performance of Stellites (Ph.D. Dissertation), (2005).
[5] H. Kashani, A. Amadeh, A. Ohadizadeh, Effect of temperature on the strain induced on the strain induced γ → ɛ phase transformation in Stellite 21 during wear test, Mater. Sci. Eng. A 435 (2006) 474–477.
[6] S. Atamert, H.K.D.H. Bhadeshia, Comparison of the microstructures and abrasive wear properties of stellite hardfacing alloys deposited by arc welding and laser cladding, Metall. Trans. A 20A (1989) 1037–1054,https://doi.org/10.1007/ BF02650140.
[7] H. Kashani, M. Sadeghi Laridjani, A. Amadeh, M. Khodagholi, S. Ahmadzadeh, The influence of volumetric dilution on the strain induced γ → ɛ martensitic transfor-mation in GTAW processed Co–Cr–Mo alloy, Mater. Sci. Eng. A 478 (1–2) (2008) 38–42,https://doi.org/10.1016/j.msea.2007.05.061.
[8] K. Anderson, Stick vs. MIG vs. TIG: Which Process is Right For You?, Welding Supplies from IOC, 2015. Retrieved July 2018 from 〈https://www.
weldingsuppliesfromioc.com/blog/stick-vs-mig-vs-tig-which-process-is-right-for-you/〉.
[9] F. Geyer, Laser Metal Deposition & Laser Metal Fusion: Comparison of Processes & Their Uses, LasersTodayTM, 2016. Retrieved July 2018 from 〈https://www. laserstoday.com/2016/05/laser-metal-deposition-laser-metal-fusion-comparison-of-processes-their-uses/〉.
[10] G. Lesoult, Solidification – Cristallisation et microstructures, Techniques de l’ingénieur, Paris, 1986.
[11] J.R. Davis, Nickel, Cobalt, and Their Alloys, AMS specialty handbook®, USA, 2000.
[12]K. Ishida, T. Nishizawa, The Co-Cr (cobalt-chromium) system, Bull. Alloy Phase Diagr. 11 (4) (1990) 357–370.
[13] D.H.E. Persson, Antigalling and low friction properties of a laser processed Co-based material, J. Laser Appl. 15 (2) (2003) 115–119,https://doi.org/10.2351/1. 1514218.
[14]L. Iordache, Analyse tribo-métallurgique des rechargements base cobalt par fusion soudage d′outillages à chaud (Ph.D.), (2006).
[15] M.L. Capp, J.M. Rigsbee, Laser processing of plasma-sprayed coatings, Mater. Sci. Eng. 62 (1984) 49–56,https://doi.org/10.1016/0025-5416(84)90266-0. [16]B. Chassignole, Influence de la structure métallurgique des soudures en acier
in-oxydable austénitique sur le contrôle non destructive par ultrasons (Ph.D.), (2000). [17]H.M. Rietveld, A profile refinement method for nuclear and magnetic structures, J.
![Fig. 1. Schematic illustration of the deposition processes: (a) MIG [8] and (b) LASER [9].](https://thumb-eu.123doks.com/thumbv2/123doknet/11621463.304484/4.892.161.728.118.346/fig-schematic-illustration-deposition-processes-mig-b-laser.webp)