HAL Id: hal-01381243
https://hal.inria.fr/hal-01381243
Submitted on 14 Oct 2016
HAL is a multi-disciplinary open access
archive for the deposit and dissemination of
sci-entific research documents, whether they are
pub-lished or not. The documents may come from
teaching and research institutions in France or
abroad, or from public or private research centers.
L’archive ouverte pluridisciplinaire HAL, est
destinée au dépôt et à la diffusion de documents
scientifiques de niveau recherche, publiés ou non,
émanant des établissements d’enseignement et de
recherche français ou étrangers, des laboratoires
publics ou privés.
VR-based Operating Modes and Metaphors for
Collaborative Ergonomic Design of Industrial
Workstations
Huyen Nguyen, Charles Pontonnier, Simon Hilt, Thierry Duval, Georges
Dumont
To cite this version:
Huyen Nguyen, Charles Pontonnier, Simon Hilt, Thierry Duval, Georges Dumont. VR-based
Oper-ating Modes and Metaphors for Collaborative Ergonomic Design of Industrial Workstations. Journal
on Multimodal User Interfaces, Springer, 2016, 11 (1), pp.97-111. �10.1007/s12193-016-0231-x�.
�hal-01381243�
1
VR-based Operating Modes and Metaphors for Collaborative
Ergonomic Design of Industrial Workstations
Huyen Nguyen1,2, Charles Pontonnier2,3,4, Simon Hilt3, Thierry Duval5, Georges Dumont2,3, 1 Data61, Commonwealth Scientific and Industrial Research Organisation (CSIRO), Sandy Bay, Tasmania, Australia
2 IRISA/INRIA, Rennes, France
3 Ecole Normale Supérieure de Rennes, UBL, France 4 Ecoles de Saint-Cyr Coëtquidan, Guer, France
5 Institut Mines-Télécom / Télécom Bretagne / Lab-STICC, Brest, France * huyen.nguyen@data61.csiro.au
Abstract
The aim of this paper is to evaluate two new operating design modes and their collaborative metaphors enabling two actors, a design engineer and an end-user, to work jointly in a collabora-tive virtual environment for workstation design. The two operating design modes that correspond to two different design paradigms include : direct design mode (the design engineer manipulates objects while the end-user specifies their activity constraints) and supervised design mode (the end-user manipulates objects while the design engineer specifies their process constraints). The corresponding collaborative metaphors enable the two actors to manipulate objects while one (the design engineer) can express process constraints and the other (the end-user) can express activity constraints. The usability evaluation of the modes and metaphors consisted in placing a worksta-tion design element on a digital workstaworksta-tion mock-up where a trade-off was to be found between process constraints and activity constraints. The results show that if we consider the completion time as the most important criterion to achieve, the direct design mode must be favoured. Other-wise, if the activity constraints are predominant, the supervised design mode must be favoured. In any case, the addition of an ergonomist’s point of view is supported and warranted in order to enhance the effectiveness of the system.
Keywords Industrial Ergonomics - Virtual Reality - Computer-Supported Cooperative Work - Physical Risk Factors - Human Factors
1
Introduction
Workstation design and ergonomic evaluation are natural falls of Virtual Environments (VE) and Virtual Reality (VR) techniques [51]. Despite some existing technical limitations such as latency or cyber-sickness [34], the maturation of new technologies and the significant enhancement of computational power have become an important support in the early stage of workstation design. Indeed, it has already been shown that analysing physical risk factors directly on the Digital Mock-Up (DMU) of a workstation was cost-effective and efficient to improve its ergonomics without threatening the process productivity [5, 26]. In a similar way, the use of VR for production and workstation design has been successfully applied and tends to become a standard design tool as in the case of Computer-Aided Design (CAD) [47, 48].
However, such VR-based frameworks still raise scientific issues. First, the reliability of the analysis of the physical risk factors obtained from the virtual copy of a work task is still questio-nable [22, 39, 42, 45, 46, 50]. Second, there is a lack of tools enabling a consistent remote interaction between different actors, e.g. end-users (industrial operators), design engineers and ergonomists, during a design process.
Recent trends in Collaborative Virtual Environments (CVE) open promising ways to drasti-cally enhance the use of such tools in a design process. Interactive collaboration is a key factor
2
of an efficient design [44] and favours the development of VR-based collaborative frameworks. Re-cently, CVE have exhibited a great potential of application in numerous domains such as scientific visualization, product design, rehabilitation, architecture [6, 37].
Indeed, CVE have the potential to be used to remotely animate ergonomic design sessions. Nevertheless, offering an opportunity to distant users to interact with each other implies the de-velopment of new information representation and new interaction metaphors. These metaphors correspond to the specific modes of ergonomic evaluation and design that can be realized in a collaborative way [14, 40, 41]. It also requires that the CVE architecture correctly handles the multiple shared representations of the same information [33].
In this paper, we aim at evaluating the usability of two new operating design modes and their collaborative metaphors enabling two actors, a design engineer and an end-user, to work jointly in a CVE. After presenting a state of the art about collaborative workstation design in section 2, we introduce in section 3.1 the developed CVE, design modes and collaborative metaphors as well as three design roles : end-user, design engineer and ergonomist. In section 3.2, we describe the usability evaluation of both the operating design modes and the collaborative metaphors between two of the design actors : the end-user and the design engineer. The experimental situation consisted in placing a workstation design element on a digital workstation mock-up where a trade-off was to be found between process constraints validated by the design engineer and activity constraints validated by the end-user. The evaluation has been run with non-expert users. Results of the evaluation of the usability of the direct design mode and the supervised design mode are presented and discussed in section 4, and a conclusion in section 5 gives some perspectives to our work.
2
Related Work
Technological advances and shifting interests of researchers give Computer Supported Collabo-rative Work potential and flexible tools to build a shared environment where end-users, designers, scientific experts, stakeholders, and other domain-related users, can meet, communicate, interact with others, and coordinate their activities. It has been already stated that collaborative design mixing end-users, designers and other roles has a positive impact on the definition and design of products, e.g. in the case of a VR-based software [30] or in a more general way [4].
In virtual assembly planning systems, collaboration mechanisms can be either a client-server based framework to facilitate assembly design activities [35] or a collaborative virtual environment as a global shared medium for evaluation of an assembly design. Moreover, recent advances in VR make it possible to interactively assemble and disassemble virtual components and modules at a draft design stage in the assembly design process [24, 25, 52]. However, although many actors are involved in an assembly planning, design engineers and ergonomists can hardly contribute to the evaluation of operational comfort in a long-time working condition of the industrial operators (end-users) due to the lack of collaborative tools in virtual assembly systems [8]. Collaborative virtual environments have been already used with success in practical ergonomics. The French research centre CLARTE1developed IMPROOV, a complete solution of immersive and collaborative virtual
environment for ergonomics as well as process design. It includes features such as the evaluation of postures (RULA score [31], see section 3.2.2) and a collaborative environment via a web navigator that enables an intervention of external actors in the design process. This platform still presents some limitations : the interaction modes between the actors are limited and the intervention of the ergonomist is mainly done via the auditory channel. Nevertheless, this platform has been used widely and industrially with promising results.
The evaluation of ergonomics factors is very important due to its influence on the feasibility, the working comfort, and the safety of an operation in manual assembly tasks [36]. Furthermore, the empirical studies on human-related factors have to be done at the early design stage of an assembly process, where no physical models are available and their geometric forms and functionality still can be shaped [11]. Therefore, we focus mostly on the human-related factors and not on the realistic representation of assembly workstations.
Ergonomic evaluation has already been done using virtual mannequins to represent and simu-late the normal population in terms of somatotype [15, 29, 36]. The use of such digital human forms
3
provides a fast and flexible way of integrating human presence in the ergonomic posture analysis. However, although many movements and gestures of the human model have been provided such as reach, grab, bring, place, and release, the comfort factor could not be simply evaluated due to its complexity. The design engineer may use the digital mannequin inappropriately by accepting awk-ward postures, by providing too little space for movements, or by providing unacceptable visibility in workspace stations [15]. Therefore, there is always a need for involving end-users (operators) in the assembly process.
The design engineer also has to take into account the restricted availability of assembly space. There are difficulties in evaluating reach distance, space needed for hands, and visual conditions during assembly work. The design engineer who has worked with a simulation will have judgements concerning the workstation design that may be completely different from the point of view of the operator who has physically worked in the same workstation [15]. At last, ergonomists have to be involved in the design process because they can provide knowledge about comfort, safety, usability that is not often taken into account by the end-users. Hence, we have integrated design engineers, end-users, and ergonomists into a shared system, wherein the end-users can work in a prototype of the assembly process, and the design engineers and ergonomists can intervene directly and quickly in the assembly task simulation.
The recent research on CVEs for ergonomics tends to show that there is a need to develop specific tools and metaphors aiming at improving the collaboration between the design actors. In fact, such tools have to favour a sound design solution that satisfies all of the design constraints defined by the different design actors. This paper aims at presenting the usability evaluation of the modes and metaphors available in a CVE dedicated to ergonomics for both end-users and design engineers as defined in the following section.
3
Material and Methods
This section presents the CVE, modes and metaphors we implemented for collaborative ergo-nomic design sessions. The usability of the modes and metaphors has been evaluated through an experimental protocol, tested by non-expert users as presented in the following section.
3.1
CVE dedicated to ergonomics
Before installing a workstation in an assembly line or production line in real life, its design has to be verified and validated through a design and evaluation process. An ideal workstation design would have to conform to two main types of constraints. The first type is process constraints, dealing with the process specifications related to the insertion of the workstation into the assembly line and warranting its efficiency in the manufacturing process. Such constraints, e.g., workstation bulk, inputs and outputs placements, or inner process properties and activities, have to be verified by a process design engineer [21]. The second type is usability constraints. Such constraints that are composed of three distinct dimensions (effectiveness, efficiency and satisfaction, with reference to the ISO 9241 norm [23]) have to be verified by an ergonomist and an end-user. The former would focus on ergonomic constraints, concerning mostly efficiency and effectiveness (postural comfort, force exertion, task duration, etc.), whereas the latter would focus on activity constraints, dealing with satisfaction and effectiveness mostly (comfort, propensity of the task to achieve to be made, etc.).
Figure 1 presents an ideal VR-based framework dedicated to collaborative industrial ergonomics. As several actors are involved in this design evaluation process, we present the role of three general kinds of actors (end-user, design engineer, ergonomist). For the two roles of end-user and design engineer, we define two operating design modes (direct design mode and supervised design mode) and the corresponding collaborative metaphors that have been implemented in our CVE.
3.1.1 Actors involved in collaborative workstation design
The design process of a workstation should be done with the participation of three actors : end-user, design engineer, and ergonomist [41]. The three of them should have the possibility to collaboratively enhance the usability and thus the productivity of the workstation.
3.1 CVE dedicated to ergonomics 4
Figure 1 – Ideal VR-based framework for collaborative ergonomic design sessions. Adapted from [39, 40, 41].
The End-user is an industrial operator working on an assembly process, and therefore becomes the main subject of the design and evaluation process. They receive posture recommendations with regard to their current physical comfort given from the ergonomist. They also have to take into consideration process constraints regarding the current workstation specifications from the design engineer. They must find a compromise between their physical comfort and process constraints. They also must be able to provide activity constraints to the design engineer. In our CVE, the end-user works in an immersive virtual environment whose the first-person interface is illustrated in Figure 2. Corresponding to each workstation design, we can define a round plate representing the end-user’s standing/sitting spot with respect to the workstation specifications.
The Design engineer has the responsibility to maintain the efficiency and compatibility of the workstation prototype with other processes, or in other words, to fulfil process constraints. They can modify some aspects of the workstation design to improve process compatibility and productivity in accordance with activity constraints given by the end-user and the ergonomist. Accordingly, the design engineer may need several viewpoints on the scene during this interactive design phase. For this purpose, we have implemented a desktop system providing two different viewpoints on the virtual workstation (see Figure 3). The design engineer can supervise the end-user working in the virtual workstation and they also can modify the position of some DMU’s elements based on the end-user’s usability constraints.
The Ergonomist gives ergonomic recommendations for the end-user and the design engineer. This task is achieved thanks to an analysis, either online or offline, of objective and subjective criterions quantifying the physical risk factors as Rated Perceived Exertion [7], Postural Scores [20, 31] or Averaged Muscle Activations [9, 38]. In the CVE, as it has been proposed in [40], the ergonomist can interact with the scene and the other actors using a specific interface. In the
3.1 CVE dedicated to ergonomics 5
Figure 2 – End-user’s viewpoint in the CVE.
following study, the ergonomist’s role has not been taken into account because we considered evaluating the specific interaction between the end-user and the design engineer.
Figure 3 – Design engineers’ viewpoints in the CVE : top view (left) and front view (right).
3.1.2 Operating design modes
We have implemented the design engineer’s role and the end-user’s role into our system. We focused on the two proposed operating design modes, representing the interaction between these two actors during the design process.
In direct design mode, the design engineer modifies the DMU workstation directly in accordance with the process constraints that they already know and the activity constraints that are provided by the end-user (see Figure 4). The end-user uses informative signals such as visual metaphors (e.g., arrows, accessible zones, etc.) and/or auditory ones to represent their usable spaces to the design engineer.
Consequently, the CVE needs to provide appropriate interaction tools enabling the end-user to express their activity constraints to the design engineer, increasing the design engineer’s awareness
3.1 CVE dedicated to ergonomics 6
to their working conditions. In addition, the system has to provide interaction tools enabling the design engineer to change the workstation design, which means enabling them to manipulate the elements of the workstation.
Figure 4 – Direct design mode in a collaborative DMU workstation with the design engineer’s main role highlighted in green. Figure is directly adapted from [41].
In supervised design mode, the end-user is the main actor of the workstation design. They change the workstation design by manipulating its elements (see Figure 5). The end-user therefore needs the design engineer to represent process constraints to them. The design engineer, in this operating mode, expresses the process constraints to the end-user using appropriate interaction tools and then supervises and validates the work of the end-user.
Figure 5 – Supervised design mode in a collaborative DMU workstation with the end-user’s main role highlighted in green. Figure is directly adapted from [41].
3.1.3 Collaborative metaphors
In order to allow different actors in a workstation design process with different types of com-petence and expertise to be able to work jointly, simple but effective interaction techniques and collaborative metaphors have been implemented, as proposed in [41]. Interaction tools in the colla-borative context can be reused from other VEs such as a 3D cursor or a virtual hand provided to the end-user and the design engineer to manipulate the elements of the workstation. Besides the interaction tools, we need different collaborative metaphors for the two actors to collaborate and
3.2 Usability evaluation 7
explicitly communicate in the two operating design modes. In our case, they are the metaphors used to describe spatial constraints for the design engineer (process constraints) and the end-user (activity constraints). These metaphors can be characterised along two factors : their resembling of a real space and the intended purpose of the space [43]. Therefore, we use different forms to des-cribe the spatial constraints for the design engineer and the end-user, and color to encode different levels of constraints.
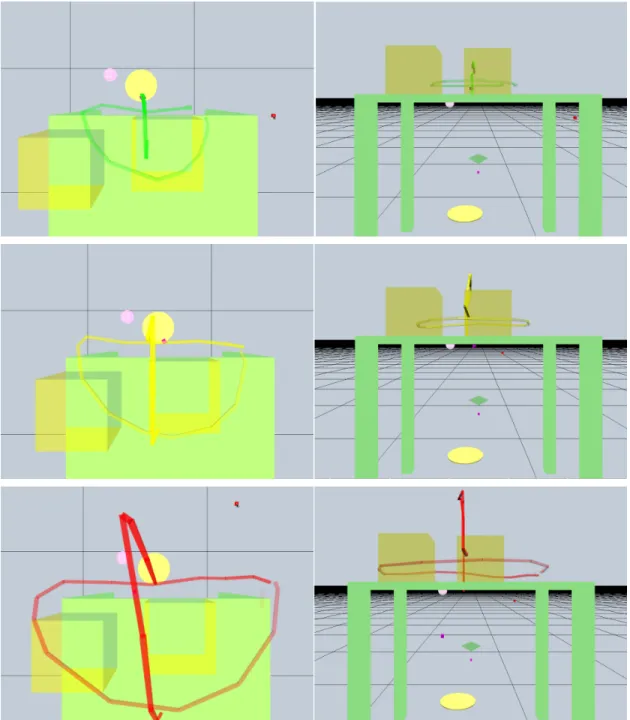
In direct design mode, the activity constraints related to the end-user are postural constraints for the purpose of providing workstation designs wherein the end-user can see, reach, and manipulate objects [10]. In our study, the activity constraints are based on accessibility and divided in three zones representing comfort of the end-user. Within the first zone, the end-user can reach and manipulate DMU elements easily. Within the second zone, the end-user faces little difficulty and discomfort for manipulation of elements. Last, within the third zone, the end-user needs to make effort to reach an element. Three colors are used to encode these comfort zones : green for the first zone, yellow for the second, and red for the third (see Figure 6). We used the common metaphor of drawing a line by natural gesture for the end-user. This kind of metaphor has been studied in the context of sketching [19], and we implemented it through hand gestures using a flystick device2.
This drawn information provides the design engineer with the knowledge of the position of the end-user and of their reachable zone. We assume that this metaphor based on color encoding and natural hand gestures to dynamically describe a spatial zone is a simple but powerful interaction and communication technique to be applied in a CVE.
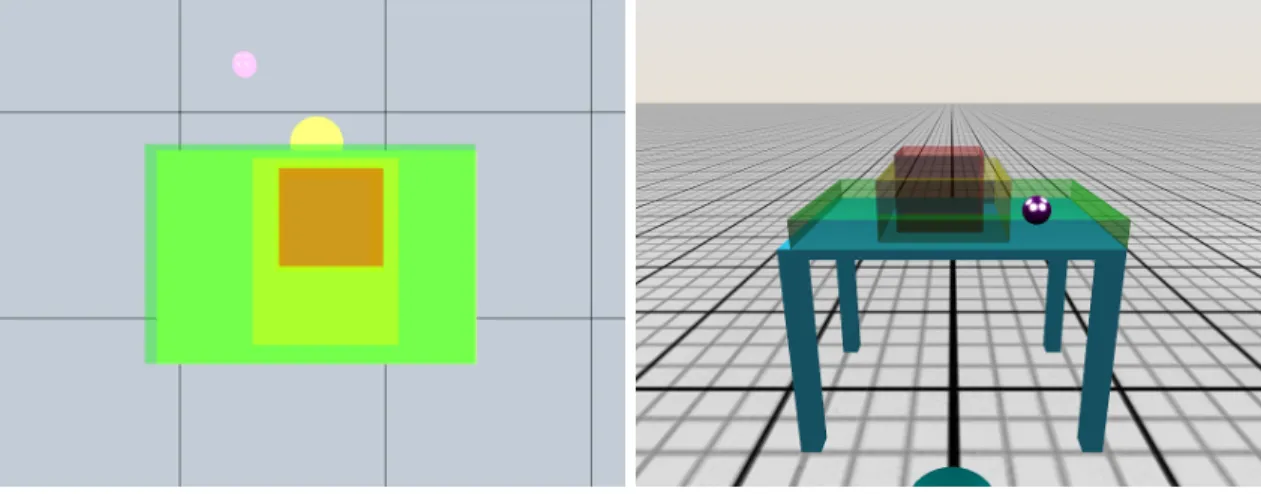
In our study, process constraints provided by the design engineer to the end-user in the su-pervised design mode are described as dead zones. These dead zones can be some of the features of the workstation such as bulked zones, inputs/output zones, machine zones that the end-user cannot modify. The design engineer hence needs interaction metaphors to show the dead zones specifically to the end-user and to express if the modifications made by the end-user are accep-table regarding the workstation specifications. In our system, the dead zones are represented by translucent coloured parallelepipeds drawn by the design engineer (see Figure 7). They can draw red zones to indicate the dead zones that the end-user cannot touch. Yellow zones represent a risk if the end-user works close to them. Green zones show safety zones recommended to the end-user. The design engineer can remove these zones once the workstation design process is achieved or if they want to modify these indications. Since the design engineer often works in front of a desktop system, they can use a simple 3D cursor driven by a mouse. However, it is possible to provide them with other interaction devices and to immerse them either in an immersive room or using a head-mounted display.
3.2
Usability evaluation
The operating design modes and collaborative metaphors presented in the last section were evaluated. Two main questions were investigated in order to validate our choices of implementation : – How do design modes influence the design solution ? In other words, how do design modes
impact upon the trade-off obtained between users constraints during the design process ? – Are the design tools provided to users relevant to the collaborative design ?
In order to investigate these two research questions, we implemented an experimental evaluation through a simple but representative situation, and we assessed the design modes and metaphors in terms of usability as described in the following section.
3.2.1 Experiment design
The experimental situation illustrated a simple but representative ergonomic intervention : an element of the workstation was not optimally placed and the end-user needed to adopt uncomfor-table postures to reach or interact with this element. The end-user requested a modification of the element’s position to the design engineer. Such a use case is a classical ergonomic intervention since assembly or production line reordering is a standard problem in the manufacturing industry [12]. A practical example of this situation is that the end-user and the design engineer need to consider where to place a tool used to fix a part A on a part B. The positions of parts A and B are defined by
3.2 Usability evaluation 8
Figure 6 – The end-user draws their comfort zones (first zone - top, second zone - middle, third zone - bottom) using hand gestures seen in the top views (left) and front views (right) of the design engineer.
external constraints (process constraints) whereas the position of the tool has to be optimized to be easily reached by the end-user (activity constraint). The actors try to find a compromise between the end-user’s activity constraints and the process constraints using the two operating modes (see Figure 8). This scenario has been implemented in the collaborative Collaviz framework [16, 18], using its distribution features and its abilities for modeling the physical spaces of distant users [17]. In direct design mode, we evaluated the workstation design process when the design engineer directly modified a DMU element based on the activity constraints provided by the end-user. In supervised design mode, in order to simplify the evaluation without losing its interest, the end-user controlled the same DMU element based on the information of the process constraints given by the design engineer (see Table 1).
3.2 Usability evaluation 9
Figure 7 – Three zones representing workstation specifications drawn by the design engineer seen in the design engineer’s viewpoint (left) and in the end-user’s (right). The red zone indicates the dead zone that the end-user cannot touch, the yellow zone shows the zone that the design engineer does not want the end-user to go through, and the green zone represents the safe zone of the workstation.
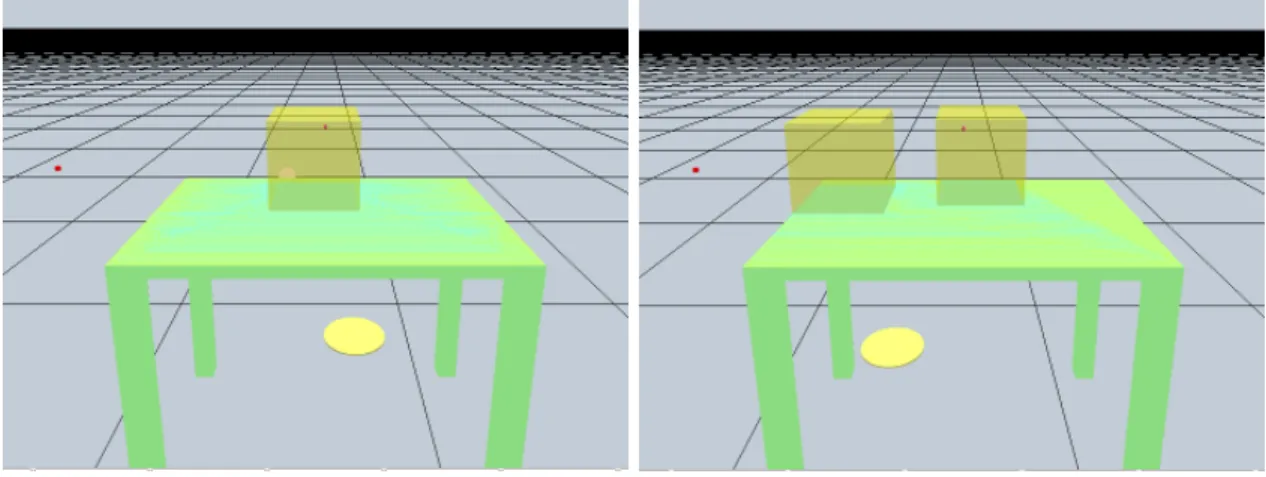
Table 1 – Within-subjects factors Factors Levels Description Level of difficulty One dead zone See Fig. 9 (left)
Two dead zones See Fig. 9 (right)
Operating mode
Direct design Engineer active End-user passive Supervised design Engineer passive End-user active
3.2.2 Scenes generation
In order to assess the usability of the operating modes and metaphors, it was important to ensure that the results of the simulation were generic. Hence, in our experiment, each scene had to be unique but comparable with the others in terms of level of difficulty and of the difference in morphology of subjects. We assumed that a relevant indicator of difficulty can be extracted from the size and the shape of the reachable zone, that is the simplest activity constraint to take into account. This is why we created a difficulty criterion that was weighted volume of the intersection between U and V (see Figure 8). The randomized parameters used to generate the scenes were the dead zones’ positions, the end-user’s position and the initial position of the DMU element. This section explains how the scenes were rated and categorized.
In each scene, the height of the workplane (a virtual table in our experiment) was morpholo-gically adapted so it was placed at the end-user’s elbow level, as recommended in [32]. To limit the number of generated scenes, we defined six morphology categories based on subjects’ common height range (see Table 2).
The difficulty of a scene was computed as shown in Figure 10. First, depending on the end-user’s expected morphology, the reachable zone U of the scene was generated and rated. Then, depending on the level of difficulty, the process volume V was generated as the table volume minus the dead zone(s). Once obtained U and V , we discretized the intersection volume U ∩ V and we computed the following weighted volume :
3.2 Usability evaluation 10
Figure 8 – Experimental situation : finding a position for an element (in purple) of the workstation satisfying two constraints : being reachable in a comfortable posture by the end-user (be in volume U ) and satisfying process constraints (be in volume V ). Adapted from [41].
Figure 9 – Level of difficulty of the workstation design. In our experiment, two level of difficulty were investigated : a workstation design with one dead zone (left) and another one with two dead zones (right).
where W is the weighted volume, wean elementary volume of U ∩ V , and reis the reachability
weight associated to each elementary volume we. re was obtained by computing the RULA score
for the considered volume we. Here, only the arm and forearm score were used to assess the final
score. The RULA score was used to compute refor each elementary volume weusing the non linear
relationship described in Figure 11. The RULA score is an indicator of postural discomfort [31] used in relation to assessment of physical risk factors. A minimal score of 1 indicates a relatively comfortable posture, whereas a maximal score of 7+ indicates a highly uncomfortable posture. This non linear scale was used to penalize the high RULA score obtained in some ill generated scenes. The product we· re was finally summed on the whole U ∩ V volume to obtain W .
Once we had obtained W , the difficulty of each scene was weighted by adjusting the initial po-sition of the element to place. We used the NIOSH method [49] to assess the difficulty of placement
3.2 Usability evaluation 11
Figure 10 – Scene difficulty computation. (a) Intersection computation : U ∩ V is computed, (b) Intersection volume discretization : weis computed (c) Discrete intersection volume rating : reand
the weighted volume W are computed (d) Final complexity adjustment : the initial position of the DMU element to place O is determined using the rule described in equation 2 with d distance between O and G and G the barycenter of the weighted intersection volume W .
Table 2 – Six categories of generated scenes were calculated based on the average height of each group of subjects.
Category Height Range (cm) Average Height (cm)
Cat. 1 156 - 160 158
Cat. 2 161 - 165 163
Cat. 3 166 - 170 168
Cat. 4 171 - 175 173
Cat. 5 176 - 180 178
Cat. 6 higher than 180 183
of the element. The NIOSH equation was initially developed to rate a lifting task between two positions in terms of fatigue. We used it at a constant weight to adjust the distance d between the initial point and the barycentre of the weighted intersection volume W , to compute the difficulty score of the scenes W∗ :
W∗= W · d (2)
Finally W∗ was used to gather the scenes by difficulty. From a representative set of scenes, we chose two levels of difficulty that led to a relative easiness of resolution and a sufficient challenge, corresponding to the cases with one or two dead zones. Then, a large set of “one dead zone" or “two dead zones" scenes was generated for each considered morphology, and only 16 scenes per level of difficulty were kept from the initial set for each morphology category, guaranteeing for each subject a different set of scenes to avoid any learning effect.
According to the Table 2, we have generated six categories for both operating modes. For each category, we have generated 32 different scenes (16 scenes with one dead zone, and 16 scenes with two dead zones). The selection process of these scenes in each category was arbitrary. In total, we have created 96 scenes with one dead zone and 96 scenes with two dead zones.
3.2.3 Subjects
Sixteen subjects (one woman and fifteen men) took part in this experiment (age : 24.8 ± 2.83 years old, height : 179 ± 8.54 cm). Since the subjects played both the roles of the design engineer and of the industrial operator in the same session, subjects were recruited among our colleagues in our laboratory and our students. None of them were expert design engineers, however most of them owned a technical (engineer or science) master degree. Most of them had experience in 3D virtual worlds but not specifically in immersive environments (average : 4.67 on a 7-point Likert scale). We thought that there was no need to recruit actual design engineers since the task to achieve was
3.2 Usability evaluation 12
Figure 11 – Non-linear relationship between the RULA score and re. This was designed to penalize
and discard the scenes with a poor amount of easily reachable zone.
simple enough to be solved by non-experts, while guaranteeing a proper evaluation of the usability of the system.
3.2.4 Experimental Procedure
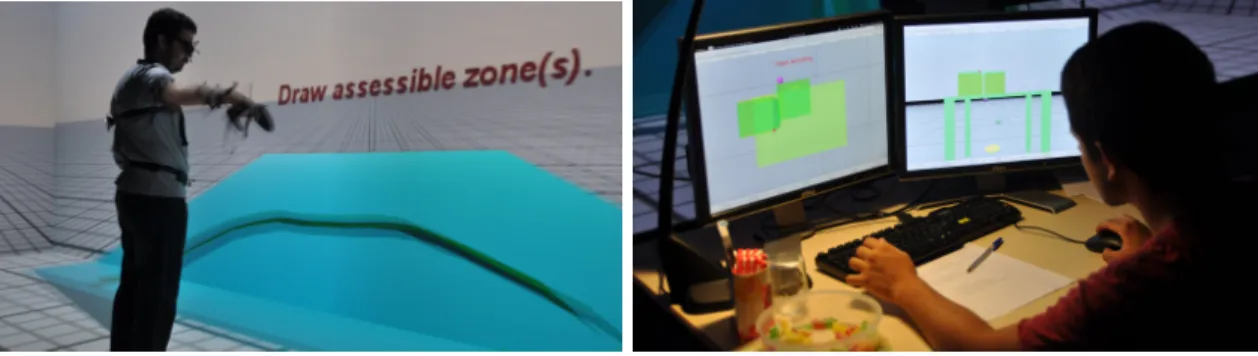
Figure 12 – Interfaces of the end-user and the design engineer : (left) end-user drawing their reachable zone on the table, (right) design engineer having two viewpoints on their workstation.
The end-user was immersed in a large four-wall immersive room, which size was 9.60 m long, 3.10 m high and 2.88 m deep. They used a flystick device to drive a 3D cursor - an interaction tool to either grab and manipulate the DMU element in the supervised design mode or to draw reachable zones in the direct design mode. The design engineer had a simpler interface on a desktop computer with two windows that provided a top-view and a front-view of the CVE, as it has been described in section 3.1. We used a simplified avatar to represent the end-user’s current activity in the design engineer field of view. The design engineer used a mouse to drive a 3D cursor to manipulate the DMU element in the direct design mode or to draw dead zones in the supervised design mode. Figure 12 (left) illustrates a reachable zone drawn by the end-user in an immersive room and Figure 12 (right) shows a set-up of the design engineer’s interface. The design engineer and the end-user were not allowed to use verbal communications because we wanted to evaluate the efficiency of the collaborative metaphors used to exchange information. We predefined several messages to inform the end-user and the design engineer which operating mode they were currently
3.2 Usability evaluation 13
using, and to indicate them when the task was completed.
Even if both end-user’s and design engineer’s roles were fully implemented, we decided after a preliminary evaluation to restrict the color code used in the metaphors to a single color. In such a simple and generic use case, this choice was justified. Furthermore, in the proposition of [41], the end-user draws their reachable zone using both hands equally. We proposed in this study that the end-user used only one hand since they could represent their reachable zone using only one interaction tool and the design engineer still could estimate their reachable limits. The end-user did not need to use both hands unless a bi-manual manipulation technique was required in the application.
For each session, each subject was playing both roles (end-user and design engineer) to limit the number of experiments to run. In more details, 12 scenes (3 different scenes ×2 levels of difficulty ×2 operating modes) were randomly chosen from the pool of scenes related to a morphology category as presented in the end of the section 3.2.2. The scenes were randomly ordered in each session in terms of level of difficulty and operating mode to be performed. Once they had finished the first set of 12 scenes, they exchanged their roles and performed 12 new scenes chosen in accordance with the morphology category of the new end-user. The average time of an experimental session for two subject was about one hour.
The training phase was done each time using four scenes that were randomly chosen from the scenes pool for the end-user. This phase enabled the end-user and the design engineer to familiarize themselves with the manipulation of the DMU element, the drawing of reachable zones and of dead zones, and the two operating modes. In the evaluation session, the scenes were loaded one after another. The task for each scene finished when both the end-user and the design engineer agreed on the final position of the DMU element and validated it. The end-user was then asked to put their hands on the DMU element for three seconds for recording the position of all the motion trackers placed on their body (see Figure 13).
Figure 13 – End-user putting their hands on the DMU element for three seconds to record the position of all the trackers placed on their body. The RULA score is computed from this data.
3.2.5 Usability metrics
The aim of this study was to evaluate the usabitily of the modes and metaphors described in the previous section. In accordance with the ISO definition of usability [23], three main dimensions can be investigated :
14
– the efficiency : resources expended in relation to the accuracy and completeness of goals achieved ;
– the effectiveness : accuracy and completeness with which specified users can achieve specified goals in particular environments ;
– the satisfaction : comfort and acceptability of the work system to its users and other people affected by its use.
To evaluate these three dimensions, several metrics were used.
To assess the efficiency of the design modes, we measured two specific metrics : the completion time per trial and the expected-final distance. The completion time was automatically recorded for the end-user and the design engineer to move the DMU element from its initial position to its final position and to validate the task. This metric is a direct indicator of the fastest operating mode to achieve the tasks. Then, the expected-final distance - the distance between the expected position of the DMU element on the table and its final position - was measured for each trial. The expected position was the barycentre of the weighted intersection volume as described in section 3.2.2. We only took into account the projection of the distance on the workplane because we assumed that the DMU element was placed on it. This ideal placement of the DMU corresponds to the minimization of the activity constraint considered in the study - the reachable zone. This metric qualifies the trade-off found between the users at the end of the design phase relatively to an “ideal" design.
To assess the effectiveness of the design modes, we computed the RULA score associated to the final position. According to the description we made in the section 3.2.2, RULA score gives a clear indication about the effectiveness of the design since it defines in terms of comfort the trade-off found by both users at the end of the design phase. In order to compute this score, we used nine trackers (neck, trunk, head, both arms, forearms and hands) to record the body segment orientations during the experiment. We recorded the posture of the end-user at the end of each trial as it has been described in the previous section (see Figure 13). The sample frequency was 60 Hz and postures were analysed offline to compute the RULA metrics. The method used to compute the RULA score is defined in [41, 42].
To assess the satisfaction of the users with the regard to the system, they answered three ques-tionnaires : evaluation of the end-user’s role and the respective collaborative metaphors ; evaluation of the design engineer’s role and the respective collaborative metaphors ; and general comparison between two roles in the two operating design modes.
3.2.6 Statistics
All the metrics were statistically analysed in order to assess the usability of the system. We studied two independent factors in our experiment : operating design modes and levels of diffi-culty (see Table 1) and we aimed at evaluating their effect respectively to the completion time, expected-final distance and RULA score. We computed the p-values of completion time and expec-ted final distance using a two-way ANOVA analysis with repeaexpec-ted-measures for balanced design and within-subject factor. We analysed the RULA score using the univariate repeated-measures two-way ANOVA with Greenhouse-Geisser adjustments.
Subjective questionnaires were gathered and data was analysed using a Friedman’s test. Results of the questionnaires were crossed for comparison, as presented in the next section.
4
Results and Discussion
4.1
Results
4.1.1 Efficiency metrics
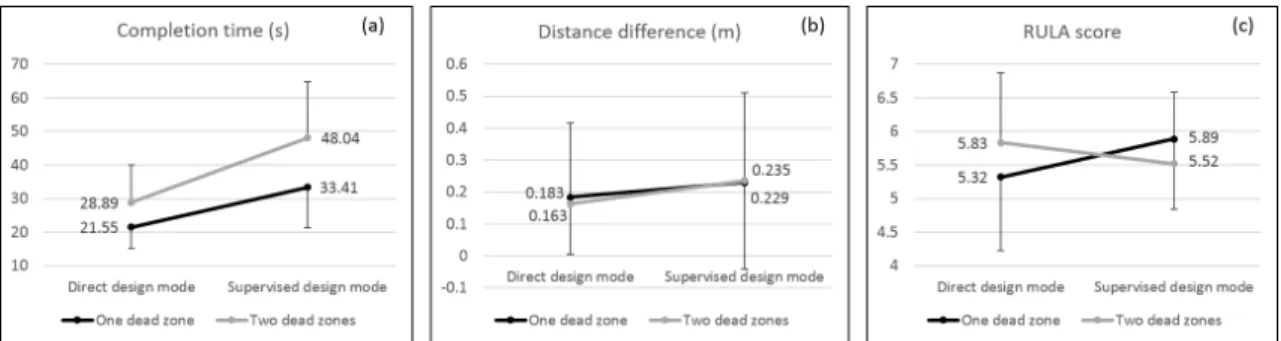
Figure 14 shows the interaction plots of the completion time (Figure 14.a) and of the expected-final distance (Figure 14.b) on the two factors. The result revealed that there was a significant interaction effect between the level of difficulty and the operating mode factors on the completion time (F(1,47) = 5.876, p-value = 0.019). However, we could not find any evidence of a significant interaction effect between them on the expected-final distance value (F(1,47) = 0.1493, p-value = 0.7009). The results of the test for the main effect of both factors also showed no significantly
4.1 Results 15
Figure 14 – Interaction plots with mean values and standard deviation values of (a) the completion time in second, (b) the expected-final distance in meter, and (c) the RULA score.
Figure 15 – Mean values and standard deviation values of the two actors (end-users and design engineers) for (a) two operating modes (from -3 for the supervised design mode to 3 for the direct design mode), (b) collaborative metaphors and interaction tools in the direct design mode (from 1 to 7 on the 7-point Likert scale), and (c) collaborative metaphors and interaction tools in the supervised design mode (from 1 to 7 on the 7-point Likert scale).
independent effect on the expected-final distance value (the result of the level of difficulty factor : F(1,47) = 2.188, p-value = 0.146, the result of the operating mode : F(1,47) = 0.038, p-value = 0.846).
4.1.2 Effectiveness metric
We found a significant interaction effect between the two factors on the RULA score (F(1,47) = 9.5507, p-value = 0.003) as shown in Figure 14.c.
4.1.3 Satisfaction metrics
The data of the first and the second questionnaires about the end-user’s and the design engi-neer’s roles and the collaborative metaphors is summarized and presented in Figure 15. The result of the subjective rating for the two operating modes in terms of quickness to accomplish the task, efficiency for the comfort criteria of the element’s final position, and their preference are shown in Figure 15.a. In general, the statistical analysis revealed that the end-users found the supervised design mode more efficient than the design engineers did (end-users’ rating = −1.81 ± 2.07, design engineers’ rating = 0.31 ± 1.77, p-value = 0.032). Similarly, the end-users mostly preferred the supervised design mode than the design engineers did (end-users’ rating = −2.62 ± 1.5, design engineers’ rating = 0.37 ± 1.78, p-value = 0.000063). However, the quickness of the direct design mode was more appreciated by the design engineers than by the end-users (end-users’ rating = −0.5 ± 2.09, design engineers’ rating = 1 ± 2, p-value = 0.0075).
Figure 15.b shows the rating for efficiency, intuitiveness and fatigue of collaborative metaphors and interaction tools in the direct design mode. In this case the metaphors were the reachable zones drawn by the end-users and the interaction tools allowing the design engineers to control
4.2 Discussion 16
the element. We did not find any significant difference between the rating made by the two actors. As illustrated in Figure 15.c, in the supervised design mode, the end-users found the collaborative metaphors used for the design engineers to draw the dead zones and the interaction tools for them to control the element were more intuitive than the design engineers did (end-users’ rating = 5.75 ± 1.06, design engineers’ rating = 4.44 ± 1.89, p-value = 0.049). The end-users also found them more efficient than the design engineers did (end-users’ rating = 5.87 ± 0.88, design engineers’ rating = 4.93 ± 1.52, p-value = 0.011).
Figure 16 summarizes the mean and standard deviation values of a general evaluation of our experiment on the 7-point Likert scale in terms of difference between scenes (3.56 ± 1.55), adap-tability of the interaction metaphors ( 5.31 ± 1.01), complexity of the end-user’s and the design engineer’s roles (2.50 ± 1.46), and level of difficulty of the scenes ( 2.00 ± 0.89 ). From the results, we can conclude that the subjects found the scenes used in the experiment were easy to solve and the two roles they played were simple. We received a high appreciation from the subjects about the adaptability of the interaction metaphors. Last, the scenes we used in the experiment were not perceived as very similar one to another. A general comparison between the two roles in terms of comfort, intuitiveness, fatigue, naturalness, and efficiency (from -3 for the design engineer to 3 for the end-user) was also analysed and its result is illustrated in Figure 17. From the result, we can conclude that the subjects found the end-user’s role was much more natural (1.68 ± 1.62) and more intuitive (2.25 ± 0.86) than the design engineer’s role. The other criteria (comfort, fatigue, efficiency) did not show much difference between the two roles.
Figure 16 – Mean values and standard deviation values of the general evaluation of the experiment set-up on the 7-point Likert scale.
4.2
Discussion
4.2.1 Efficiency metrics
The statistical results revealed that there was a significant interaction effect between the level of difficulty factor and the operating mode on the completion time. It meant that in the direct design mode, it did not matter if there was one or two dead zones in the workstation : in both cases the completion time was approximately the same. This result could be easily explained by the fact that in the direct design mode, it was the design engineer who manipulated the element from its initial position to the final position where they thought that the end-user could reach the
4.2 Discussion 17
Figure 17 – Mean values and standard deviation values of the subjective comparison between the design engineer’s role and the end-user’s role (from -3 for the design engineer’s role to 3 for the end-user’s role).
element. This manipulation was not affected by the complexity of the process constraints in terms of completion time.
In the supervised design mode, when the design engineer had to draw dead zone(s) for the end-user, the more dead zones they had to draw, the longer the time it took for both of them to complete the design task. Consequently, the time it took for them to complete a task in a complex workstation with two dead zones was significantly longer than in a one-dead-zone workstation design. From this result, we can conclude that it was considerably faster if the design engineer directly manipulated the DMU element because they had a global and complete view of the process constraints and they did not need to describe these constraints to the end-user.
This result is of importance because it shows clearly that the more complex constraints one has to describe to the other users, the more time it takes. In the current evaluation, the end-users were healthy subjects : they had no physical challenge. Therefore, they easily described the representation of their activity constraints (reachable zone) to the design engineers and it resulted in a more efficient result in terms of completion time for the direct design mode [13]. This result could have been totally different with physically challenged end-users. Their activity constraints, e.g. reachability and physical limitations, would probably be far more complex to draw and to describe to the design engineers, and would lead to a longer completion time in direct design mode. This consideration makes us assess that the efficiency of the design mode in terms of completion time depends on the complexity of the information to describe on both ends. One should let the most constrained user manipulate the element.
We considered the distance difference between the expected position and the final position of the element in the workstation as an important measurement to evaluate because it represents the efficiency of the design modes. We found no evidence of a significant interaction effect between the level of difficulty and the operating mode factors on the expected-final distance value. Similarly, no significant effect of the operating mode and the level of difficulty on the expected-final distance value was detected.
In our experiment, the expected position of the DMU element was calculated as an optimized position that minimized the activity constraint and satisfied process constraint (meaning, being in
4.2 Discussion 18
the U ∩ V volume and leading to a comfortable posture). However, the expected-final distance was a subtle measurement, especially in the level of difficulty with one dead zone. In this situation, the end-user and the design engineer had many potential places to put the element on the table out of the dead zone. Due to this reason, the mean value of the expected-final distance in the first level of difficulty was quite greater than the second level of difficulty although this conclusion was not significantly confirmed by the statistical analysis.
This result clearly shows that even if we tried to expect a specific placement of the element in the scene, thanks to our scene generation routine, we were not able to properly handle mul-tiple possibilities offered to both users to place the element. It clearly justifies the post-placement measurement of the RULA score, to assess the quality of the final position without considering the expected position of the element. Another solution would have been to use a more complex design metric to define the optimal placement with regard to the end-user’s position, such as the one developed in [1]. At last, the addition of the ergonomist’s role in our experiment would have led to a different result, because of the online recommendations the ergonomist would have made to both end-user and design engineer to enhance the design process in terms of effectiveness. 4.2.2 Effectiveness metric
Regarding the results of the RULA score, we obtained a considerably high interaction between the two factors (the level of difficulty and the operating mode). In the direct design mode, when the design engineer controlled the DMU element, if there was only one dead zone, they tried to put the element as close as possible to the end-user. However, in the second-level condition of difficulty, the design engineer did not correctly estimate the end-user’s posture resulting of its DMU placement. Due to this reason, the RULA score was significantly higher in this condition than in other conditions. On the contrary, the RULA score was significantly lower in the second complexity level and in the supervised design mode. Because of the limited available working zone, in the second complexity level the end-user always tried to put the element in narrow places in order to be able to reach it easily. However, in our opinion, this conclusion could not be generalized because in our experiment the subjects in the design engineer’s role drew dead zone(s) in the position where they were regarding process constraints. They did not consider the different levels of risks using the color code presented in the collaborative metaphors section. Having such an information in a more complex scene would lead to different behaviors. For example, end-users would try to stay far from these zones. It would be a compromise to be found when the design engineer represents the dead zones using different colors to correctly express the limits of each zone. However, this result tended to prove that each user tried in priority to satisfy their own constraint. It resulted in unexpected compromises between both constraints like having the element placed close to the limits of the table when the end-user placed it. In addition to a better constraint description using color codes, we need a better description of the work task and the work environ-ment. In the current case-study, the DMU element placement was not correlated with any other industrial process or activity. Evaluating the CVE with practical cases and more complete process information would be necessary, for example in adding interaction with animated or scenarized scenes to validate the usability of the designed workstation.
Finally, the statistical results highlight a contradiction between the RULA score and the sub-jective comfort felt by the end-users. Normally, a high correlation can be found between obsub-jective and subjective indicators of discomfort [27]. In the current experimentation, our results showed that the end-users tried to maximize their comfort without being able to get the lowest postural stress (e.g., the lowest RULA score). We assume that users were not sufficiently familiar with the environment and with the task design to properly place the DMU element with regard to their own body placement, as it has already been observed in [42]. This consideration is clearly justifying the need for intervention of an ergonomist in the design phase, since an objective and expert point of view seems necessary to fullfil activity and usability constraints in a design phase. Indeed, we assume that effectiveness of the CVE would be greatly improved by the presence of the ergonomist in the loop.
19
4.2.3 Satisfaction metrics
We have collected the data from the two questionnaires about the two main roles in the works-tation design, the collaborative metaphors and the interaction tools. From the statistical analysis, we can conclude that the end-users preferred the supervised design mode rather than the direct design mode when they directly controlled the element themselves after the design engineers drew dead zone(s). The result in Figure 15(c) confirmed this fact that the end-users appreciated the interaction metaphors used in the supervised design mode. They found the interaction metaphors more intuitive and more efficient than the design engineer did.
Regarding the result of the questionnaire about the general evaluation of our experiment, the subjects of the experiment thought that the situations to solve were clearly different whereas their level of difficulty was similar from one to another. We have then successfully restricted the possible learning effect of our experiment when the subjects worked on different scenes in a session. Another positive result that we obtained from the experiment is the high appreciation from the subjects about the adaptability of the interaction metaphors. They found them adaptable for an end-user and a design engineer working efficiently in workstation design processes.
The design of the interaction metaphors as well as the interface for the end-user’s role in an immersive virtual environment tend to make them more comfortable in the workstation design. This could help us to conclude that the end-user in our workstation design application is a more natural role, answering to well-being constraints and involving the end-user’s body in the works-tation. However, the design engineer’s role is more technical, dealing with external constraints and disconnecting the design engineer from their own representation in the collaborative workstation design. Consequently, the end-user’s role was much more intuitive and natural than the design engineer’s role. Therefore, most of the next improvements must focus on the design engineer’s role in order to make it more natural and easier to use.
4.2.4 Discussion summary
In summary, on the one hand, if we consider the efficiency as the most important dimension when the end-user and the design engineer work together in a workstation design process, the design engineer would be the one who should control the element. The reason is that they know the workstation design more specifically than the end-user. Moreover, in this case, the design engineer does not need to describe the workstation design specifications to the end-user. On the other hand, if we consider the effectiveness, i.e. the comfort of the end-user in the workstation design, as the main criterion to evaluate the usability of a design process, it would be better if the one who controls the element is the end-user. They have a real view of the workstation design from the first-person viewpoint and they can find a good spot to put the element regarding their own postural comfort.
Moreover, we assume the result would have been significantly different with the addition of the ergonomist’s role in the loop. Indeed, ergonomists have a knowledge about comfort, usability and activity enhancement that would have been of interest to criticize the trade-off found between the design engineer and the end-user and to maximize the effectiveness of the design session. The results of the subjective questionnaires make us think that users were satisfied of these tools to be used in a real design situation. However, having the feedback of expert users (design engineers in particular) seems mandatory in order to enhance the usability of the design tools.
5
Conclusion
In this paper, we have presented an evaluation of the usability of two operating design modes (a direct design mode and a supervised design mode) and their collaborative metaphors used for workstation design process in a collaborative virtual environment for ergonomics design. Two dif-ferent user interfaces have been implemented for two roles in a workstation design process including a design engineer and an end-user. The design engineer had a 3D desktop interface that provided multiple viewpoints and interaction tools to control a Digital Mock-Up (DMU) element. The end-user worked with a 3D end-user interface in an immersive projection system with a high immersion level and natural interaction techniques to facilitate a first-person viewpoint and to simulate the
BIBLIOGRAPHIE 20
real workstation condition. Due to the two specific 3D user interfaces for the design engineer and the end-user, we have modified some of the interaction metaphors that have been proposed in [41], making them simpler, more relevant and natural to our collaborative design application.
From our experiment, we have come to some conclusions concerning the collaborative works-tation design. The statistical analysis of the results revealed that in the direct design mode, the workstation design process was better achieved. If it was the design engineer who controlled the DMU element, the collaborative task was done faster than in the supervised design mode wherein the end-user controlled the element. On the other hand, we obtained a better fulfilment of the acti-vity constraints in the supervised design mode. It meant that if it was the end-user who controlled the DMU element, the element would be placed in order to increase the comfort of the end-user. Moreover, from the satisfaction metrics (questionnaires), the subjects of our experiment found that the interaction metaphor used by the end-user in the supervised design mode was more intuitive and easier to understand and to use. The interaction metaphors that were used in the immersive virtual environment for the end-user were also simple and natural. The task of the design engineer was more complicated because it required some experience of 3D applications such as 3D mode-ling. One can think that actual design engineers have such skills and experience. In any case, both the interaction metaphors were well appreciated by our subjects in terms of usability. In general, they found them natural, intuitive and efficient when working together in a collaborative virtual environment.
In the current framework, we did not simulate the work task. However, the way the task is performed by the end-user can drastically change the ergonomic evaluation in general and postural scores in particular [42, 39]. This is a limitation and future work should consider trying to simulate the activity on the workstation in order to fully assess the ergonomics. For example, solutions have been proposed to represent the user’s postures during simulation of assembly tasks or maintenance tasks in VR and augmented reality (AR) [2, 3]. This is a fundamental question that needs to be solved to have a complete and efficient design framework.
In the future, the role of an ergonomics expert should be dynamically added to the system along with their own interaction tools so they could propose recommendations based on the computation of RULA scores in real time. In addition, the next improvement in our application must focus on the interface of the design engineer in order to make the interactions between the design engineer and the system, and between the design engineer and the end-user more natural and easier to use. At last, concrete use cases with experienced design engineers and ergonomists are warranted, because their experience will fundamentally influence the CVE implementation and help us to improve the framework.
Aknowledgements
This work was supported by the European Project VISIONAIR3 [28] (VISIONAIR is under
grant agreement 262044).
Bibliographie
[1] K. Abdel-Malek, W. Yu, J. Yang, and K. Nebel. A mathematical method for ergonomic-based design : placement. International Journal of Industrial Ergonomics, 34(5) :375–394, 2004. [2] L. Alem and J. Li. A study of gestures in a video-mediated collaborative assembly task.
Advances in Human-Computer Interaction, 2011 :1–7, Jan. 2011.
[3] L. Alem, F. Tecchia, and W. Huang. Handsonvideo : Towards a gesture based mobile ar system for remote collaboration. In Recent Trends of Mobile Collaborative Augmented Reality Systems, pages 135–148. Springer New York, 2011.
[4] S. Aromaa and K. Väänänen. Suitability of virtual prototypes to support human fac-tors/ergonomics evaluation during the design. Applied ergonomics, 56 :11–18, 2016.
BIBLIOGRAPHIE 21
[5] G. Backstrand, D. Hogberg, L. J. D. Vin, K. Case, and P. Piamonte. Ergonomics analysis in a virtual environment. International Journal of Manufacturing Research, 2 :198–208, 2007. [6] M. Bassanino, T. Fernando, and K.-C. Wu. Can virtual workspaces enhance team
commu-nication and collaboration in design review meetings ? Architectural Engineering and Design Management, 10(3-4) :200–217, 2014.
[7] G. Borg. Psychiohysical scaling with applications in physical work and the perception of exertion. Scandinavian Journal of Work, Environment and Health, 16(1) :55–58, 1990. [8] H. J. Bullinger, M. Richter, and K.-A. Seidel. Virtual assembly planning. Human Factors and
Ergonomics in Manufacturing and Service Industries, 10(3) :331–341, 2000.
[9] A. Burden. How should we normalize electromyograms obtained from healthy participants ? what we have learned from over 25 years of research. Journal of Electromyography and Kine-siology, 20(6) :1023–1035, 2010.
[10] D. B. Chaffin. On simulating human reach motions for ergonomics analyses. Human Factors and Ergonomics in Manufacturing and Service Industries, 12(3) :235–247, 2002.
[11] G. Chryssolouris, D. Mavrikios, D. Fragos, and V. Karabatsou. A virtual reality-based expe-rimentation environment for the verification of human-related factors in assembly processes. Robotics and Computer Integrated Manufacturing, 16(4) :267–276, august 2000.
[12] A. Cimino, F. Longo, and G. Mirabelli. A multimeasure-based methodology for the ergonomic effective design of manufacturing system workstations. International Journal of Industrial Ergonomics, 39(2) :447–455, 2009.
[13] H. Couclelis and A. Getis. Conceptualizing and measuring accessibility within physical and virtual spaces. In Information, place, and cyberspace, pages 15–20. Springer, 2000.
[14] G. David. Ergonomic methods for assessing exposure to risk factors for work-related muscu-loskeletal disorders. Occupational Medicine, 55(3) :190–199, 2005.
[15] T. Dukic, M. Rönnäng, and M. Christmansson. Evaluation of ergonomics in a virtual manu-facturing process. Journal of Engineering Design, 18(2) :125–137, 2007.
[16] F. Dupont, T. Duval, C. Fleury, J. Forest, V. Gouranton, P. Lando, T. Laurent, G. Lavoué, A. Schmutz, et al. Collaborative scientific visualization : The collaviz framework. In Procee-dings of the JVRC 2010 (Joint Virtual Reality Conference of EuroVR-EGVE-VEC), pages 1–2, 2010.
[17] C. Fleury, A. Chauffaut, T. Duval, V. Gouranton, and B. Arnaldi. A generic model for embed-ding users’ physical workspaces into multi-scale collaborative virtual environments. Procee-dings of the ICAT 2010 (20th International Conference on Artificial Reality and Telexistence), pages 1–8, 2010.
[18] C. Fleury, T. Duval, V. Gouranton, and B. Arnaldi. A New Adaptive Data Distribution Model for Consistency Maintenance in Collaborative Virtual Environments. In Proceedings of the JVRC 2010 (Joint Virtual Reality Conference of EuroVR - EGVE - VEC), pages 1–8, Fellbach, Germany, Sept. 2010.
[19] T. Grossman, R. Balakrishnan, G. Kurtenbach, G. Fitzmaurice, A. Khan, and B. Buxton. Creating principal 3d curves with digital tape drawing. In Proceedings of the CHI 2002 (SIGCHI Conference on Human Factors in Computing Systems), pages 121–128, New York, NY, USA, 2002. ACM.
[20] S. Hignett and L. MacAtamney. Rapid Entire Body Assessment (REBA). Applied Ergonomics, 31 :201–205, 2000.
[21] P. O. Holt, J. Ritchie, P. Day, J. Simmons, G. Robinson, and G. Russell. Immersive virtual reality in cable and pipe routing : Design metaphors and cognitive ergonomics. Journal of Computing and Information Science in Engineering, 4 :161–170, 2004.
[22] B. Hu, L. Ma, W. Zhang, G. Salvendy, D. Chablat, and F. Bennis. Predicting real-world ergonomic measurements by simulation in a virtual environment. International Journal of Industrial Ergonomics, 41(1) :64–71, 2011.
[23] ISO. 9241, ergonomics of human-system interaction - part 11 : Usability : Definitions and concepts, 2015.
BIBLIOGRAPHIE 22
[24] S. Jayaram, H. I. Connacher, and K. W. Lyons. Virtual assembly using virtual reality tech-niques. Computer-Aided Design, 29(8) :575–584, 1997. Virtual Reality.
[25] S. Jayaram, U. Jayaram, Y. Wang, H. Tirumali, K. Lyons, and P. Hart. Vade : a virtual assembly design environment. Computer Graphics and Applications, IEEE, 19(6) :44–50, Nov 1999.
[26] U. Jayaram, S. Jayaram, I. Shaikh, Y. Kim, and C. Palmer. Introducing quantitative ana-lysis methods into virtual environments for real-time and continuous ergonomic evaluations. Computers in Industry, 57(3) :283–296, 2006.
[27] D. Kee and I. Lee. Relationships between subjective and objective measures in assessing postural stresses. Applied Ergonomics, 43(2) :277–282, 2012. Special Section on Product Comfort.
[28] A. Kopecki, U. Wössner, D. Mavrikios, L. Rentzos, C. Weidig, L. Roucoules, O.-D. Ntofon, M. Reed, G. Dumont, D. Bündgens, A. Milecki, P. Baranyi, F. Noel, C. Masclet, M. Attene, F. Giannini, and M. Spagnuolo. VISIONAIR : VISION Advanced Infrastructure for Research. SBC Journal on 3D Interactive Systems, 2(2) :40–43, Nov. 2011. CI CI.
[29] D. LÃďmkull, L. Hanson, and R. ÃŰrtengren. A comparative study of digital human modelling simulation results and their outcomes in reality : A case study within manual assembly of automobiles. International Journal of Industrial Ergonomics, 39(2) :428–441, 2009.
[30] E. Loup-Escande, J.-M. Burkhardt, O. Christmann, and S. Richir. NeedsŠ elaboration between users, designers and project leaders : Analysis of a design process of a virtual reality-based software. Information and Software Technology, 56(8) :1049–1061, 2014.
[31] L. McAtamney and E. N. Corlett. RULA : A survey method for the investigation of work-related upper limb disorders. Applied Ergonomics, 24(2) :91–99, 1993.
[32] E. J. McCormik and M. S. Sanders. Human Factors in engineering and design. 1987. [33] N. Musa, S. Z. Z. Abiddin, and N. Omar. Shared services in collaborative system
configura-tions. International Journal of Scientific & Engineering Research, 4(5) :124–129, 2013. [34] S. Nichols and H. Patel. Health and safety implications of virtual reality : a review of
empi-rical evidence. Applied Ergonomics, 33(3) :251–271, 2002. Fundamental Reviews in Applied Ergonomics 2002.
[35] G. Ostojic, V. Jovanovic, B. Stevanov, S. Stankovski, and I. Cosic. Collaborative design in the assembly systems. In Digital Enterprise Technology, pages 217–224. Springer US, 2007. [36] M. Pappas, V. Karabatsou, D. Mavrikios, and G. Chryssolouris. Ergonomic evaluation of
virtual assembly tasks. In Digital Enterprise Technology, pages 511–518. Springer US, 2007. [37] H. Patel, M. Pettitt, and J. R. Wilson. Factors of collaborative working : A framework for a
collaboration model. Applied ergonomics, 43(1) :1–26, 2012.
[38] C. Pontonnier, M. De Zee, A. Samani, G. Dumont, and P. Madeleine. Strengths and limitations of a musculoskeletal model for an analysis of simulated meat cutting tasks. Applied ergonomics, 45(3) :592–600, 2014.
[39] C. Pontonnier, G. Dumont, A. Samani, P. Madeleine, and M. Badawi. Designing and evaluating a workstation in real and virtual environment : toward virtual reality based ergonomic design sessions. Journal on Multimodal User Interfaces, 8(2) :199–208, 2014.
[40] C. Pontonnier, T. Duval, and G. Dumont. Sharing and bridging information in a collaborative virtual environment : Application to ergonomics. In Proceedings of the CogInfoCom 2013 (4th IEEE International Conference on Cognitive Infocommunications), pages 121–126, 2013. [41] C. Pontonnier, T. Duval, and G. Dumont. Collaborative virtual environments for
ergono-mics : Embedding the design engineer role in the loop. In Proceedings of the 3DCVE 2014 (International Workshop on Collaborative Virtual Environments), pages 17–21, 2014.
[42] C. Pontonnier, A. Samani, M. Badawi, P. Madeleine, and G. Dumont. Assessing the ability of a vr-based assembly task simulation to evaluate physical risk factors. IEEE Transactions on Visualization and Computer Graphics, 20(5) :664–674, 2014.
BIBLIOGRAPHIE 23
[43] E. Prasolova-FÃÿrland and M. Divitini. Supporting learning communities with collaborative virtual environments : Different spatial metaphors. In Proceedings of the ICALT 2002 (IEEE International Conference on Advanced Learning Technologies), pages 259–264, 2002.
[44] Y. Rahmawati, C. Utomo, N. Anwar, C. B. Nurcahyo, and N. P. Negoro. Theoretical framework of collaborative design issues. Jurnal Teknologi, 70(7) :47–53, 2014.
[45] A. Samani, C. Pontonnier, G. Dumont, and P. Madeleine. Kinematic synergy in a real and a virtual simulated assembly task. In Proceedings of the IEA2015 (19th Triennal Congress of the International Ergonomics Association), pages 1–7, 2015.
[46] A. Samani, C. Pontonnier, G. Dumont, and P. Madeleine. Shoulder kinematics and spatial pattern of trapezius electromyographic activity in real and virtual environments. PloS one, 10(3) :1–18, 2015.
[47] B. Schmitz. Great expectations-the future of virtual design. Computer-Aided Engineering, 14(10) :68, 1995.
[48] S. Volkov and J. M. Vance. Effectiveness of haptic sensation for the evaluation of virtual prototypes. ASME Journal of Computing and Information Sciences in Engineering, 1(2) :123– 128, 2001.
[49] T. R. Waters, V. Putz-Anderson, A. Garg, and L. J. Fine. Revised niosh equation for the design and evaluation of manual lifting tasks. Ergonomics, 36(7) :749–776, 1993.
[50] L. E. Whitman, M. Jorgensen, K. Hathiyari, and D. Malzahn. Virtual reality : its usefulness for ergonomic analysis. In Proceedings of the 36th conference on Winter simulation, pages 1740–1745. Winter Simulation Conference, 2004.
[51] J. R. Wilson. Virtual environments applications and applied ergonomics. Applied Ergonomics, 30(1) :3–9, 1999.
[52] G. Zachmann and A. Rettig. Natural and robust interaction in virtual assembly simulation. In Proceedings of the ISPE/CE 2001 (ISPE International Conference on Concurrent Enginee-ring : Research and Applications), July 2001.
![Figure 1 – Ideal VR-based framework for collaborative ergonomic design sessions. Adapted from [39, 40, 41].](https://thumb-eu.123doks.com/thumbv2/123doknet/11649899.308347/5.918.173.765.153.653/figure-ideal-framework-collaborative-ergonomic-design-sessions-adapted.webp)