HAL Id: hal-01095756
https://hal.archives-ouvertes.fr/hal-01095756
Submitted on 16 Dec 2014HAL is a multi-disciplinary open access archive for the deposit and dissemination of sci-entific research documents, whether they are pub-lished or not. The documents may come from teaching and research institutions in France or abroad, or from public or private research centers.
L’archive ouverte pluridisciplinaire HAL, est destinée au dépôt et à la diffusion de documents scientifiques de niveau recherche, publiés ou non, émanant des établissements d’enseignement et de recherche français ou étrangers, des laboratoires publics ou privés.
Vertical cell movement is a primary response of
intertidal benthic biofilms to increasing light dose
Rupert G. Perkins, Johann Lavaud, Joao Serôdio, Jean-Luc Mouget, Paolo
Cartaxana, Philippe Rosa, Laurent Barillé, Vanda Brotas, Bruno Jesus
To cite this version:
Rupert G. Perkins, Johann Lavaud, Joao Serôdio, Jean-Luc Mouget, Paolo Cartaxana, et al.. Vertical cell movement is a primary response of intertidal benthic biofilms to increasing light dose. Marine Ecology Progress Series, Inter Research, 2010, 416, pp.93-103. �10.3354/meps08787�. �hal-01095756�
Vertical cell movement is a primary response of intertidal benthic biofilms to
1
increasing light dose
2 3 4
Perkins, R.G.*1, Lavaud, J.2, Serôdio, J.3, Mouget, J-L.4; Cartaxana, P.5, Rosa, P.6, Barille, 5 L.6, Brotas, V.5 , Jesus, B.M.5,7 6 * corresponding author 7 8
*1. School of Earth, Ocean and Planetary Sciences, Cardiff University, Main Building, 9
Park Place, CF10 3YE Cardiff, UK E-mail: PerkinsR@cf.ac.uk, Tel.: +44-29-20874943, 10
Fax: +44-29-20874326 11
12
2. UMR CNRS 6250 „LIENSs‟, Institute for Coastal and Environmental Research (ILE), 13
University of La Rochelle, 2 rue Olympe de Gouges, 17042 La Rochelle Cedex, France. 14
15
3. Departamento de Biologia, Universidade de Aveiro, Aveiro, 3810-193, Portugal 16
17
4. Laboratoire de Physiologie et Biochimie Végétales, Faculté des Sciences et 18
Techniques, Université du Maine, EA2663, Av. O. Messiaen, 72085 Le Mans Cedex 9, 19
France 20
21
5. Centro de Oceanografia, Faculdade de Ciências da Universidade de Lisboa, 1749-016 22
Lisboa, Portugal. 23
24
6. Université de Nantes, EA 21 60 "Mer Molécules Santé", Faculté des Sciences et 25
Techniques, 2, rue de la Houssinière, BP 92 208, 44322 Nantes cedex 3, France 26
27
7. Centro de Biodiversidade, Genómica Integrativa e Funcional (BioFIG), Faculdade de 28
Ciências, Universidade de Lisboa, Lisboa, Portugal 29 30 31 32 33 34 35 36 37
Abstract
38 39
Intertidal soft sediment microphytobenthic biofilms are often dominated by diatoms 40
which are able to regulate their photosynthesis by physiological processes (e.g. down 41
regulation through the xanthophyll cycle, referred to as non-photochemical quenching, 42
NPQ) and behavioural processes (e.g. vertical cell movement in the sediment – biofilm 43
matrix). This study investigated these two processes over a 6 h emersion period using 44
chemical inhibitors under two light treatments (ambient light and constant light at 300 45
μmol m-2
s-1). Latrunculin A (Lat A) was used to inhibit cell movement and dithiothreitol 46
(DTT) to inhibit NPQ. HPLC analysis for chlorophyll a and spectral analysis 47
(Normalised Difference Vegetation Index, NDVI) indicated that Lat A significantly 48
inhibited cell movement. Photosynthetic activity was measured using variable 49
chlorophyll fluorescence and radiolabelled carbon uptake and showed that the non-50
migratory Lat A treated biofilms were severely inhibited as a result of the high 51
accumulated light dose (significantly reduced maximum relative electron transport rate, 52
rETRmax, and light utilization coefficient, α) compared to the migratory DTT and control
53
treated biofilms. No significant patterns were observed for 14C data, although a decrease 54
in uptake rate was observed over the measurement period. NPQ was investigated using 55
HPLC analysis of xanthophyll pigments (Diatoxanthin, DT and the percentage de-56
epoxidation of Diadinoxanthin, DD), chlorophyll fluorescence (change in maximum 57
fluorescence yield) and the second order spectral derivative index (Diatoxanthin Index, 58
DTI). Patterns between methods varied, but overall data indicated greater NPQ induction 59
in the non-migratory Lat A treatment and little or no NPQ induction in the DTT and 60
control treatments. Overall the data resulted in two main conclusions: firstly the primary 61
response to accumulated light dose was vertical movement, which when inhibited 62
resulted in severe down regulation / photoinhibition; secondly diatoms down regulated 63
their photosynthetic activity in response to accumulated light dose (e.g. over an emersion 64
period) using a combination of vertical migration and physiological mechanisms, which 65
may contribute to diel and/or tidal patterns in productivity. 66
67 68
Keywords: benthic, diatom, down regulation, migration, photophysiology, productivity
69 70 71
Introduction
72 73
Microphytobenthic biofilms at the surface of intertidal estuarine sediments are 74
highly productive (Brotas and Catarino, 1995; MacIntyre et al., 1996; Underwood and 75
Kromkamp, 1999). The regulatory mechanisms controlling the magnitude and periodicity 76
of this productivity are partly understood as involving sun angle and tidal patterns 77
(Pinckney and Zingmark, 1991) as well as changes in light dose exposure (Kromkamp et 78
al., 1998; Serôdio and Catarino, 1999; Perkins et al. 2002, Jesus et al. 2005). For the latter 79
it has been hypothesised (Kromkamp et al., 1998; Serôdio and Catarino, 1999; Perkins et 80
al. 2002; Jesus et al., 2006a) that cells optimise their position within the surface layers of 81
a sediment biofilm, utilising sediment light attenuation to provide an optimal light 82
environment; this is the concept of microcycling. The importance of vertical movement to 83
regulate light exposure has recently been demonstrated thoroughly using chemical 84
inhibition of movement (Cartaxana and Serôdio, 2008; Cartaxana et al. 2008). However, 85
this is the first study to directly compare the roles of vertical movement, a behavioural 86
form of photosynthetic down regulation (e.g. Perkins et al. 2002), with physiological 87
down regulation in the form of non-photochemical quenching (NPQ; e.g. Lavaud, 2007). 88
Effectively diatom cells move vertically through the sediment matrix utilising 89
extracellular polymers in response to changes in light environment: too much light, cells 90
move downwards, not enough light, cells move upwards. This is a simplification however 91
as the cumulative effect of light exposure over time modifies this response (Perkins et al. 92
2002, 2006; Jesus et al., 2006b). It should be emphasised as well, that this microcycling 93
movement over short time scales is distinct from the bulk movements of cells as vertical 94
migration (Underwood and Kromkamp, 1999; and see the review by Consalvey et al., 95
2004) driven by tidal and sun angle driving forces as originally outlined by Pinkney and 96
Zingmark (1991). 97
Why do diatom cells require an optimum light environment to maximise their 98
photosynthetic potential? It is well known that excess light can lead to photodamage by 99
production of free radicals and superoxides which may lead to protein breakdown in 100
photosystem II reaction centres, e.g. the D1 dimer (Olaizola et al., 1994; Materna et al, 101
2009). Cells can hence prevent such damage through two processes, both of which 102
effectively down regulate photosynthetic activity. Firstly, cells can migrate downwards 103
away from high light that could result in a photodamaging light dose. This is effectively a 104
behavioural form of down regulation (Kromkamp et al., 1998; Serôdio and Catarino, 105
1999; Perkins et al. 2001; Mouget et al., 2008). Secondly cells can down regulate by 106
diverting excess light energy away from PSII reaction centres via alternative energy 107
pathways (Ting and Owens, 1993; Lavaud et al., 2002a; Goss et al., 2006; Lavaud, 2007; 108
Serodio et al., 2008). This physiological process of down regulation is often referred to 109
as non-photochemical quenching (NPQ) as it quenches the energy using energy 110
conversions with no photochemical output. The process utilises energisation of the 111
thylakoid membrane by generation of a proton gradient, which induces de-epoxidation of 112
diadinoxanthin to diatoxanthin (DT) known as the xanthophylls cycle (Lavaud et al., 113
2002a, 2004, 2007; Goss et al., 2006). DT competes for light energy with chlorophyll 114
pigments in the light harvesting complexes, hence diverting the energy away from the 115
pathway that would lead to generation of harmful reducing agents created by over 116
excitation of PSII reaction centres (Lavaud, 2007; Ruban et al., 2004). Diatoms are 117
known to have highly effective xanthophyll cycle and are able to rapidly induce NPQ in 118
response to increasing light levels (Goss et al., 2006; Lavaud, 2004, 2007; Ruban et al., 119
2004; Serodio et al., 2005, 2008) even so far as to induce short term photoacclimation 120
through NPQ induction in the time required for 30 second rapid light curves, e.g. over a 4 121
minute period (Perkins et al., 2002; Perkins et al., 2006; Cruz and Serodio, 2008). 122
Diatom cells in surface biofilms can therefore respond to changing light 123
environments, and hence accumulated historical light doses, through two mechanisms, 124
vertical cell movement within the sediment matrix, or NPQ induction. These processes 125
are now well understood, e.g. Consalvey et al. (2004), Kromkamp et al. (1998), Perkins et 126
al. (2002), Spilmont et al. (2007) and Mouget et al. (2008) regarding light induced cell 127
movement and Lavaud (2007) and Perkins et al. 2006 regarding NPQ. Also how does the 128
down regulation effect net productivity and how does this vary in response to the light 129
dose over a low tide emersion period? This study aimed to address these questions 130
through manipulative experiments using engineered biofilms treated with chemical 131
inhibitors, under two different light dose regimes. Chemical treatments comprised 132
inhibition of cell motility using Latrunculin A which inhibits actin filaments involved in 133
diatom movement without affecting photosynthetic activity (Cartaxana et al. 2008) and 134
also the use of DL-dithiothreitol which inhibits the de-epoxidation of DD to DT, and 135
hence inhibits NPQ induction (Lavaud et al., 2002b). These treatments were compared to 136
controls over a 6 hour emersion period under two light treatments, ambient light and a 137
constant low light environment. Thus the roles of cell movement and NPQ induction 138
were compared as functions of the increasing photodose accumulated over the emersion 139 period. 140 141 Methods 142
143 144
Experimental design and sampling
145
Surface mud to a depth of approximately 1 cm was collected on the 1st July 2008 from 146
Alcochete mudflat, located on the eastern shore of the Tagus Estuary (38 44' N, 9 08' W), 147
composed of slightly gravelly mud (Jesus et al 2006c). All experimental measurements 148
were carried out on the following day, 2nd July 2008. The mud and surface biofilm was 149
returned to the laboratory where a sub-sample was examined by light microscopy to 150
determine the dominance of epipelic diatoms in the biofilm. The remainder of the surface 151
mud was thoroughly mixed by hand and then evenly spread in trays to a depth of 5 cm. A 152
shallow depth of site water (< 2 cm) was carefully added so as not to re-suspend the mud 153
and the trays were left overnight in the laboratory. The following morning, at the start of 154
the low tide emersion predicted for the original sample site, the shallow depth of site 155
water was removed and a spectroradiometer (see below) was used to monitor the 156
establishment of surface biomass in one of the sample trays. Plastic cores (2 cm × 2.5 cm 157
diameter) were then carefully inserted into the mud to isolate minicore sediment samples 158
in each sediment tray for the following chemical treatments: controls (addition of filtered 159
site water only), Latrunculin A (Lat A, dissolved in site water) to inhibit cell motility and 160
DL-dithiothreitol (DTT, in site water) to inhibit conversion of DD to DT and hence 161
inhibit non-photochemical quenching (NPQ). Full details of these treatments are given 162
below. Three replicates for each chemical treatment were used to provide independent 163
samples for the following measurement: rapid light response curves using PAM-164
fluorescence, spectroradiometry, sampling for pigment analysis using HPLC (minicore 165
set 1) and 14C radiolabelled measurement of primary productivity (minicore set 2). Hence 166
6 minicores were needed for each treatment for each time sampling point (n = 3, T1, 2 167
and 3 equally spaced 2 h apart). Finally the number of minicores was duplicated in a 168
second sample tray to enable two light treatments to be investigated, ambient light and 169
constant light (300 μmol m-2
s-1). Note that all light levels referred to were measured with 170
a Licor cosine corrected light meter and refer to photosynthetically active radiation, 400 – 171
700 nm. The constant light was provided by a quartz white light source (400W HPI-T Pro 172
Philips). The experimental set up is summarized in Table 1. Ambient light treatment 173
(Amb) and constant low light treatment (Con) were identical other than their respective 174
light dose exposures calculated by integration over time of light measurements taken 175
using a Licor cosine corrected light meter every 30 minutes during the experimental 176
period. Finally, all treatments were applied once the biofilm had established at the 177
sediment surface as assessed by the stabilization of the NDVI reflectance readings; hence 178
chemical and light treatments were applied to established surface biofilms rather than 179
prior to upward cell migration. Measurements using the following methodologies were 180
taken at equal time intervals of 2 h at T1, T2 and T3, hence covering a 6 h exposure 181
period typical for the original sample site. Experiments were carried out under ambient 182
light on the roof of the Instituto de Oceanografia de Lisboa, Lisbon, Portugal. Engineered 183
biofilm trays were incubated in temperature controlled water tanks to minimise potential 184
over-heating (maximum temperatures measured at the sediment surface during the 185
experimental period were 35C, comparable to those measured in situ). Light dose was 186
calculated for each sampling point T1, T2, T3 by integrating the light measurements 187
(using a Licor cosine corrected light meter) over the preceeding time period. 188
Chemical preparation and application
190
Controls – 400 μL of filtered site water was added to all cores to mimic chemical 191
treatments but without addition of DTT or Lat A (see below). 192
DTT - DL-dithiothreitol (Sigma) was prepared as a fresh stock on the morning of the 193
experimental period. A stock solution of 20 mM (in ethanol) was diluted 100 times in 194
freshly filtered site water to reach a final concentration of 200 µM. 400 μL of this 195
solution were added to each core in order to cover the whole surface of the sediment. 196
Given the dimensions of the cores, the amount of DTT added in each core was 0.17 197
µmoles. This amount of DTT was previously determined to be sufficient to virtually fully 198
inhibit the conversion of DD in DT in a 10 µg Chl a mL-1 suspension Phaeodactylum 199
tricornutum (100% inhibition with 0.2 µmol DTT) (Lavaud et al., 2002b).
200
Latrunculin A - A concentrated Latrunculin A solution (1 mM) was prepared as a fresh 201
stock on the morning of the experimental period by dissolving purified Lat A (Sigma-202
Aldrich) in dimethylsulfoxide. A solution of 12.5 M Lat A was prepared by dissolving 203
the appropriate amount of the concentrated stock solution in filtered water collected at the 204
sampling site. Small volumes of this solution (total of 300 L) were applied to 205
undisturbed sediment samples by carefully pipetting directly onto the sediment surface, 206
until forming a continuous thin layer that completely covered the sample. The amount of 207
Lat A used was previously determined to be sufficient to virtually inhibit diatom 208
migration in benthic biofilms (Cartaxana and Serôdio, 2008). The inhibitor was applied 209
after the formation of the biofilm at the sediment surface during the period coinciding 210
with the beginning of low tide at the sampling site. 211
Spectral reflectance
Spectral reflectance was measured with a USB2000 (Ocean Optics, Dunedin, 213
USA) with a VIS-NIR optical configuration controlled by a laptop using OOIBase32™ 214
software. The spectroradiometer sensor was positioned at a 45º angle pointing at the 215
center of the minicore and measuring an approximate area of 1 cm2. Reflectance spectra 216
of the target surface were calculated by dividing the upwelling spectral radiance from the 217
sediment surface (Lu) with the reflectance of a clean white polystyrene plate (Ld) both
218
spectra were corrected for dark noise (Dn) (electronic signal measured at total darkness):
219
(Equation 1) 220
Reflectance = (Lu - Dn)/(Ld -Dn) (1)
221
The polystyrene plates differed less than 3% from a calibrated 99% reflectance 222
standard plate (Spectralon) (Forster and Jesus, 2006). The normalized vegetation index 223
(NDVI) was calculated as follows: 224
(Equation 2) 225
NDVI = (InfraRed - Red)/(InfraRed + Red) (3)
226
where InfraRed is the average reflectance of the rage 748-752 nm and Red the 227
average reflectance of the range 673-677 nm. 228
Reflectance derived indices are susceptible to background noise and are not 229
sensitive enough to detect the didinoxanthin (DD) to diatoxanthin (DT) pigment 230
conversion that occur during the xanthophyll cycle. Using diatom cultures Jesus et al. 231
(2008) showed that the conversion of DD to DT causes a reflectance decrease at 508 that 232
is proportional to DT content. However, this decrease was so small that only an index 233
based on the second derivative spectrum was appropriate to detect it. Their DT index 234
(DTI) used the second derivative peak at 508 nm normalized by the second derivative 235
peak at 630 nm and showed very promising results in the determination of diatom DT 236
content. Thus, DTI was used in the current study as a proxy for the DT present at the 237
sediment surface. 238
The derivative spectra () were calculated using a finite approximation method 239
(Louchard et al. 2002), after smoothing the reflectance spectra with a natural cubic spline 240
function (60 nodes). The second derivative () was chosen because in theory it 241
eliminates the background effects and strongly enhances minute changes in the 242
reflectance spectra. This would be ideal in intertidal estuarine sediments where the 243
background signal can be strongly influenced by organic matter, sediment type and 244
moisture. The second derivative spectra were only calculated for the ambient light 245
treatment due to the high noise spectra generated by the lamps used in the constant light 246
treatment. 247
248
Rapid light response curves
249
Rapid light response curves were obtained using a Walz Water-PAM fluorimeter 250
and following the methodology of Perkins et al. (2006) except that 20 second light step 251
increments were used rather than 30 seconds due to time constraints. Settings on the 252
Water-PAM were as follows: saturating pulse at setting 10 (approximately 8,600 μmol m -253
2
s-1 PAR) for 600 ms duration; light curve settings of 20 second light step duration 254
covering 0 – 1035 μmol m-2 s-1 PAR (previously determined as adequate to produce fully 255
saturated light curves for biofilms from this site); due to time restrictions during the 256
experimental period, increasing light level steps using the Water-PAM programming 257
were used rather than preferred decreasing light steps using Win Control (Perkins et al., 258
2006). Light curve measurements were taken in a random order between chemical 259
treatments, however at each time point, ambient light measurements were made prior to 260
constant light measurements. Once spectral reflectance and fluorescence measurements 261
had been made, the same minicores were destructively sampled for pigment analysis (see 262
below) with care to ensure that the area sampled was not that exposed to the light dose 263
applied by the rapid light curve. 264
Analysis of rapid light curves also followed that described by Perkins et al. (2006) 265
with curve fitting following the iterative solution of Eilers and Peeters (1988) to 266
determine coefficients a, b and c. Following this, light curve parameters of relative 267
maximum electron transport rate (rETRmax), coefficient of light use efficiency (α) and
268
light saturation coefficient (Ek) were calculated from the parameters a, b and c following
269
the equations in Eilers and Peeters (1988). The software used for curve fitting and 270
regression analysis to determine curve parameters was Sigmaplot V11. Non-271
photochemical quenching (NPQ) was calculated as the change in maximum fluorescence 272
yield (NPQ = (Fm - Fm’)/Fm’), where Fm was taken as the initial value recorded in the
273
rapid light curve (e.g. after 30 seconds of darkness). 274
275
Pigment analysis
276
Approximately 50 mg of freeze-dried sediment were extracted in 95% cold 277
buffered methanol (2% ammonium acetate) for 15 min at –20°C, in the dark. Samples 278
were sonicated (Bransonic, model 1210) for 30 s at the beginning of the extraction 279
period. Extracts were filtered (Fluoropore PTFE filter membranes, 0.2 μm pore size) and 280
immediately injected in in a Shimadzu HPLC with photodiode array and fluorescence 281
(Ex. 430 nm; Em. 670 nm) detectors (Cartaxana and Brotas, 2003). Chromatographic 282
separation was carried out using a C18 column for reverse phase chromatography 283
(Supelcosil; 25 cm long; 4.6 mm in diameter; 5 m particles) and a 35 min elution 284
programme. The solvent gradient followed Kraay et al. (1992) with a flow rate of 0.6 mL 285
min-1 and an injection volume of 100 L. Pigments were identified from absorbance 286
spectra and retention times and concentrations calculated from the signals in the 287
photodiode array detector or fluorescence detectors. Calibration of the HPLC peaks was 288
performed using commercial standards from Sigma-Aldrich and DHI (Institute for Water 289
and Environment). Samples were analysed for the xanthophyll pigments DD (the 290
epoxidised form) and DT (the de-epoxidised form). The state of de-epoxidation (DEP in 291
%) was calculated as DT/(DD+DT) x 100%. 292
293
Radiolabelled carbon uptake
294
Total primary productivity (μg C [μg Chl a]–1 h–1) was measured from sub-295
samples of 14C-labelled biofilm. Minicores were incubated in situ with labelled 14C 296
sodium bicarbonate. One mL (370 Bq) of label was added to each core and allowed to 297
diffuse in the dark for 30 min. After dark diffusion (Smith and Underwood 1998) a 30 298
min incubation was carried out in both the ambient light and the constant light treatments, 299
terminated by addition of 5% gluteraldehyde. The surface 2 mm depth (approximately) of 300
each minicore was extracted and transferred to an Eppendorf. Sediment samples were 301
later freeze-dried and had inorganic label driven off by addition of concentrated HCl for 302
24 h. After addition of scintillant cocktail (Optiphase Safe, Fisons, Loughborough, UK), 303
carbon uptake rates were calculated from counts obtained from a Packard Tricarb460C 304
scintillation counter (LKB, Cambridge, UK) with internal quench correction. Counts 305
were corrected for self-quenching by the sediment using radiation standard curves with 306
and without sediment addition. Self quenching reduced counts by 2 to 5%. 307
308
Statistical analysis
309
Significant difference was determined using two factor ANOVA with chemical treatment 310
(Lat A, DTT or controls) nested within light treatment (ambient or constant light) nested 311
within time (T1, 2, and 3). This resulted in 3 replicates for each of the 3 chemical 312
treatments nested within 2 light treatments within 3 time points. Normality and 313
homogeneity of variance of data were tested using the Kolmogorov-Smirnov test 314
followed by Bartletts or Levenes test (for normal or non normal data respectively). If data 315
did not have equal variance then a log transformation was applied (Zar, 1999). In all 316
cases data were normal and non-parametric testing was not required. All tests were 317
applied using Minitab V15 software. 318
319
Results
320
Accumulated light dose
321
The light dose calculated for ambient light and the constant light treatment (Table 322
2), showed a slightly higher accumulated dose for the constant light treatment at T1, 323
which was reversed by T2. However it was not until T3 that the difference in light dose 324
between the two treatments was significantly large, with a light dose under ambient light 325
being 2.6 times that under constant light. 326
Migration
Visual observation of the biofilms showed clear downward migration of cells over 328
the experimental time period except for the Lat A treatment which showed no difference 329
in appearance (Authors pers. obs.). This was largely corroborated by the pigment data 330
(Chl a) which showed clear declines in surface biomass by time T3 (Figure 1) for 331
controls and DTT treatments under constant light (F2,26 = 25.90, p < 0.01) and under
332
ambient light (F2,26 = 14.05, p < 0.01), but with no pattern of decline for the Lat A
333
treatment. Migration monitored using the spectral reflectance NDVI index (Figure 2) 334
showed a similar result, with a decrease in surface biomass under ambient light for all 335
three chemical treatments (F2,26 = 23.4, p < 0.01) between T2 and T3, although the
336
percentage decline for Lat A was only half that of the DTT treatment and the controls. 337
Under constant light, no data were obtained for T1, however between T2 and T3 there 338
was a significant (F2,17 = 18.6, p < 0.05) decline for the controls and DTT treatment, but
339
no decline for the Lat A treatment. Overall, the Lat A clearly inhibited cell vertical 340
migration compared to the other two treatments. 341
342
Fluorescence data
343
There was a significant decrease (F2,26 = 8.403, p < 0.01) in rETRmax over the
344
experimental period for all treatments, although the magnitude of the decline was lower 345
in treatments under constant light compared to those under higher ambient light (Figure 346
3). There was no significant difference in rETRmax between treatments at time T1 or T2,
347
however by T3 the Lat A treatment showed a significantly lower (F2,26 = 7.444, p < 0.05)
348
value than controls and the DTT treatment for both light treatments. The magnitude of 349
this difference was clearly larger under ambient light compared to constant light. There 350
was no significant difference between controls and the DTT treatment under either light 351
environment. 352
Under constant light, α showed no significant pattern over time (Figure 4), 353
although in general slight decreases (noticeable most for the DTT treatment) were 354
observed. However under ambient light, α significantly decreased (F2,26 = 6.281, p <
355
0.05) in all three treatments, with the decrease for the Lat A treatment being significantly 356
greater (F2,26 = 6.810, p < 0.05) than either controls or DTT treatments. The value for the
357
Lat A treatment at T3 was essentially zero (0.0005 rel. units compared to an initial value 358
of 0.25 real. units). The light saturation coefficient (Ek) followed exactly the same
359
patterns as described above for rETRmax, due to the magnitude of change in rETRmax
360
dominating the shape of the light response curves, rather than that of α (note Ek =
361
rETRmax /α).
362
Productivity (14C uptake rate)
363
Due to a high level of variation in values between replicates of the same 364
treatment, no significant differences were observed between chemical treatments in either 365
ambient light or constant light (Figure 5). There was also no significant difference 366
between light treatments, however over time, all data showed a significant decrease (F2,26
367
= 15.08, p < 0.01). Productivity did not correlate with rETRmax uptake within chemical
368
treatments, although the temporal decline for all data showed a significant correlation (r = 369
0.63, n = 27, p < 0.05) with rETRmax (Figure 6). It should be noted that the 14C has a
370
lower resolution than the fluorescence methodology, with measurements effectively 371
integrated over the surface 5 mm of the sediment rather than restricted to surface and near 372
surface analysis for the latter method. 373
Non photochemical quenching (NPQ)
374
NPQ calculated from the change in maximum fluorescence yield (Fm-Fm‟)/Fm‟,
375
surprisingly showed negligible induction. In all cases the decline in quantum efficiency 376
(ΔF/Fm‟) was the result of an increase in F‟ relative to Fm‟ (Figure 7), Fm‟ initially
377
declined before showing an asymptotic increase. Such a pattern resulted in small values 378
of NPQ (< 0.20) at low light, followed by a decrease to near zero, or often less than zero, 379
at light levels at and above 320 μmol m-2
s-1 PAR (data not shown). DT measured by 380
spectral analysis showed little change in the three treatments by T1 and T2 (Figure 8), 381
however by T3 the DTI values were greater for the non-migratory Lat A treatment 382
compared to the migratory biofilms in both controls and the DTT treatments. This 383
method is under development, but clearly shows a treatment effect for the Lat A 384
treatment regarding NPQ induction compared to the other two treatments. This overall 385
pattern was corroborated by concomitant samples analysed by pigment analysis (Figure 386
9). Data for pigment analysis expressed as DD de-epoxidation (%), DT/Chl a and
387
DT+DD/Chl a are shown in comparison with corresponding spectral derivative analysis. 388
These data showed little (non-significant) change under constant low light, however 389
under high light, both DD de-epoxidation and DT/Chl a showed significantly higher 390
values by T3 (F2,26 = 157.67 p < 0.001) for the Lat A treatments compared to controls and
391
the DTT treatment. 392
Discussion
394
These data clearly indicate that, for these biofilms at least, benthic diatoms 395
principally employ vertical migration as their first main mechanism in response to 396
increasing light dose exposure. This is concluded from the significant photoinhibition of 397
the Lat A treated biofilms, with probable enhanced level of physiological down 398
regulation through NPQ, when compared to the two migratory treatments, DTT treated 399
biofilms and controls. In simple terms, cells migrated vertically in response to increasing 400
light dose over time, but when vertical movement was inhibited by Lat A, NPQ induction 401
increased, but not sufficiently to prevent photoinhibition. This is in agreement with the 402
light induced vertical movement (microcycling) proposed by Kromkamp et al. (1998), 403
Serôdio and Catarino (1999) and Perkins et al. (2002), and also further emphasises the 404
role of vertical movement demonstrated in other experiments using the same chemical 405
inhibitors (Cartaxana and Serôdio 2008; Cartaxana et al. 2008). 406
Migration was significantly inhibited by the addition of Lat A (Figures 1 and 2), 407
in agreement with work by Cartaxana et al. (2008) and Cartaxana and Serôdio (2008). 408
This was apparent through analysis of Chl a pigment in the surface 2 mm (a 409
comparatively low resolution method) and the surface chlorophyll proxy, NDVI. Both 410
methods showed no major change over the experimental period, whereas for controls and 411
the DTT treated biofilms, significant decreases in biomass were observed. It should be 412
noted that there was no significant difference in biomass between DTT treatment and 413
controls, indicating that DTT did not induce an increase or decrease in cell movement 414
relative to controls. It should also be noted that patterns were largely the same between 415
ambient light and constant light, thus the magnitude of the photodose did not enhance 416
migration. This latter point could have two explanations. Firstly the magnitude of the 417
vertical migration may have been predominantly determined by an endogenous tidal 418
rhythm (e.g. Serôdio et al. 1997) rather than the light dose. Secondly micro-cycling of 419
cells (Kromkamp et al. 1998; Perkins et al. 2002) may have resulted in similar light dose 420
exposure, irrespective of the two light treatments. Thus the integrated light dose of cells 421
cycling through the surface of the sediment was not significantly greater in the ambient 422
light treatment (this being the product of light intensity and length of exposure) compared 423
to cells at lower light level in the constant light treatment. It is likely that both processes 424
played a role in the migratory pattern of the controls and DTT treated cells, however 425
differentiation between these two driving functions was not an explicit aim of this study. 426
Also it should be noted that comparison of ambient light data at T2 and constant light 427
data at T3, which related to biofilms that had been exposed to similar overall light dose, 428
showed subtle differences in fluorescence values (rETRmax and α), demonstrating that 429
light dose was not the sole driving function of the differences observed. Furthermore 430
NPQ induction were investigated over the 6 h emersion period and hence the resolution 431
of the measurements did not analyse short term patterns in NPQ induction. It is well 432
known that diatoms may rapidly induce NPQ in response to short term (10s of seconds) 433
changes in light environment (e.g. Perkins et al. 2006). The role of the comparatively 434
long term light dose effect can be noted by the fact that it was not until T3, when the 435
difference in light dose between the two treatments was greatest (Table 2), that 436
differences between the chemical treatments were of highest magnitude. 437
Over the exposure period, relative maximum electron transport rate (rETRmax)
438
decreased in all treatments (Figure 3). This may have been the result of an endogenous 439
diel rhythm (Underwood et al. 2005) and / or the effect of the increasing photodose. As 440
the magnitude of the decrease was greatest under ambient light, compared to the lower 441
photodose experienced under constant light, both an endogenous decrease and a 442
photodose effect seem likely. The magnitude of this decrease in rETRmax was greatest for
443
Lat A treated biofilms, but only significantly so under ambient light, indicating the 444
inhibition of cell vertical movement resulted in photoinhibition. This pattern was also 445
indicated by the decline to effectively zero by the light use efficiency coefficient (α) for 446
the Lat A treated biofilms under ambient light (Figure 4). Clearly this higher photodose 447
induced photoinhibition (possibly photodamage) when cells were unable to migrate away 448
from the sediment surface. It should be noted that no difference was observed between 449
the DTT treated biofilms and the controls. Therefore it can be concluded that inhibition of 450
NPQ (DTT treatment) had no significant impact whereas inhibition of migration (Lat A 451
treatment) resulted in a reduction in both rETRmax and α, but only when the light dose
452
was sufficiently high compared to the constant light treatment. 453
It is unlikely that the decrease in photosynthetic activity over the experimental 454
period was the result of increasing environmental stress in response to experimental 455
conditions. In fact the use of the water bath may have reduced temperature stress relative 456
to in situ temperature increases, and the biofilms showed no obvious drying out for any of 457
the treatments. In situ warming and desiccation are likely to be equal to or greater than 458
those experienced during this study, thus any temporal pattern is likely to occur under in 459
situ conditions as well. In addition, as all chemical treatments were exposed to the same 460
stress, albeit a lower warming under constant light, experimental induced stresses cannot 461
explain the differences between the Lat A treatment and the controls and DTT treatment. 462
Productivity, when measured by 14C uptake rate, showed no chemical or light 463
treatment effects, indeed the only significant pattern observed was an overall temporal 464
decline over the experimental period for the whole dataset. This decline correlated with 465
that of rETRmax (Figure 6) supporting the statement above that a combination of diel
466
rhythm and light dose exposure resulted in a decrease in photosynthetic activity. The lack 467
of any chemical treatment effect could be due to two reasons. Firstly the method 468
effectively integrates the productivity measurement over the surface 5 mm depth of 469
sediment, hence resulting in a weighted average value dependent upon the biomass 470
distribution over this depth. Secondly the chemical treatments may not have been fully 471
active at depth despite the pre-measurement 30 minute incubation period, hence resulting 472
in cell migration towards the surface of cells able to replenish the surface biofilm with 473
photosyntheticaly active cells. The former seems more probable as an explanation as the 474
latter would have resulted in a surface biomass enrichment in the Lat A treatment (i.e. 475
cells would have migrated to the surface and then been unable to migrate back down due 476
to the chemical treatment), which was not observed. 477
Analysis of the data indicating induction of non-photochemical quenching (NPQ) 478
is not so clear cut. In all biofilms, the quenching of the photochemical efficiency 479
(ΔF/Fm‟) was the result of an increase in F’ and not a quenching of the Fm’ yield. This
480
indicates a low level or even lack of induction of NPQ as indicated by the calculated 481
values (NPQ = (Fm-Fm’)/Fm’). For the migratory biofilms the data must be interpreted
482
with care as downward migration between measurements of Fm and Fm’) results in an
483
increase in the calculated value of NPQ solely due to the increased distance between the 484
cells and the fluorimeter probe (e.g. Consalvey et al. 2005; Perkins et al. in press). 485
However this would have increased the magnitude in difference between the non-486
migratory (Lat A) and migratory (controls and DTT) treatments. In comparison, both the 487
spectral derivative (Figure 8) and the pigment analysis (Figure 9) for biofilms under 488
ambient light indicated a greater level of NPQ induction in the Lat A treated biofilms. 489
Under constant light there was no difference between controls and DTT treated biofilms 490
and no difference between chemical treatments. Thus a photodose effect was observed 491
whereby the higher ambient light photodose induced a greater level of NPQ when cell 492
vertical movement was inhibited. Diadinoxanthin de-epoxidation as well as the relative 493
Diatoxanthin (DT) concentration (DT/Chl a) both showed the same patterns. Interestingly 494
there was no increase in (DD+DT) concentration, indicating no de novo synthesis but a 495
conversion of DD to DT as the primary NPQ mechanism. This is an expected result in 496
response to high light exposure (Lavaud et al., 2004; Schumann et al. 2007). The lack of 497
any significant effect of DTT treatment compared to controls may imply that the DTT 498
dose was insufficient to inhibit NPQ induction. Certainly under ambient light, pigment 499
data show an induction of NPQ in both these treatments relative to the constant light 500
treatment. However the spectral derivate did not show this pattern, nor did fluorescence 501
data indicate NPQ induction for any treatment. In addition the magnitude of NPQ 502
induction in controls and DTT treatments was significantly less than in the Lat A 503
treatment. Therefore the overall pattern in the combined datasets indicate that cell vertical 504
movement was more important in optimizing photosynthetic activity, rather than NPQ 505
induction. 506
In conclusion, this study has two main findings. Firstly optimization of 507
photosynthetic activity in response to an increasing exposure to light (i.e. an accumulated 508
light dose response) is largely due to vertical cell migration. Cells position themselves in 509
the sediment surface layer such that the attenuation of light provides an optimal light 510
environment for their photochemistry. This is in agreement of the microcycling and light 511
induced vertical migration responses reported by Kromkamp et al. (1998), Serodio and 512
Catarino (2000) and Perkins et al. (2002). In addition, it goes towards explaining the fact 513
that integrated biofilm light response curves examined in literature seem to saturate at 514
400 – 800 μmol m-2 s-1 PAR (see Perkins et al., 2002, 2006; Serôdio et al., 2003; 515
Consalvey et al., 2005; Jesus et al., 2005, 2006 and others), significantly lower than 516
ambient light levels at the sediment surface on a sunny day. It seems logical then that 517
cells would position themselves in a light environment nearer to 800 μmol m-2
s-1 PAR or 518
lower, rather than expose themselves to the potentially photodamaging light intensities at 519
the sediment surface. This cell migration may well be more energetically favorable than 520
physiological down regulation processes such as NPQ induction. It is hypothesized from 521
this data that NPQ is a secondary response to light dose and / or a response to more rapid 522
changes in light environment rather than a longer term increase in light dose. Secondly 523
these data suggest that a probable combination of vertical migration and physiological 524
mechanisms result in a diel and/or tidal pattern of down regulation. Underwood et al. 525
(2005) reported diel down regulation at the single cell level, and other studies suggest 526
probable tidal patterns for integrated biofilm measurements (Perkins et al., 2001; Jesus et 527
al., 2005, 2006). Again it is logical that after adequate light exposure for photosynthate 528
production, cells would down regulate their photosynthetic activity. Hence this diel 529
pattern may be a response to integration of the light dose over time, rather than an 530
endogenous rhythm. Hence this study has shown overall, the importance of cell vertical 531
movement as a driving function optimizing photosynthetic activity in response to light 532
dose for benthic biofilms dominated by diatoms. 533
References
535
Brotas V, Cabrita T, Portugal A, Serôdio J, Catarino F (1995) Spatio-temporal distribution 536
of the microphytobenthic biomass in intertidal flats of Tagus Estuary (Portugal). 537
Hydrobiologia 300/301:93-104. 538
Cartaxana P, Brotas V (2003) Effects of extraction on HPLC quantification of major 539
pigments from benthic microalgae. Archiv Hydrobiol 157: 339-349. 540
Cartaxana P, Serôdio J (2008) Inhibiting diatom motility: a new tool for the study of the 541
photophysiology of intertidal microphytobenthic biofilms. Limnol Oceanogr Meth 6:466-542
476. 543
Cartaxana P, Brotas V, Serôdio J (2008) Effects of two motility inhibitors on the 544
photosynthetic activity of the diatoms Cylindrotheca closterium and Pleurosigma 545
angulatum. Diatom Res 23: 65-74.
546
Consalvey M, Paterson DM, Underwood GJC (2004) The ups and downs of life in a 547
benthic biofilm: Migration of benthic diatoms. Diatom Res 19:181-202 548
Consalvey M, Perkins RG, Underwood GJC, Paterson DM (2005) PAM Fluorescence: A 549
beginners guide for benthic diatomists. Diatom Res 20:1-22. 550
Cruz S, Serodio J (2008) Relationship of rapid light curves of variable fluorescence to 551
photoacclimation and non-photochemical quenching in a benthic diatom. Aquat Bot 88: 552
256-264 553
Eilers PCH, Peeters JCH (1988) A model for the relationship between light intensity and 554
the rate of photosynthesis in phytoplankton. Ecol Model 42:199-215. 555
Forster RM, Jesus B (2006) Field spectroscopy of estuarine intertidal sediments. Int J 556
Remote Sens 27:3657-3669. 557
Goss R, Ann Pinto E, Wilhelm C, Richter M (2006) The importance of a highly active 558
and ΔpH-regulated diatoxanthin epoxidase for the regulation of the PS II antenna 559
function in diadinoxanthin cycle containing algae. J Plant Physiol 163:1008-1021. 560
Jesus B, Brotas V, Marani M, Paterson DM (2005) Spatial dynamics of 561
microphytobenthos determined by PAM fluorescence. Estuar Coast Shelf Sci 65: 30-42. 562
Jesus B, Perkins RG, Consalvey M, Brotas V, Paterson DM, (2006a) Effects of vertical 563
migrations by benthic microalgae on fluorescence measurements of photophysiology. 564
Mar Ecol Prog Ser 315:55-66. 565
Jesus B, Perkins RG, Mendes CR, Brotas V, Paterson DM (2006b) Chlorophyll 566
fluorescence as a proxy for microphytobenthic biomass: alternatives to the current 567
methodology. Mar Biol 150:17-28. 568
Jesus B, Mendes CR, Brotas V, Paterson DM (2006c) Effect of sediment type on 569
microphytobenthos vertical distribution: Modelling the productive biomass and 570
improving ground truth measurements. J Exp Mar Biol Ecol 332:60-74. 571
Jesus B, Mouget JL, Perkins RG (2008) Detection of diatom xanthophyll cycle using 572
spectral reflectance J Phycol 44:1349-1359. 573
Kraay GW, Zapata M, Veldhuis M (1992) Separation of chlorophylls c1, c2, and c3 of
574
marine phytoplankton by reversed-phase C18 high-performance liquid chromatography. 575
J. Phycol. 28:708-12. 576
Kromkamp J, Barranguet C, Peene J (1998) Determination of microphytobenthos PSII 577
quantum efficiency and photosynthetic activity by means of variable chlorophyll 578
fluorescence. Mar Ecol Prog Ser 162:45-55. 579
Lavaud J (2007) Fast regulation of photosynthesis in diatoms: Mechanisms, evolution 580
and ecophysiology. Funct Plant Sci Biotech 1:267-287. 581
Lavaud J, van Gorkom H, Etienne A (2002a) Photosystem II electron transfer cycle and 582
chlorespiration in planktonic diatoms. Photosynth Res 74: 51-59. 583
Lavaud J, Rousseau B, van Gorkom H, Etienne A-L (2002b) Influence of the 584
diadinoxanthin pool size on photoprotection in the marine planktonic diatom 585
Phaeodactylum tricornutum. Plant Physiol 129:1398-1406. 586
Lavaud J, Rousseau B, Etienne A-L (2004) General features of photoprotection by energy 587
dissipation in planktonic diatoms (Bacillariophyceae). J Phycol 40:130-137. 588
Louchard EM, Reid P, Stephens CF, Davis CO, Leathers RA, Downs TV, Maffione R 589
(2002) Derivative analysis of absorption features in hyperspectral remote sensing data of 590
carbonate sediments. Opt Express 10:1573-1802. 591
MacIntyre HL, Geider RJ, Miller DC (1996) Microphytobenthos: the ecological role of 592
the “Secret Garden” of unvegetated, shallow-water marine habitats. I. Distribution, 593
abundance and primary production. Estuaries 19:186-201. 594
Materna AC, Sturm S, Kroth PG, Lavaud J (2009) First induced plastid genome 595
mutations in an alga with secondary plastids: psbA mutations in the diatom 596
Phaeodactylum tricornutum (Bacillariohyceae) reveal consequences on the regulation of 597
photosynthesis. J Phycol 45:838-846. 598
Mouget J-L, Perkins RG, Consalvey, M, Lefebvre S (2008) Migration or 599
photoacclimation to prevent photoinhibition and UV-B damage in marine 600
microphytobenthic communities. Aquatic Microbial Ecology, 52 : 223-232. 601
Olaizola M, Laroche J, Kolber Z, Falkowski PG (1994) Non-photochemical fluorescence 602
quenching and the diadinoxanthin cycle in a marine diatom. Photosynth Res 41:357-370. 603
Perkins RG, Kromkamp JC, Serôdio J, Lavaud J, Jesus BM, Mouget J-L, Lefebvre S, 604
Forster RM. In Press. The application of variable chlorophyll fluorescence to 605
microphytobenthic biofilms. 606
Perkins RG, Underwood GJC, Brotas V, Snow GC, Jesus B, Ribeiro L (2001) Responses 607
of microphytobenthos to light: primary production and carbohydrate allocation over an 608
emersion period. Mar Ecol Prog Ser 223:101-112. 609
Perkins RG, Oxborough K, Hanlon ARM, Underwood GJC, Baker NR (2002) Can 610
chlorophyll fluorescence be used to estimate the rate of photosynthetic electron transport 611
within microphytobenthic biofilms? Mar Ecol Prog Ser 228:47-56. 612
Perkins R, Mouget J-L, Lefebvre S, Lavaud J (2006) Light response curve methodology 613
and possible implications in the application of chlorophyll fluorescence to benthic 614
diatoms. Mar Biol 149:703-712. 615
Pinckney J, Zingmark R (1991) Effects of tidal stage and sun angles on intertidal benthic 616
microalgal productivity. Mar Ecol Prog Ser 76:81-89. 617
Ruban A, Lavaud J, Rosseau B, Guglielmi G, Etienne A (2004) The super-excess energy 618
dissipation in diatom algae: comparative analysis with higher plants. Photosynth Res 619
82:65-175. 620
Schumann A, Goss R, Jakob T, Wilhelm C (2007) Investigation of the quenching 621
efficiency of diadinoxanthin in cells of Phaeodactylum tricornutum (Bacillariophyceae) 622
with different pool sizes of xanthophyll cycle pigments. Phycologia 46:113-117. 623
Serôdio J, da Silva JM, Catarino F (1997) Non destructive tracing of migratory rhythms 624
of intertidal benthic microalgae using in vivo chlorophyll a fluorescence. J Phycol 625
33:542-553. 626
Serôdio J, Catarino F (1999) Fortnightly light and temperature variability in estuarine 627
intertidal sediments and implications for microphytobenthos primary productivity. Aquat 628
Ecol 33:235-241 629
Serôdio J, Cruz S, Vieira S, Brotas V (2005) Non-photochemical quenching of 630
chlorophyll fluorescence and operation of the xanthophyll cycle in estuarine 631
microphytobenthos. J Exp Mar Biol Ecol 326: 157-169 632
Serôdio J, Vieira S, Cruz S (2008) Photosynthetic activity, photoprotection and 633
photoinhibition in intertidal microphytobenthos as studied in situ using variable 634
chlorophyll fluorescence. Cont Shelf Res 28: 1363-1375 635
Spilmont N, Migne A, Seuront L, Davoult D (2007) Short-term variability of intertidal 636
benthic community production during emersion and the implication in annual budget 637
calculation. Mar Ecol Prog Ser 333:95 – 101 638
Ting CS, Owens TG (1993) Photochemical and non-photochemical fluorescence 639
quenching processes in the diatom Pheodactylum tricornutum. Plant Physiol 101:1323-640
1330. 641
Underwood GJC, Kromkamp J (1999) Primary production by phytoplankton and 642
microphytobenthos in estuaries. Adv Ecol Res 29: 93-153. 643
Underwood GJC, Perkins RG, Consalvey M, Hanlon ARM, Oxborough K, Baker NR, 644
Paterson DM (2005) Patterns in microphytobenthic primary productivity: Species-645
specific variation in migratory rhythms and photosynthetic efficiency in mixed-species 646
biofilms. Limnol Oceanogr 50:755-767. 647
Zar JH (1999) Biostatistical Analysis, 4th edn. Prentice Hall, Upper Saddle River, NJ. 648
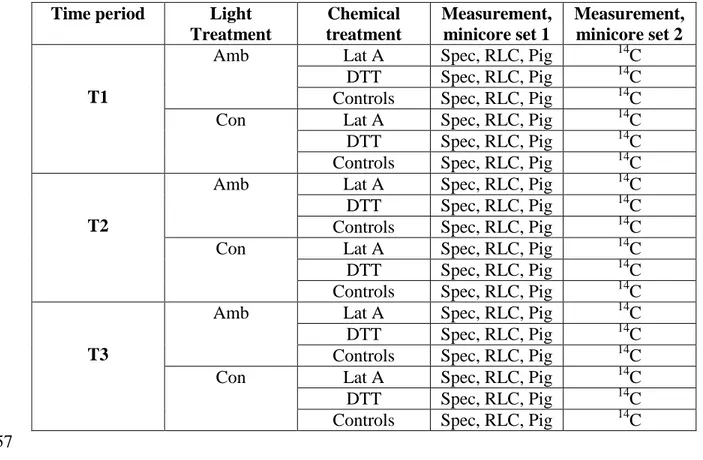
Table 1. Overview of the experimental design showing the nesting of chemical treatments 649
(Lat A = Latrunculin A to inhibit cell motility; DTT = DL-dithiothreitol to inhibit NPQ 650
and controls) within light treatment (Amb = ambient, Con = constant) within time period 651
(T1, 2, and 3) and the measurements made (Spec = spectroradiometry to measure NPQ 652
induction and surface biomass as NDVI, RLC = rapid light curve by fluorescence, Pig = 653
pigments including Chl a, DD and DT, 14C = productivity measured as labelled carbon 654
uptake rate). All measurements were made as triple replicates, i.e. 3 separate minicores. 655
656
Time period Light Treatment Chemical treatment Measurement, minicore set 1 Measurement, minicore set 2 T1
Amb Lat A Spec, RLC, Pig 14C
DTT Spec, RLC, Pig 14C
Controls Spec, RLC, Pig 14C
Con Lat A Spec, RLC, Pig 14C
DTT Spec, RLC, Pig 14C
Controls Spec, RLC, Pig 14C
T2
Amb Lat A Spec, RLC, Pig 14C
DTT Spec, RLC, Pig 14C
Controls Spec, RLC, Pig 14C
Con Lat A Spec, RLC, Pig 14C
DTT Spec, RLC, Pig 14C
Controls Spec, RLC, Pig 14C
T3
Amb Lat A Spec, RLC, Pig 14C
DTT Spec, RLC, Pig 14C
Controls Spec, RLC, Pig 14C
Con Lat A Spec, RLC, Pig 14C
DTT Spec, RLC, Pig 14C
Controls Spec, RLC, Pig 14C
657 658 659 660 661
662 663
Table 2. Accumulated light dose calculated from the product of light measurement and 664
length of exposure at each sampling time (T1, T2 and T3) for the ambient and constant 665
light treatments. Units of light dose are mole of photons m-2. 666
667
Sampling Time
Ambient treatment light dose Constant treatment light dose
T1 1.82 2.16 T2 7.83 5.40 T3 20.00 7.56 668 669 670
Figure legends
671
Figure 1. Biomass represented as the proxy of chlorophyll a (Chl a) for each chemical (D 672
= DTT, L = Lat A, C = control) and light treatment (Amb = ambient, Con = constant) 673
over the three sampling points (T1, T2 and T3). Values are mean s.e. (n = 3). 674
675
Figure 2. Surface biomass represented as the proxy of Normalised Difference Vegetation 676
Index (NDVI) measured using the spectroradiometer. Values are represented as 677
percentage change compared to the initial value at T1 for each chemical (D = DTT, L = 678
Lat A, C = control) and light treatment (Amb = ambient, Con = constant) over the three 679
sampling points (T1, T2 and T3). Values are mean s.e (n = 3). 680
681
Figure 3. Maximum relative electron transport (rETRmax) rate as a proxy for productivity
682
measured using variable chlorophyll fluorescence. Values are represented as percentage 683
change compared to the initial value at T1 for each chemical (D = DTT, L = Lat A, C = 684
control) and light treatment (Amb = ambient, Con = constant) over the three sampling 685
points (T1, T2 and T3). Values are mean s.e (n = 3). 686
687
Figure 4. Light utilisation coefficient (α) measured using variable chlorophyll 688
fluorescence. Values are represented as percentage change compared to the initial value 689
at T1 for each chemical (D = DTT, L = Lat A, C = control) and light treatment (Amb = 690
ambient, Con = constant) over the three sampling points (T1, T2 and T3). Values are 691
mean s.e (n = 3). 692
Figure 5. Productivity measured as the uptake rate of labelled carbon (14C-NaHCO3) for
694
each chemical (D = DTT, L = Lat A, C = control) and light treatment (Amb = ambient, 695
Con = constant) over the three sampling points (T1, T2 and T3). Values are mean s.e (n 696
= 3). 697
698
Figure 6. Maximum relative electron transport rate (rETRmax) presented as a function of
699
productivity (14C uptake rate) for the whole data set. 700
701
Figure 7. Operational fluorescence yield (F) and maximum fluorescence yield (Fm‟)
702
during a 20 second rapid light response curve. Data shown are for a control sample, 703
however the pattern was identical (increase in F and slight decline in Fm‟ followed by a 704
curvilinear increase) for all light curves measured (all three light treatments and at all 705
three sampling points). 706
707
Figure 8. Diatoxanthin Index measured from the spectral second derivatives (508/630 708
nm) for each chemical (D = DTT, L = Lat A, C = control) under the ambient light 709
treatment (Amb = ambient) over the three sampling points (T1, T2 and T3). Values are 710
mean s.e (n = 3). 711
712
Figure 9. Pigment data of A: Diatoxanthin (DT) and the B: Percentage de-epoxidation 713
(%) of Diadinoxanthin for each chemical (D = DTT, L = Lat A, C = control) and light 714
treatment (Amb = ambient, Con = constant) over the three sampling points (T1, T2 and 715
T3). Values are mean s.e (n = 3). 716
717 718
P e rk in s e t a l. F ig u re 1
L ig h t a n d c h e m ic a l tre a tm e n t A m b D A m b L A m b C C o n D C o n L C o n C g C h l a g -1 s e d d w 0 2 0 4 0 6 0 8 0 1 0 0 1 2 0 1 4 0 1 6 0 1 8 0 2 0 0 T 1 T 2 T 3 719 720 721 722 723P e rk in s e t a l. F ig u re 2
L ig h t a n d c h e m ic a l tre a tm e n t A m b D A m b L A m b C C o n D C o n L C o n C % o f in it ia l N D V I 0 2 0 4 0 6 0 8 0 1 0 0 1 2 0 1 4 0 1 6 0 T 1 T 2 T 3 724 725 726 727728
P e rk in s e t a l F ig u re 3
L ig h t a n d c h e m ic a l tre a tm e n t A m b D A m b L A m b C C o n D C o n L C o n C rE T R m a x ( % o f in it ia l v a lu e ) 0 2 0 4 0 6 0 8 0 1 0 0 1 2 0 T 1 T 2 T 3 729 730 731 732 733 734735