HAL Id: hal-01986199
https://hal.archives-ouvertes.fr/hal-01986199
Submitted on 18 Jan 2019HAL is a multi-disciplinary open access archive for the deposit and dissemination of sci-entific research documents, whether they are pub-lished or not. The documents may come from teaching and research institutions in France or abroad, or from public or private research centers.
L’archive ouverte pluridisciplinaire HAL, est destinée au dépôt et à la diffusion de documents scientifiques de niveau recherche, publiés ou non, émanant des établissements d’enseignement et de recherche français ou étrangers, des laboratoires publics ou privés.
Stochasticity of Pores Interconnectivity in Li-O2
Batteries and its Impact on the Variations in
Electrochemical Performance
Amangeldi Torayev, Alexis Rucci, Pieter Magusin, Arnaud Demortière,
Vincent de Andrade, Clare Grey, Céline Merlet, Alejandro Franco
To cite this version:
Amangeldi Torayev, Alexis Rucci, Pieter Magusin, Arnaud Demortière, Vincent de Andrade, et al.. Stochasticity of Pores Interconnectivity in Li-O2 Batteries and its Impact on the Variations in Elec-trochemical Performance. Journal of Physical Chemistry Letters, American Chemical Society, 2018, 9 (4), pp.791-797. �10.1021/acs.jpclett.7b03315�. �hal-01986199�
Stochasticity of pores interconnectivity in Li-O
2
batteries and its impact on the variations in
electrochemical performance
Amangeldi Torayev 1,2,3, Alexis Rucci 1,4, Pieter C. M. M. Magusin 2,3, Arnaud Demortière 1,2,4,
Vincent De Andrade 5, Clare P. Grey 2,3, Céline Merlet 3,4,6, Alejandro A. Franco 1,2,4,7,*
1 Laboratoire de Réactivité et Chimie des Solides (LRCS), CNRS UMR 7314, Université de
Picardie Jules Verne, HUB de l’Energie, Rue Baudelocque, 80039 Amiens, France
2 ALISTORE-European Research Institute, Fédération de Recherche CNRS 3104, HUB de
l’Energie, Rue Baudelocque, 80039 Amiens, France
3 Department of Chemistry, University of Cambridge, Lensfield Road, Cambridge CB2 1EW,
United Kingdom
4 Réseau sur le Stockage Electrochimique de l'Energie (RS2E), Fédération de Recherche CNRS
3459, HUB de l’Energie, Rue Baudelocque, 80039 Amiens, France
5 X-Ray Science Division, Advanced Photon Source, Argonne National Laboratory, Lemont,
6 CIRIMAT, Université de Toulouse, CNRS, INPT, UPS, Université Toulouse 3 Paul Sabatier,
Bât. CIRIMAT, 118, route de Narbonne 31062 Toulouse cedex 9, France.
7 Institut Universitaire de France, 103 Boulevard Saint-Michel, 75005 Paris, France
AUTHOR INFORMATION
Corresponding Author
* alejandro.franco@u-picardie.fr
ABSTRACT. While large dispersions in electrochemical performance have been reported for lithium oxygen batteries in the literature, they have not been investigated in any depth. The variability in the results is often assumed to arise from differences in cell design, electrode structure, handling and cell preparation at different times. An accurate theoretical framework turns out to be needed to get a better insight into the mechanisms underneath and to interpreting experimental results. Here, we develop and use a pore network model to simulate the electrochemical performance of three-dimensionally resolved lithium-oxygen cathode mesostructures obtained from TXM nano-computed tomography. We apply this model to the 3D reconstructed object of a Super P carbon electrode and calculate discharge curves, using identical conditions, for four different zones in the electrode and their reversed configurations. The resulting galvanostatic discharge curves show some dispersion, (both in terms of capacity and overpotential) which we attribute to the way pores are connected with each other. Based on these results, we propose that the stochastic nature of pores interconnectivity and the microscopic
arrangement of pores can lead, at least partially, to the variations in electrochemical results observed experimentally.
TOC GRAPHICS
KEYWORDS. Li-O2 Battery, Pore interconnectivity, Stochasticity, Pore Network Model,
Tomography, Reproducibility.
Since Abraham and Jiang demonstrated the first proof of concept of an aprotic Li-O2 battery,
there has been a significant interest due to its superior theoretical capacity (5.2 kWh.kg-1) compared to state of the art Li-ion batteries.1,2 In the last two decades numerous aspects of Li-O2
batteries have been investigated. Research efforts have demonstrated how the positive electrode mesostructure affects the cell capacity,3–6 the influence of the electrolyte stability and its contribution to the cell performance,7,8 and the use of mediators to favor formation of large
discharge particles.9–11 There has been a wide range of capacities reported in the literature, going from a few hundreds of mAh.g-1 4,12 to 29,375 mAh.g-1 for catalyzed porous graphene
nanostructures13, and 37,523 mAh.g-1 for carbon electrodes with tailored architectures.14 These works use different types of carbons and operating conditions. However, even if only a single parameter is altered, the results can differ significantly. Meini et al. reported that the discharge capacities of Ketjenblack EC600JD and Black Pearls 200 increase from around 438 mAh.g-1 and 517 mAh.g-1 to 1833 mAh.g-1 and 2168 mAh.g-1, respectively, when simply replacing the diethylene glycol dimethyl ether solvent by the tetraethylene glycol dimethyl ether solvent.4 As shown by Read, simply using different pressing methods during electrode preparation can affect the discharge capacity significantly.15 In his work, a Super P based electrode with PTFE binder is prepared by hot and cold pressing methods and the discharge capacity obtained for the hot pressing approach is 1347 mAh.g-1 while a capacity of 2120 mAh.g-1 is achieved for the cold pressed one. All these studies have shown that Li-O2 batteries are extremely sensitive to
operating conditions and cell components.
The sensitive nature of Li-O2 batteries leads to a non-negligible dispersion of experimental
results. Griffith et al. reported reproducibility tests for 60 cells at 5 different current densities via well controlled experimental procedures, yet still a large variation of discharge capacities was observed.16 The dispersion of results is observed in experiments but insufficient attention is paid to the origin of this phenomenon. It is often assumed to result from the uncertainty in the material quantities (e.g., mass loading, electrolyte amount), handling issues or variations from one experiment to another.
On the modelling side, the common approach to study Li-O2 batteries is to use continuum
models and to capture the effects of pore interconnectivity via a tortuosity factor. The tortuosity is usually described via the Bruggeman relationship that oversimplifies the role of pore sizes and connectivity on transport.17–19 Recently, Mehta et al. showed, for the first time, that the local
variation of porosity and carbon surface area (CSA) in the cathode can lead to variations in performance as well.20 In their model, the positive electrode is discretized into fine meshes, and
each mesh is assigned slightly different porosity and CSA values. The porosity and CSA values are chosen based on the overall properties and standard deviations at the macroscopic level. However, the model uses a mean field approach and does not explicitly consider interconnectivity of pores, or pore size distribution (PSD). As such the importance of transport and changes in the mesostructure during the cell operation can be overlooked.
To investigate the effect of pore interconnectivity on the electrochemical performances of carbon electrodes, we developed a pore network model (PNM), which enables us to calculate transport properties and simulate electrochemical reactions in three dimensional (3D) porous structures. A 3D structure of Super P type carbon is obtained from TXM (Transmission X-ray Microscopy) nano-computed tomography with phase contrast imaging using synchrotron X-ray source (APS-ANL). The 3D reconstructed structure allows us to generate porous structures with realistic porosities and pore interconnectivities. Using this model and porous structures, we show that, without altering the mesh porosity or the CSA, mesoscopic differences in the porous cathodes,
namely the pores interconnectivity and the dynamics of pore clogging upon cell discharge, can
Figure 1. Workflow of our modeling approach.
The calculation of model discharge curves is made here following several steps as shown in Figure 1. The initial step is experimental and consists in preparing a porous carbon electrode made of Super P carbon. Prior to the thresholding treatment (using FIJI and AMIRA) to make the segmentation and convert the image stack into a binary file, the tomogram (3000 projections) was properly reconstructed using Tomopy Python script.21
Then, the void (pore) space in the tomography data is mapped to spherical and cylindrical pores using the maximal ball approach22 and a 3D pore network is extracted. We then simulate a Li-O
2
For the pore network extraction, an open source code developed by Dong et al. is utilized and adapted to the current system.23 To extract the pore network, a pore is assigned to each void
voxel of the tomography data and expanded till a carbon site is reached. After that an iterative process is carried out to identify the clusters of overlapping pores which are also called pore
families, connected by bottlenecks (see supplementary information for details).
After identifying pore families (two are shown in Figure 2a), only two parameters need to be defined: an effective pore radius for each pore family and the length of the throats which connect these effective pores. To assign these parameters we use a different approach from the one reported by Dong et al.23 They use a parameter called the pore-throat segmentation coefficient
(𝛼) to determine the effective pore radius and throat length. To calculate the radii of the effective pores, the distances between the center of the parent pores and the bottleneck pore (𝑙𝑖𝑡 and 𝑙𝑗𝑡) are calculated (Figure 2b) and the radii of the effective pores are given by:
𝑙𝑖 = 𝑙𝑖𝑡(1 − 𝛼𝑟𝑡 𝑟𝑖) (1) 𝑙𝑗 = 𝑙𝑗𝑡(1 − 𝛼 𝑟𝑡 𝑟𝑗 ) (2) 𝑙𝑡= 𝑙𝑖𝑗− 𝑙𝑖 − 𝑙𝑗 (3)
where 𝑙𝑖, 𝑙𝑗, 𝑙𝑡 are radii of the effective pore for pore family 𝑖, 𝑗 and the length of the throat, (Figure 2d), 𝑟𝑡 is the radius of the throat; 𝑟𝑖is the radius of the parent pore for pore family 𝑖; 𝑙𝑖𝑗
is the distance between centers of parent pores 𝑖 and 𝑗. This method has two caveats; first, it uses a fitting parameter 𝛼 and second, it can assign more than one effective radius for a pore family depending on the number of throats it has. We amended this method to assign the effective pore
radius (𝑙𝑖) so that the volume of the effective pore is equal to the total volume of the pore family
(Figure 2c). A 3D pore network is then obtained (Figure 2e).
Figure 2. (a)-(d) Schematic illustrations of the pore network extraction. (a) Two pore families connected via a bottleneck. (b) Dong et al. approach to define effective pore radii and throat
lengths.23 (c) Approach used in this work to assign effective pore radii (d) Effective pores and
throat obtained after assigning effective pore radiuses and throat lengths either by approaches (b) or (c). (e) Final pore network obtained using the pore network extraction. (f) Illustration of the two mechanisms considered for Li2O2 (in black) growth in our model: particle and thin film
formation.
The resolution of X-ray tomography (20 nm voxel size in this work) cannot capture nanopores, and the capacity contribution from those pores is neglected here. We note that experiments on activated carbons, for which the high surface area largely originates from nanopores, do not report high capacities.5,24 This is presumably because these pores are readily blocked. However,
this issue with acquiring the 3D structure through experiments can be bypassed via in-silico structure generation, and does not restrict the capability of our model.
The transport equations for the PNM are adapted from the polymer electrolyte membrane fuel cell work of Fazeli et al.25 The evolution of the concentration in each pore is calculated by solving the balance equation 4, written in terms of the fluxes between neighboring pores
𝑑𝑐𝑖,𝑥
𝑑𝑡 = ∑ 𝑘𝑖𝑗,𝑥(𝑐𝑗,𝑥− 𝑐𝑖,𝑥)
𝑛𝑒𝑖𝑔ℎ𝑏𝑜𝑢𝑟𝑠
𝑗
+ 𝑠𝑖,𝑥 (4)
where 𝑐𝑖,𝑥 is the concentration of mobile species 𝑥 (Li+ or O
2) in the pore 𝑖 and 𝑐𝑗,𝑥 is the
concentration in the pores connected to 𝑖. 𝑘𝑖𝑗,𝑥 is the transfer parameter between pores 𝑖 and 𝑗, and 𝑠𝑖,𝑥 is the sink term for species 𝑥 which is calculated by the electrochemical reactions taking place in pore 𝑖. 𝑘𝑖𝑗,𝑥 is a function of the bulk diffusion coefficient of 𝑥 (𝐷0,𝑥), the distance
between the centers of pores 𝑖 and 𝑗, and the cross-sectional areas of pores 𝑖, 𝑗 and the connecting throat, which are 𝐴𝑖, 𝐴𝑗 and 𝐴𝑡 respectively, and can be formulated as
𝑘𝑖𝑗,𝑥 = ( 1 𝑘𝑖,𝑥+ 1 𝑘𝑗,𝑥+ 1 𝑘𝑡,𝑥) −1 (5) 𝑘𝑖,𝑥 = 𝐴𝑖𝐷0,𝑥 𝑙𝑖 (6.a) 𝑘𝑗,𝑥 = 𝐴𝑗𝐷0,𝑥 𝑙𝑗 (6.b) 𝑘𝑡,𝑥 = 𝐴𝑡𝐷0,𝑥 𝑙𝑡 (6.c)
The cross-sectional areas are calculated by:
𝐴𝑖 = 𝜋 [(𝑙𝑖− 𝑡𝑓,𝑖)2− 𝑡𝑝,𝑖2] (7.a) 𝐴𝑗 = 𝜋 [(𝑙𝑗− 𝑡𝑓,𝑗)2− 𝑡𝑝,𝑗2] (7.b)
𝐴𝑡 = 𝜋 [(𝑟𝑡− 𝑡𝑓,𝑡) 2
− 𝑡𝑝,𝑡2] (7.c)
𝑡𝑓,𝑖 and 𝑡𝑝,𝑖 are the thickness of the Li2O2 thin film and the radius of the Li2O2 particle formed in
the pores considered (Figure 2f). The transport coefficients calculated here neglect the electromigration. This assumption seems reasonable as the discharge capacity is mainly limited by the O2 (neutral) transport.
The electrochemical discharge reaction generally does not happen in a single step but can involve several intermediate steps such as the formation of superoxides (LiO2)26,27 In this work,
for simplicity reasons, an overall reaction is considered
2𝐿𝑖++ 𝑂
2+ 2𝑒− → 𝐿𝑖2𝑂2 (8)
𝑣 = 𝑘𝑓𝑎𝑓𝑒𝑥𝑝 (
−𝛽𝑛𝐹(𝑈 − 𝑈0)
𝑅𝑇 ) − 𝑘𝑏𝑎𝑏𝑒𝑥𝑝 (
(1 − 𝛽)𝑛𝐹(𝑈 − 𝑈0)
𝑅𝑇 ) (9)
where 𝑘𝑓, 𝑘𝑏 are the forward and backward reaction rate constants; 𝑎𝑓 and 𝑎𝑏 are the activities of
𝐿𝑖+, 𝑂2 and 𝐿𝑖2𝑂2 respectively; 𝛽 is the charge transfer coefficient, 𝑛 is the number of electrons
involved in the electrochemical reaction, 𝑈 is the electrostatic potential of the electrode and 𝑈0 is the standard potential of the reaction; 𝑅 is the universal gas constant, 𝑇 is the temperature and 𝐹 is Faraday’s constant. The cell potential 𝑈 is calculated by equating the sum of all currents from all the pores in the network to the input current density or discharge current (𝐼𝑡𝑜𝑡)
𝐼𝑡𝑜𝑡= ∑ 𝑆𝐴𝑖𝐹𝑣
𝐴𝑙𝑙𝑝𝑜𝑟𝑒𝑠
𝑖=1
(10)
where 𝑆𝐴𝑖 is the surface area of pore 𝑖, which can be either a spherical or a cylindrical pore with the surface area being considered accordingly.
The discharge products can follow two types of pathways: the formation of large particles and the deposition of a thin film. Experimentally, the Li2O2 formation path depends on several
parameters, such as the electrolyte used,28 the current density29 and the presence of impurities
(e.g. the H2O content in the electrolyte enhancing the LiO2 solubility).30 In our model, both the
formation of large particles and the deposition of a thin film are considered using the escape function concept reported in our previous work.31 The escape function is the probability of LiO
2
to escape or dissolve in the electrolyte once it is formed close to the carbon surface. The dissolved LiO2 is assumed to follow a solution phase mechanism leading to the formation of
large Li2O2 particles, whereas the LiO2 molecules adsorbed on the carbon surface lead to thin
film formation. The discharge reaction, including the escape function (χ), can be represented by equations 11.a to 11.d, and the amounts of 𝐿𝑖 𝑂 particles and thin films (equation 11.e) can be
calculated by combining these equations. The escape function values used in this work are given in the supplementary information.
𝐿𝑖++ 𝑂2+ 𝑒− → 𝐿𝑖𝑂2 (11.a) 𝐿𝑖𝑂2 → 𝜒 𝐿𝑖𝑂2,𝑑𝑖𝑠+ (1 − 𝜒) 𝐿𝑖𝑂2,𝑎𝑑𝑠 (11.b) 𝜒 𝐿𝑖𝑂2,𝑑𝑖𝑠→ 𝜒 2 𝐿𝑖2𝑂2,𝑝𝑎𝑟𝑡𝑖𝑐𝑙𝑒+ 𝜒 2𝑂2 (11.c) (1 − 𝜒)𝐿𝑖𝑂2,𝑎𝑑𝑠+ (1 − 𝜒)𝐿𝑖++ (1 − 𝜒)𝑒− → (1 − 𝜒)𝐿𝑖 2𝑂2,𝑓𝑖𝑙𝑚 (11.d) 2𝐿𝑖++ 𝑂2 + 2𝑒− → 2 − 2𝜒 2 − 𝜒 𝐿𝑖2𝑂2,𝑓𝑖𝑙𝑚+ 𝜒 2 − 𝜒𝐿𝑖2𝑂2,𝑝𝑎𝑟𝑡𝑖𝑐𝑙𝑒 (11.e)
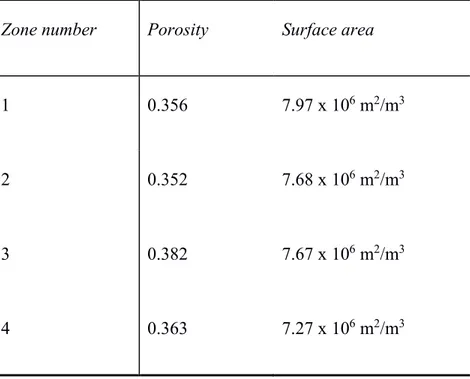
To investigate the effect of mesostructural differences on the dispersion in electrochemical results and analyze it further, we select four random zones from a single tomography image acquired for a Super P carbon electrode (Figure 3a) and apply our model to these distinct regions. The active surface areas and porosity values are very close to each other (Table 1). There is only a difference of about 7% for the porosity and 8% for the CSA. The PSDs are also superimposed (Figure 3b).
While the four selected regions have similar CSAs, porosities and PSDs, the discharge curves of these four slices show a significant dispersion of capacities for the three current densities explored (Figure 3c). The relative differences between the discharge capacities are 29% for 400 mA.g-1, 23% for 100 mA.g-1 and 16% for 20 mA.g-1. These variations in capacities are much
larger than the ones for porosity and CSA. To make sure these differences are not due to slight differences in porosities and CSAs, the four electrodes are flipped; the air inlet and separator sides of the cathode are exchanged. In this case the macroscopic properties are identical. Yet, the
discharge profiles again show variations (Figure 3d). The main reasons of these large dispersions are inherent to the stochastic nature of the pores interconnectivity and the dynamic change of the porous mesostructure.
Table 1. Porosities and specific surface areas for the four zones.
Zone number Porosity Surface area
1 0.356 7.97 x 10⁶ m2/m3
2 0.352 7.68 x 10⁶ m2/m3
3 0.382 7.67 x 10⁶ m2/m3
Figure 3. (a) Illustration of the 4 zones taken from the tomography data. (b) PSDs corresponding to the four slices. (c) Calculated discharge curves for the four slices at three different applied current densities. (d) Calculated discharge curves for the flipped electrodes (A: separator side, B: air inlet side).
For the four selected zones, while the macroscopic properties are similar, the mesoscopic arrangement of pores is not identical and in particular the pores are not connected in the same fashion. In Li-O2 batteries, the transport of O2 and Li+ in the electrolyte crucially determines the
cell capacity, and it is expected that the differences in interconnectivity and pore arrangements will generate a significant dispersion. Besides, unlike in Li-ion batteries, discharge products of Li-O2 batteries are solid particles that fill up the porous volume. As such, the porous structure
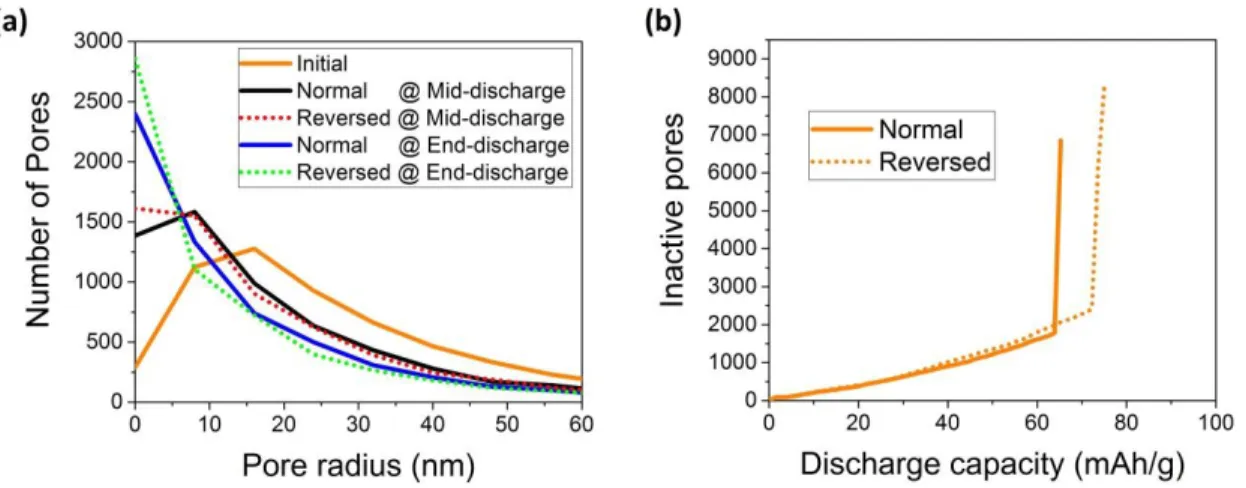
dramatically evolves along the discharge. This is illustrated in Figure 4 which shows the evolution of the pore size distribution along the discharge for zone 2 and the number of inactive pores as a function of time for the same zone in normal and reversed configurations. Once a pore gets clogged, it does not only affect itself but also its neighboring pores. This blocks the transport of O2 and Li+ to the connected pores through this clogged pore. This can impede long range
transport and also form isolated regions in the pore network which do not contribute to the cell capacity.
Figure 4. (a) Calculated evolution of PSDs and (b) calculated number of inactive pores along discharge for Zone 2 at 100 mA.g-1, in normal and reversed configurations. Pores are considered
inactive if they are i) clogged, ii) passivated by the Li2O2 deposit or iii) depleted in O2 (see SI for
a detailed description of the criteria).
Figure 5 shows snapshots of the oxygen concentration at two different depths of discharge for two structures. For the snapshots corresponding to point (a), there are no significant differences of oxygen concentrations in the electrode volume. Yet, for both zones, there are some pores and clusters of pores that are depleted from oxygen, (represented in blue in Figure 5). These pore
to the cell capacity once they become isolated. This long range effect explains why pore size distribution evolution is insufficient to explain the discharge capacities observed. Instead, we have to consider all the possible reasons of pore inactivity as given in Figure S3. This is a clear added-value of this model compared to continuum and mean-field computational approaches. This type of features cannot be captured without an explicit description of pores interconnectivity.17–19 For the color maps of the two zones at point (b), the concentration profiles
are very different. This is because along the discharge the porous network evolves due to formation of Li2O2 discharge products and several pores get clogged. For zone 2, there is lack of
O2 transport and a huge gradient of concentration is observed. At this point, the transport of O2
Figure 5. Calculated oxygen concentration color maps at two different depths of discharge, (a) 55 mAh.g-1 and (b) 97 mAh.g-1, for two zones at 20 mA.g-1 discharge current density. Throats
In conclusion, we have developed a new model to calculate discharge curves for Li-O2 batteries
directly comparable with experiments. The model uses tomography images as an input which allows us to generate a realistic 3D porous structure for which we can simulate the electrochemical performances. To the best of our knowledge, neither the pore network extraction approach nor the PNM have been used so far in the context of Li-O2 batteries and batteries in
general. Part of the work reported here was focused on adapting these two approaches, already used in other fields, to the case of batteries. With this model, we clearly demonstrate that extra insights can be gained by introducing a 3D representation of porous structures and an explicit description of the pores interconnectivity in modeling works. In particular, we show that the inherent stochastic nature of pore interconnectivity and the mesostructural differences contribute to the dispersion of results observed in experiments. Based on these results, we believe that the variations in the measured capacities/voltages should be reported when presenting experimental discharge curves. This is critically needed to allow comparison of data. Our newly developed model is a useful tool to compare performances of different electrode structures and suggests that structures with less bottlenecks and high porosity will give better electrochemical performance.
ASSOCIATED CONTENT
Supporting Information. A table of symbols and their descriptions, a table of parameters and their values, a description of the home-made python script used to convert gray scale tomography images to binary format files, details about the electrode preparation, the tomographic imaging, the procedure followed for electrochemical tests and additional details about the PNM model are provided along with detailed description and plot of inactive pores and
gradient of discharge products along electrode thickness. Supporting information also includes two .avi videos showing the calculated oxygen concentration color map along the discharge for normal and reversed electrodes (details provided in the Supporting Information text) and values of the escape function.
AUTHOR INFORMATION
The authors declare no competing financial interests.
ACKNOWLEDGMENT
Authors thank Yinghui Yin, PhD student at LRCS Amiens, for preparing the electrode for the tomography imaging. Authors also thank Abbos Shodiev, who was a summer intern student at LRCS Amiens, for discussions on adapting PNM to Li-O2 batteries. Authors thank the
ALISTORE ERI for A.T.’s PhD funding. A.A.F. acknowledges the Institut Universitaire de France for funding support. C.M. acknowledges the School of the Physical Sciences of the University of Cambridge for funding through an Oppenheimer Research Fellowship. The authors acknowledge the European Union’s Horizon 2020 research and innovation programmes for the partial funding support through the POROUS4APP project (grant agreement 686163) and through the European Research Council (ERC) (grant agreement No 714581). This research used resources of the Advanced Photon Source, a U.S. Department of Energy (DOE) Office of Science User Facility operated for the DOE Office of Science by Argonne National Laboratory under Contract No. DE-AC02-06CH11357.
REFERENCES
R.; Ahmed, J.; Kojic, A. A Critical Review of Li∕Air Batteries. J. Electrochem. Soc. 2012,
159 (2), R1.
(2) Abraham, K. M. A Polymer Electrolyte-Based Rechargeable Lithium/Oxygen Battery. J.
Electrochem. Soc. 1996, 143 (1), 1.
(3) Franco, A. A.; Xue, K. H. Carbon-Based Electrodes for Lithium Air Batteries: Scientific and Technological Challenges from a Modeling Perspective. ECS J. Solid State Sci.
Technol. 2013, 2 (10), M3084–M3100.
(4) Meini, S.; Piana, M.; Beyer, H.; Schwammlein, J.; Gasteiger, H. A. Effect of Carbon Surface Area on First Discharge Capacity of Li-O2 Cathodes and Cycle-Life Behavior in Ether-Based Electrolytes. J. Electrochem. Soc. 2012, 159 (12), A2135–A2142.
(5) Ding, N.; Chien, S. W.; Hor, T. S. A.; Lum, R.; Zong, Y.; Liu, Z. L. Influence of Carbon Pore Size on the Discharge Capacity of Li-O2 Batteries. J. Mater. Chem. A 2014, 2 (31), 12433–12441.
(6) Xue, K.-H.; Nguyen, T.-K.; Franco, A. A. Impact of the Cathode Microstructure on the Discharge Performance of Lithium Air Batteries: A Multiscale Model. J. Electrochem.
Soc. 2014, 161 (8), E3028–E3035.
(7) Kuboki, T.; Okuyama, T.; Ohsaki, T.; Takami, N. Lithium-Air Batteries Using Hydrophobic Room Temperature Ionic Liquid Electrolyte. J. Power Sources 2005, 146 (1–2), 766–769.
(8) Balaish, M.; Kraytsberg, A.; Ein-Eli, Y. A Critical Review on Lithium-Air Battery Electrolytes. Phys. Chem. Chem. Phys. 2014, 16 (7), 2801–2822.
(9) Bergner, B. J.; Schürmann, A.; Peppler, K.; Garsuch, A.; Janek, J. TEMPO: A Mobile Catalyst for Rechargeable Li-O2 Batteries. J. Am. Chem. Soc. 2014, 136 (42), 15054–
15064.
(10) Nasybulin, E.; Xu, W.; Engelhard, M. H.; Li, X. S.; Gu, M.; Hu, D.; Zhang, J. G. Electrocatalytic Properties of Poly(3,4-Ethylenedioxythiophene) (PEDOT) in Li-O2 Battery. Electrochem. commun. 2013, 29, 63–66.
(11) Chen, Y.; Freunberger, S. A.; Peng, Z.; Fontaine, O.; Bruce, P. G. Charging a Li–O2 Battery Using a Redox Mediator. Nat. Chem. 2013, 5 (6), 489–494.
(12) Wen, Z.; Shen, C.; Lu, Y. Air Electrode for the Lithium-Air Batteries: Materials and Structure Designs. Chempluschem 2015, 80 (2), 270–287.
(13) Sun, B.; Huang, X.; Chen, S.; Munroe, P.; Wang, G. Porous Graphene Nanoarchitectures: An Efficient Catalyst for Low Charge-Overpotential, Long Life, and High Capacity Lithium-Oxygen Batteries. Nano Lett. 2014, 14 (6), 3145–3152.
(14) Yang, W.; Qian, Z.; Du, C.; Hua, C.; Zuo, P.; Cheng, X.; Ma, Y.; Yin, G. Hierarchical Ordered Macroporous/Ultrathin Mesoporous Carbon Architecture: A Promising Cathode Scaffold with Excellent Rate Performance for Rechargeable Li-O2 Batteries. Carbon N. Y. 2017, 118, 139–147.
(15) Read, J. Characterization of the Lithium/Oxygen Organic Electrolyte Battery. J.
Electrochem. Soc. 2002, 149 (9), A1190–A1195.
(16) Griffith, L. D.; Sleightholme, A. E. S.; Mansfield, J. F.; Siegel, D. J.; Monroe, C. W. Correlating Li/O2 Cell Capacity and Product Morphology with Discharge Current. ACS
Appl. Mater. Interfaces 2015, 7 (14), 7670–7678.
(17) Ren, Y. X.; Zhao, T. S.; Tan, P.; Wei, Z. H.; Zhou, X. L. Modeling of an Aprotic Li-O2 Battery Incorporating Multiple-Step Reactions. Appl. Energy 2017, 187, 706–716.
Cycling Behaviour of a Lithium–air Battery. J. Power Sources 2013, 227, 243–253. (19) Yin, Y.; Gaya, C.; Torayev, A.; Thangavel, V.; Franco, A. A. Impact of Li2O2 Particle
Size on Li–O2 Battery Charge Process: Insights from a Multiscale Modeling Perspective.
J. Phys. Chem. Lett. 2016, 7 (19), 3897–3902.
(20) Mehta, M.; Zhu, C.; Andrei, P. Statistical Analysis of Li-Oxygen Batteries. ECS Trans. 2017, 75 (22), 35–45.
(21) Silin, D.; Patzek, T. Pore Space Morphology Analysis Using Maximal Inscribed Spheres.
Phys. A Stat. Mech. its Appl. 2006, 371 (2), 336–360.
(22) Silin, D. B.; Jin, G. D.; Patzek, T. W. Robust Determination of the Pore-Space Morphology in Sedimentary Rocks. J. Pet. Geol. 2004, 56 (5), 69–70.
(23) Dong, H.; Blunt, M. J. Pore-Network Extraction from Micro-Computerized-Tomography Images. Phys. Rev. E - Stat. Nonlinear, Soft Matter Phys. 2009, 80 (3), 1–11.
(24) Yang, X. hui; He, P.; Xia, Y. yao. Preparation of Mesocellular Carbon Foam and Its Application for Lithium/Oxygen Battery. Electrochem. commun. 2009, 11 (6), 1127– 1130.
(25) Fazeli, M.; Hinebaugh, J.; Bazylak, A. Incorporating Embedded Microporous Layers into Topologically Equivalent Pore Network Models for Oxygen Diffusivity Calculations in Polymer Electrolyte Membrane Fuel Cell Gas Diffusion Layers. Electrochim. Acta 2016,
216, 364–375.
(26) Yin, Y.; Torayev, A.; Gaya, C.; Mammeri, Y.; Franco, A. A. Linking the Performances of Li-O2Batteries to Discharge Rate and Electrode and Electrolyte Properties through the Nucleation Mechanism of Li2O2. J. Phys. Chem. C 2017, 121 (36), 19577–19585.
Oxygen Reduction in Aprotic Li-Air Batteries: The Role of Carbon Electrode Surface Structure. J. Phys. Chem. C 2017, 121 (3), 1569–1577.
(28) Johnson, L.; Li, C.; Liu, Z.; Chen, Y.; Freunberger, S. A.; Ashok, P. C.; Praveen, B. B.; Dholakia, K.; Tarascon, J.-M.; Bruce, P. G. The Role of LiO2 Solubility in O2 Reduction in Aprotic Solvents and Its Consequences for Li–O2 Batteries. Nat. Chem. 2014, 6 (12), 1091–1099.
(29) Adams, B. D.; Radtke, C.; Black, R.; Trudeau, M. L.; Zaghib, K.; Nazar, L. F. Current Density Dependence of Peroxide Formation in the Li-O2 Battery and Its Effect on Charge.
Energy Environ. Sci. 2013, 6 (6), 1772–1778.
(30) Aetukuri, N. B.; McCloskey, B. D.; Garciá, J. M.; Krupp, L. E.; Viswanathan, V.; Luntz, A. C. Solvating Additives Drive Solution-Mediated Electrochemistry and Enhance Toroid Growth in Non-Aqueous Li-O2batteries. Nat. Chem. 2015, 7 (1), 50–56.
(31) Xue, K.-H.; McTurk, E.; Johnson, L.; Bruce, P. G.; Franco, A. A. A Comprehensive Model for Non-Aqueous Lithium Air Batteries Involving Different Reaction Mechanisms.