ÉCOLE DE TECHNOLOGIE SUPERIEURE UNIVERSITE DU QUEBEC
THESIS PRESENTED TO
ÉCOLE DE TECHNOLOGIE SUPÉRIEURE
IN PARTIAL FULFILLEMENT OF THE REQUIREMENTS FOR A MASTER’S DEGREE IN CONSTRUCTION ENGINEERING
M.Eng.
BY
Masoud ROBATI
EVALUATION OF A MODIFICATION OF CURRENT MICRO-SURFACING MIX DESIGN PROCEDURES
MONTREAL, January 4, 2012
This Creative Commons licence allows readers to dowload this work and share it with others as long as the author is credited. The content of this work can’t be modified in any way or used commercially.
BOARD OF EXAMINERS THIS THESIS HAS BEEN EVALUATED BY THE FOLLOWING BOARD OF EXAMINERS
Mr. Alan Carter, Thesis Supervisor
Department of Construction Engineering at École de technologie supérieure
Mr. Li Li, President of the Board of Examiners
Department of Construction Engineering at École de technologie supérieure
Mr. Michel Paradis, Member of the jury Transports Quebec
THIS THESIS WAS PRENSENTED AND DEFENDED
IN THE PRESENCE OF A BOARD OF EXAMINERS AND PUBLIC December 14, 2011
First and foremost my deepest gratitude goes to my father, Mohammad Jafar Robati, for his unflagging love, care, and support throughout my life. This dissertation is simply impossible without him. As a typical father in an Iranian family, he worked on different Road Construction projects across Iran to support me, and spare no effort to provide the best possible environment for me to attend the university in Canada. He had never complained in spite of all the hardships in his life. Although he is no longer with me, he is forever remembered. I am sure he shares our joy and happiness in the heaven. Father, this thesis is dedicated to you.
It is a pleasure to thank my Master supervisor, Dr. Alan Carter, who has supported me throughout my thesis-writing period with his encouragement, friendship, sound advice, good teaching, and lots of good ideas. Dr. Alan Carter provided technical and editorial advice that was essential to the completion of this thesis and gave me insights on the workings of academic research in general. I would have been lost without him.
I also would like to thank many people for helping me. During the laboratory work, I have been aided in running the equipment by Alain Desjardins, Francis Bilodeau, and John Lescelleur, very fine technician at Asphalt Laboratory of École de Technologie Supérieure. Finally, I appreciate the financial support from McAsphalt Industries Limited that funded parts of the research discussed in this thesis.
EVALUATION OF A MODIFICATION OF CURRENT MICRO-SURFACING MIX DESIGN PROCEDURES
Masoud ROBATI
RÉSUME
Cette etude porte sur la modification des procedures de formulation de la International Slurry Surfacing Association (ISSA) pour les traitements de surface. Les procédures actuelles de formulation de traitement de surface ont été évaluées en détails. La première partie de ce travail démontre l’effet de la quantité d’émulsion, d’eau d’apport et de l’utilisation d’additifs (ciment) sur les paramètres de formulation des traitements de surface. La deuxième partie consiste principalement en l’établissement d’une méthode de formulation optimale selon quatre essais de l’ISSA, soit le TB 139, le TB 113, le TB 100 et le TB 109. Les résultats ont montrés que le TB 139 peut être utilisé pour trouver la teneur en eau optimale et que l’essai ISSA TB 147 devrait être utilisé pour trouver la teneur en émulsion optimale.
Mots clés : Entretien des chaussées, méthode de formulation, émulsion de bitume, traitement de surface
EVALUATION OF A MODIFICATION OF CURRENT MICRO-SURFACING MIX DESIGN PROCEDURES
Masoud ROBATI ABSTRACT
Although Micro-surfacing is widely used, current tests and mix design methods mostly rely on laboratory condition and the correlation between laboratory results and field performance is poor. Therefore, there is a need to develop new mix design procedures, specifications, and guidelines for Micro-surfacing. The research described in this thesis intended to review the current mix design procedures for Slurry Seal and Micro-surfacing and suggest modifications to the actual International Slurry Seal Association (ISSA) mix design procedure for micro-surfacing as a high performance surface treatment and pavement preservation method. The first part of study reports the findings of a detailed laboratory investigation concerning the effect of asphalt emulsion, added water content, and the use of additives (Portland cement) on the design parameters and properties of micro-surfacing mixtures. For this, one aggregate type, one asphalt emulsion type/grade, and one aggregate gradation were used in the study. The evaluation was conducted at one curing stages of the mix (24-Hours). Three levels of asphalt emulsion, four levels of added water content, and one level of Portland cement were used in order to evaluate role of asphalt emulsion, water, and cement. This part of study consisted mainly of establishing a method for preparing and testing micro-surfacing mixture using four main mixture design tests proposed by the ISSA (TB 139, TB 113, TB 100, and TB 109). The results obtained with ISSA TB 109 and ISSA TB 100 mixture design tests were found highly variable and not precise enough to suggest optimum mix design. For the second part of this study, different tests were also studied in order to refine the current mix design procedure. The results have shown that ISSA TB 139 can be used to define the optimum water content at which samples should be tested, and that ISSA TB 147 mix design test should be used to define the optimum asphalt emulsion content.
TABLE OF CONTENTS
Page
CHAPITRE 1 RESEARCH PROBLEMS, OBJECTIVES ...5
1.1 Treatments of Asphalt Pavement Preservation ...5
1.2 Researches Problem ...8
1.3 Research Objectives ...8
1.4 Organization of Thesis ...9
CHAPITRE 2 LITERATURE REVIEW ...11
2.1 Introduction ...11
2.2 Slurry Seal Mix Design Procedures: ...12
2.2.1 ISSA Design Method for Slurry Seal, ISSA A105 ... 12
2.2.2 ASTM Design Method for Slurry Seal, ASTM D3910-98 ... 17
2.2.3 ISSA TB111 – Outline Guide Design Procedure for Slurry Seal ... 19
2.3 Micro-Surfacing Mix Design Procedures: ...22
2.3.1 ISSA Design Method for Micro-surfacing, ISSA A143 ... 22
2.3.2 ASTM Design Method for Micro-Surfacing, ASTM D 6372-99a ... 28
2.3.3 TTI Design Method for Micro-surfacing, TTI 1289 ... 30
2.3.4 Caltrans Mix Design Method for Slurry Seal and Micro-surfacing ... 33
CHAPITRE 3 MATERIALS USED IN STUDY ...41
3.1 Mineral Aggregates ...41
3.2 Aggregates gradation ...41
3.3 Asphalt Emulsion ...43
CHAPITRE 4 DESIGN OF THE EXPERIMENT ...45
4.1 Introduction ...45
4.2 Dependent Variables (Responses) ...46
4.3 Independent Variables (Factors) ...46
4.4 Study Design ...47
4.4.1 Study Design, Phase І ... 47
4.4.2 Study Design, Phase ІІ ... 48
4.5 Statistical Analysis of Results ...48
CHAPITRE 5 DESCRIPTION OF ISSA MIX DESIGN TESTS EVALUATED ...51
5.1 Introduction ...51
5.2 Technical descriptions of the test apparatus and procedures ...52
5.2.1 Mixing Time Test (ISSA TB 113) ... 52
5.2.2 Modified Cohesion Test (ISSA TB 139) ... 53
5.2.3 Wet Track Abrasion Test (ISSA TB 100) ... 56
5.2.5 Multilayer Loaded Wheel Test
Vertical & Lateral Displacement (Method A-ISSA TB 109) ... 61
5.2.6 Wet Stripping Test ... 62
CHAPITRE 6 STUDY OF MICRO-SURFACING DESIGN PARAMETERS ...65
6.1 Introduction ...65
6.2 Loaded wheel test result analysis ...66
6.3 Wet Track Abrasion Test Result Analysis ...71
6.3.1 Test Result Analysis of 1-Hour Soaked Samples ... 71
6.3.2 Test Result Analysis of 6-Day Soaked Samples ... 76
6.4 Relative Moisture Retained in the samples ...81
6.4.1 Relative Moisture Retained in the samples of Loaded Wheel Test ... 81
6.4.2 Relative Moisture Retained in the samples of Wet Track Abrasion Test ... 86
6.5 Modified Cohesion Test Results Analysis ...91
6.5.1 Test Results Analysis for Cohesion at 30 minutes... 91
6.5.2 Test Results Analysis for Cohesion at 60 minutes: ... 102
6.6 Mixing Time Test Results Analysis ...108
6.7 Results Summary ...112
CHAPITRE 7 MODIFICATION TO ISSA A-143 MIX DESIGN PROCEDURE ...115
7.1 Introduction ...115
7.2 Modification to Outline Guide Design Procedure for Micro-surfacing ...115
7.2.1 Preliminary design considerations ... 118
7.2.2 Job Mix Formula Procedures ... 118
7.3 Validate Modified Design Procedure for Three Types of Aggregates ...119
CONCLUSION ...133 RECOMMANDATIONS ...137 APPENDIX I ...139 APPENDIX II ...145 APPENDIX III ...155 APPENDIX IV...163 APPENDIX V ...169 LIBRARY REFRENCES ...173
LIST OF TABLES
Page
Table 2.1 ISSA Types I, II, and III aggregate gradations for slurry seal ...12
Table 2.2 Aggregate tests and criteria for slurry seal ...12
Table 2.3 Asphalt Emulsion Specifications for Slurry Seal ...13
Table 2.4 Mix Tests Recommended by the ISSA for Slurry Seal ...14
Table 2.5 ASTM types I, II, and III aggregate gradations for Slurry Seal ...17
Table 2.6 Mix Tests Recommended by the ASTM for Slurry Seal ...18
Table 2.7 ISSA Type II and III aggregate gradation for Micro-surfacing ...22
Table 2.8 Aggregate tests and criteria for Micro-surfacing ...23
Table 2.9 Asphalt Emulsion Specifications for Micro-surfacing ...24
Table 2.10 Mix Design Tests recommended by ISSA for Micro-surfacing ...25
Table 2.11 Compatibility Classification system suggested by ISSA for Micro-surfacing ...27
Table 2.12 ASTM type II and III for Micro-surfacing ...28
Table 2.13 Aggregate tests and criteria for micro-surfacing ...29
Table 2.14 Mix design tests recommended by ASTM for micro-surfacing ...29
Table 2.15 TTI Type II and III aggregate gradation for Micro-surfacing ...30
Table 2.16 TTI Aggregates specifications for micro-surfacing ...31
Table 3.1 Gradations of the aggregates used in this study ...42
Table 3.2 CQS-1HP Asphalt Emulsion properties from supplier ...43
Table 6.1 Summary of test results of loaded wheel test (sand adhesion) ...66
Table 6.2 ANOVA Table, Output of LWT Results ...68
Table 6.4 ANOVA Output of Analysis of Variance for WTAT (1-Hour Soaked) ...73 Table 6.5 Summary of test results for WTAT (6-Day Soaked) ...76 Table 6.6 ANOVA Output of Analysis of Variance for WTAT (6-Day Soaked) ...78 Table 6.7 Summary of test results of
Relative Moisture Retained in LWT test Samples ...81 Table 6.8 ANOVA Output of
Analysis of Variance Moisture Retained in LWT Sample ...83 Table 6.9 Summary of test results of
Moisture Retained in Wet Abrasion Sample ...86 Table 6.10 ANOVA Output of
Analysis of Variance Moisture Retained in WTAT Samples ...88 Table 6.11 Summary of test results of Modified
Cohesion Test at 30 min, mixtures prepared without Portland cement ...92 Table 6.12 ANOVA Table, Output of Modified Cohesion
Test at 30 (minutes), mixtures prepared without Portland cement ...94 Table 6.13 Summary of test results of Modified Cohesion
Test at 30 min, mixtures prepared with 1% Portland cement ...98 Table 6.14 Summary of test results for Modified Cohesion
Test at 60 minutes, mixture prepared without Portland cement ...102 Table 6.15 ANOVA Table, Output of Modified Cohesion
Test Results at 60 minutes, mixtures prepared without cement ...104 Table 6.16 Summary of test results for Modified Cohesion
Test at 60 minutes, mixtures prepared with 1% Portland cement ...107 Table 6.17 Summary of test results for Mixing Time ...109 Table 6.18 ANOVA, Output of Mixing Time Test (min) ...110 Table 6.19 Results summary for all tests
done on micro-surfacing shown chapter 6 ...113 Table 6.20 Max and min coefficients
Table 7.1 Mixing Time test results, Raycar, Graham Pitt and rive-sud aggregates ...120 Table 7.2 Wet Stripping test results,
Raycar, Graham Pitt and rive-sud aggregtes ...121 Table 7.3 30-min cohesion test results,
Raycar, Graham Pitt and rive-sud aggregates ...122 Table 7.4 60-min cohesion test results,
Ray car, Graham Pitt and Rive sud aggregates ...123 Table 7.5 Lateral displacement results, Ray car, Graham Pitt and Rive sud aggregates ...124 Table 7.6 Vertical displacement results, Ray car, Graham Pitt and Rive sud aggregates ...126
LIST OF FIGURES
Page
Figure 1.1 Use of preventive
maintenance treatments to defer the need for rehabilitation ...5
Figure 1.2 Pavement option curve (PCI= Pavement condition Index ...6
Figure 2.1 Consistency test, mixture with 2cm Flow ...15
Figure 2.2 Consistency test, mixture with 3cm Flow ...15
Figure 2.3 Factors Used in Calculating Surface Area of Slurry Seal ...20
Figure 2.4 Graphical Determination of Optimum Asphalt Content ...21
Figure 2.5 German Mix Test Cohesion Parameters versus Time ...34
Figure 2.6 German Mix Tester ...37
Figure 2.7 Automated Cohesion Tester (ACT) ...38
Figure 2.8 Humidity chamber for curing in high and low humidity conditions ...38
Figure 2.9 Modified wet track abrasion tester ...40
Figure 3.1 Gradation curve for Ray-Car 0-5 mm Aggregates ...42
Figure 5.1 Modified Cohesion Tester ...55
Figure 5.2 Wet Track Abrasion Testing Machine (Hobart N-50) ...58
Figure 5.3 Loaded Wheel Testing Machine ...60
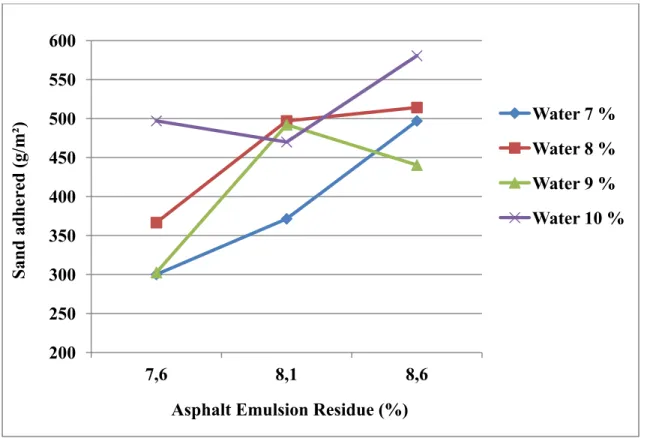
Figure 6.1 Loaded wheel test sand adhesion values against asphalt emulsion residue with 7, 8, 9, and 10% added water content ...67
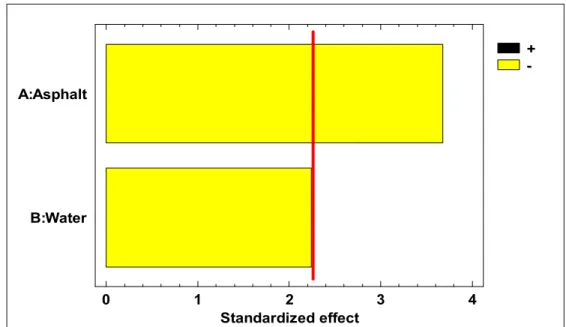
Figure 6.2 Standardized Pareto chart for Loaded Wheel Test Results (The red line represent the estimated critical F value) ...69
Figure 6.3 Effects of Asphalt Emulsion Residue and Water on LWT test Results (Main Effect Plot) ...70
Figure 6.4 Effects of Asphalt Emulsion Residue and Water on LWT test Results (Estimates Response) ...70
Figure 6.5 1-hour soak wet track abrasion values against asphalt emulsion residue with 7, 8, 9, and 10% added water ...72
Figure 6.6 Standardized Pareto chart for Wet Track Abrasion Test Results (1-Hour Soaked Samples) (The red line represent the estimated critical F value) ...74 Figure 6.7 Effects of Asphalt Emulsion
Residue and Water on Wet Track Abrasion Test (1-Hour Soaked) (Main Effect Plot) ...75
Figure 6.8 Effects of Asphalt Emulsion Residue and
Water on Wet Track Abrasion Test (1-Hour Soaked) (Estimates Response) ...75
Figure 6.9 6-day soak wet track abrasion values against asphalt emulsion residue with 7, 8, 9, and 10% added water ...77 Figure 6.10 Standardized Pareto chart for Wet Track Abrasion Test Results (6-day Soaked Samples) (The red line represent the estimated critical F value) ...79 Figure 6.11 Effects of Asphalt Emulsion Residue and
Water on Wet Track Abrasion Test (6-Day Soaked) (Main Effect Plot) ...80
Figure 6.12 Effects of Asphalt Emulsion Residue and
Water on Wet Track Abrasion Test (6-Day Soaked) (Estimates Response) ...80
Figure 6.13 Relative moisture retained (in loaded wheel test samples) values against asphalt emulsion residue with 7, 8, and 9% added water ...82 Figure 6.14 Standardized Pareto chart for
Results of Relative Moisture Retained in Sample (The red line represent the estimated critical F value) ...84
Figure 6.15 Effects of Asphalt Emulsion Residue and Water on Results of Relative Moisture Retained (Main Effect Plot) ...85
Figure 6.16 Effects of Asphalt Emulsion Residue and Water on Results of Relative Moisture Retained (Estimates Response) ...85
Figure 6.17 Relative moisture retained (in wet track abrasion samples) values against asphalt emulsion residue with 7, 8, 9, and% added water ...87
Figure 6.18 Standardized pareto chart for results of relative moisture retained in WTAT samples (The red line represent the estimated critical F value) ...89
Figure 6.19 Effect of Asphalt Emulsion Residue and Water on Results of Relative Moisture Retained in WTAT Samples (Main Effect Plot) ...90
Figure 6.20 Effect of Asphalt Emulsion Residue and Water on Results of Relative Moisture Retained in WTAT Samples (Estimated Response) ...90
Figure 6.21 30-minute wet cohesion torque values against different asphalt emulsion residue with 8, 9, and 10% water, mixtures prepared without Portland cement ...93
Figure 6.22 Standardized pareto chart for Modified Cohesion at 30 minutes, mixtures prepared without Portland cement ...95
Figure 6.23 Effect of Asphalt Emulsion Residue and Water on Results of Modified Cohesion Test at 30 minutes, mixtures prepared without Portland cement (Main Effect Plot) ...97
Figure 6.24 Effect of Asphalt Emulsion Residue and Water on Results of Modified Cohesion Test at 30 minutes, mixtures prepared without Portland cement (Estimates Response) ...97
Figure 6.25 30-minute wet cohesion torque values against different asphalt emulsion residue with 9, 10, and 11% water, mixtures prepared with 1% Portland cement ...99 Figure 6.26 Comparison between 30-min
cohesion values of mixture prepared with and without Portland cement at 8.1% asphalt emulsion residue ...100 Figure 6.27 Comparison between 30-min cohesion values of mixture prepared
with and without Portland cement at 7.6% asphalt emulsion residue ...101 Figure 6.28 Comparison between 30-min cohesion values of mixture prepared
with and without Portland cement at 8.6% asphalt emulsion residue ...101 Figure 6.29 60-minute wet cohesion torque values
against different asphalt emulsion residue with 8, 9, and 10% water, mixtures prepared without Portland cement ...103
Figure 6.30 Standardized pareto chart for Modified Cohesion at 60 minutes, mixtures prepared without Portland cement ...105
Figure 6.31 Effects of Asphalt Emulsion Residue and
Water on Results of Modified Cohesion Test at 60 minutes,
mixtures prepared without Portland cement (Main Effect Plot) ...106
Figure 6.32 Effects of Asphalt Emulsion Residue and Water on Results of Modified Cohesion Test at 60 minutes, mixtures prepared without Portland cement (Estimates Response) ...106
Figure 6.33 60-minute wet cohesion torque values against different asphalt emulsion residue with 9, 10, and 11% water, mixtures prepared with 1% Portland cement ...108
Figure 6.34 Plot of raw data for mixing time values versus asphalt emulsion residue at 8, 9, and 10% added water content ...109
Figure 6.35 Standardized Pareto chart for Mixing Time Test (min) ...111
Figure 6.36 Effects of Asphalt Emulsion Residue and Water on Results of Mixing Time Test (Main Effect Plot) ...112
Figure 7.1 Flowchart of ISSA mix design procedure for micro-surfacing ...116
Figure 7.2 Flowchart of proposed mix design procedure for micro-surfacing ...117
Figure 7.3 Comparison of 30-min cohesion test results, Ray car, Graham Pitt and Rive sud aggregates ...122
Figure 7.4 Comparison of 60-min cohesion test result, Raycar, Graham Pitt and rive-sud aggregates ...123
Figure 7.5 Comparison of lateral displacement test results, Ray car, and Graham Pitt and Rive sud aggregates with 8.1% asphalt emulsion, 1% cement, at optimum added water content ....125
Figure 7.6 Comparison of vertical displacement test results, Raycar, and Graham Pitt and rive-sud aggregates with 8.1% asphalt emulsion, 1% cement, at optimum added water content ....127
Figure 7.7 Lateral displacement test results, Ray car aggregates ...128
Figure 7.8 Lateral displacement test results, Graham Pitt aggregates ...128
Figure 7.9 Lateral displacement test results, Rive sud aggregates ...129
Figure 7.10 Vertical displacement test results, Ray car aggregates ...129
INTRODUCTION
Roads are an essential component of Quebec's economy as they ensure the movement of passengers and goods. Road Transport plays an important role in the economy of Quebec’s province and provides the basic infrastructure for bringing the majority of the people who are living in far off villages into the mainstream of life by connecting them with the rest of the province. Quebec's road network includes approximately 185 000 kilometers of roads. Quebec Ministry of Transportation (MTQ) manages some 29 000 kilometers of freeways (commonly known in Quebec as autoroutes), national highways (Quebec's primary highways), regional highways (Quebec's secondary highways) and collector roads, as well as 4 700 bridges and overpasses, 1 200 kilometers of resource access roads and 3 600 kilometers of mining roads. The gross replacement cost of the road infrastructures under the MTQ’s responsibility is estimated at over $30 billion for the entire province .
Pavement preservation is defined as a program employing a network-level, long-term strategy that enhances pavement performance by using an integrated, cost-effective set of practices that extend pavement life, improve safety, and meet motorist expectations (FHWA, 2005). Actions used for pavement preservation include routine maintenance, preventive maintenance (PM), and corrective maintenance (Uzarowski et Bashir, 2007). Transportation agencies use chip seal, slurry seal, micro-surfacing, cape seal, fog seal, etc.
Slurry seal is a pavement coating that consists of fine and hundred percent crushed aggregates, emulsified asphalt and water which is applied to roadway. Slurry seals were developed and used for the first time in Germany, in the late 1920’s (International Slurry Surfacing Association, 2011). At that time, the product consisted of a mixture of very fine aggregates, asphalt binder, and water, and was mixed by introducing the components into a tank outfitted with an agitator. It proved to be a novel approach, a new and promising technique for maintaining road surfaces, and marked the beginning of slurry seal development. However, it was not until the 1960’s, with the introduction of improved
emulsifiers and continuous flow machines, that real interest was shown in the usage of slurry seal as a maintenance treatment for a wide variety of applications (International Slurry Surfacing Association, 2011). Slurry seal can be used on the new pavements of both low and high volume roads and even airports runways and taxiways. It also can be used on parking areas and bike paths. However, one of the important applications of slurry seal is to form cape seal. Cape seal is a layer of chip seal which is followed by slurry seal or micro-surfacing and resulted in a high pavement delineation and preventative maintenance method (International Slurry Surfacing Association, 2011).
Micro-surfacing was developed in an attempt to form a thicker slurry seal that could be used in wheel paths and ruts in order to avoid long rehabilitation work on high traffic roads. To do this, high quality aggregates and advances emulsions were incorporated in order to reach a stable product which is applied in malty-stone thickness and provide rutting resistance. Micro-surfacing was pioneered also in Germany, in the late 1960’s and early 1970’s (International Slurry Surfacing Association, 2011). Micro-surfacing was the result of combining highly selected aggregates and bitumen, and then incorporating special polymers and emulsifiers that allowed the product to remain stable even when applied in multi-stone thicknesses. Micro-surfacing was introduced in the United States in 1980, as a cost-effective way to treat the surface wheel-rutting problem and a variety of other road surface problems (International Slurry Surfacing Association, 2011). Micro-surfacing is applied in double layer for addressing surface irregularities. Moreover, micro-surfacing has variety of applications where fast traffic times are of concern. It also can apply on concrete bridge decks, airports runways and night works.
Micro-surfacing is differing from Slurry seal in many areas. The emulsified asphalt used for Micro-surfacing has higher polymer content and higher asphalt residual content. Using faster setting chemical in the asphalt emulsion applied in Micro-surfacing allows faster break of this product rather than Slurry Seal. This ability makes Micro-surfacing able to support traffic as quick as one hour after placement while Slurry Seal required more time in order to
support traffic. Moreover, Micro-surfacing use high quality aggregates rather than Slurry Seal and this provide higher skid resistance which allow Micro-surfacing to be used in wheel ruts.
Although there are several applications of Slurry Seal and Micro-surfacing, current tests and mix design methods mostly rely on laboratory condition and the correlations between laboratory results and field performance are very poor. Also, there are various environmental factors that influence performance of such products in the field. Therefore, there is a need to develop new mix design procedures, specifications, and guidelines for Slurry Seal and Micro-surfacing to improve reproducibility of the test methods and to provide a correct relationship between field performance and laboratory results. There are currently several procedures, guidelines and specifications for Slurry Seal and Micro-surfacing. International Slurry Seal Association (ISSA), American Society for Testing and Materials (ASTM), Texas Transport Institute (TTI), California Department of Transportation (Caltrans) and European Union has a similar set of specifications, guidelines and procedures on the design and use of Slurry seal and Micro-surfacing.
Recognizing the need for more rational design methods for Micro-surfacing, McAsphalt Industries Limited enlisted the École de Technologie Supéerieure, Montreal, Quebec (ETS) to form a pooled fund study to develop a new mix design procedure for Micro-surfacing that specifically address characterization of its field performance indicator. This report intended to review the current mix design procedures for Slurry Seal and Micro-surfacing and suggest a new mix design procedures, guideline and specifications for Micro-surfacing as a high performance surface treatment and pavement preservation method.
CHAPITRE 1
RESEARCH PROBLEMS, OBJECTIVES 1.1 Treatments of Asphalt Pavement Preservation
Pavement preservation is a planned system of treating pavements at the optimum time to maximize their useful life. Pavement preservation enhances pavement longevity at the lowest cost. Both rigid and flexible pavement must withstand wheel loads, environmental effects, and temperature variations. Factors deteriorating asphalt pavements include environmental and wheel load-related factors. Load-related stresses develop fatigue cracking and rutting, whereas environmental factors induce thermal cracking, block cracking, and weathering and raveling (Uzarowski et Bashir, 2007). Pavements must be treated in time in order to avoid increase of deterioration rates due to these cracks (Figure 1.1).
Figure 1.1 Use of preventive maintenance treatments to defer the need for rehabilitation (Katie Zimmerman, September, 2006) Extracted from Pavement Preservation Compendium, U.S Department
Pavement condition changes with time and requires different types of treatments as shown in Figure 1.2. The Pavement Condition Index (PCI) is a numerical index between 0 and 100 and is used to indicate the condition of a roadway. The PCI provides a numerical rating for the condition of road segments within the road network, where 0 is the worst possible condition and 100 is the best. If pavement is seriously cracked, major rehabilitation is required.
Figure 1.2 Pavement option curve (PCI= Pavement condition Index (Larry Galehouse, 2006)
Extracted from Pavement Preservation Compendium, U.S Department of Transportation, Federal Highway Administration, Larry Galehouse (2006, p. 71) Figure 1.2 shows how timely application of the right treatments to the right road at the right time can reduce the cost of pavement treatment. This figure is representative for a road with a design life of about 20 years. If pavement preservation treatment is applied before year 15, this kind of treatment will generally restore the pavement condition. In this case, pavement preservation treatment costs $1.00 per yd2. However, if treatment is delayed, there should apply rehabilitation treatment, which generally cost 6 to 10 times more ($6 to $10 per yd2) than the cost of pavement treatment.
Asphalt pavement preservation activities are divided into three major categories (Uzarowski et Bashir, 2007):
1. Routine Maintenance Treatment: i Crack filling/ sealing
ii Patching
2. Preventive Maintenance Treatment: i Fog seals ii Surface rejuvenating iii Micro-milling iv Thin surfacing: a. Chip seal b. Slurry seal c. Micro-surfacing d. Metro-mat e. Nova chip
f. Thin hot-mix asphalt overlay
3. Corrective Maintenance: i Full-depth patching ii Milling
Major rehabilitation treatments for pavements are divided into three major categories (Uzarowski et Bashir, 2007):
1. structural overlays
2. recycling:
i Hot in-place recycling (HIR) with emulsion or foamed asphalt ii Cold in-place recycling (CIR) with emulsion or foamed asphalt iii Full-depth reclamation (FDR) with foamed asphalt
3. Reconstruction
1.2 Researches Problem
There are a number of mix design procedures for micro-surfacing developed by several agencies: International Slurry Surfacing Association (ISSA TB A143), American Society for Testing and Materials (ASTM 6372-99a), Texas Transportation Institute (TTI 1289), and California Department of Transportation (CALTRANS). Among these, only the ISSA mix design procedure for micro-surfacing (ISSA TB A143) is widely used. This mix design procedure mostly relies on laboratory condition, and the correlation between laboratory results and field performance is poor. Also, it does not offer procedure to select optimum mix proportions for micro-surfacing mixtures.
1.3 Research Objectives
The overall goal of this study is to improve the performance of micro-surfacing mixtures through the development of a rational mix design procedure, guidelines, and specifications. This overall goal should be achieved with the use of micro-surfacing equipment with the following specific objectives:
1. To evaluate the influence of several factors (aggregate type, asphalt emulsion content, added moisture content, and the use of Portland cement additives) on the properties and performance of asphalt emulsion treated mixture types especially used in Quebec.
2. To evaluate some additional mix design tests to select optimum mix proportions for micro-surfacing mixtures.
1.4 Organization of Thesis
This thesis is divided into seven chapters. Chapter 1 is an introduction to the study. It describes the concept of pavement preservation, benefits of preventive maintenance, background on Slurry Seal and Micro-surfacing, problem statement and objectives of the study. Chapter 2 is a literature review of the entire Slurry Seal and Micro-surfacing mix design procedures. It includes ISSA, ASTM, TTI, CALTRONS and other mix design procedure for Slurry Seal and Micro-surfacing. Chapter 3 describes the materials used in study. Chapter 4 is about design of the experiments. Chapter 5 is about description of ISSA mix design tests evaluated in study. Chapter 6 discusses the study of design parameters of Micro-surfacing mixtures. It includes preparing and testing Micro-surfacing mixture using four mixture design tests proposed by the ISSA. Chapter 7 describes modification to the micro-surfacing mix design procedures. Conclusions of this study and recommendations for future investigations are also presented at the end of this thesis.
CHAPITRE 2 LITERATURE REVIEW 2.1 Introduction
Among all mix design guidelines, ISSA and ASTM guidelines are the most accepted and practiced around the world. ISSA developed A105 guideline for Slurry Seal mix design (ISSA, 2005) and A143 guideline for Micro-surfacing (ISSA, 2005). ASTM suggested D3910 guideline for Slurry Seal (ASTM, 1998), and D6372 for Micro-surfacing (ASTM, 1999). Despite the differences between Slurry Seal and Micro-Surfacing (i.e., application thickness, traffic volume, and curing mechanisms), both ISSA and ASTM suggested similar test methods and design procedure to evaluate Slurry Seal and Micro-surfacing. In fact these procedures do not make any distinct between Slurry Seal and Micro-surfacing mix design and consider same test methods for both systems. While Texas Transport Institute (TTI) studies documented the problems associated with using the existing methods for micro-surfacing and suggested the development of a comprehensive mix design especially for Micro-surfacing (TTI, 1995). California Department of Transportation (Caltrans) has also studied both systems of Slurry Seal and Micro-surfacing together in order to provide a rational mix design procedure (Caltrans, 2004). The minister de transport Quebec (MTQ) has developed its own specification for micro-surfacing. The European Union has a similar set of standards and norms to design Slurry Seal and Micro-surfacing. Other countries such as Germany, France, United Kingdom, and South Africa have had experience with Slurry Seal and Micro-surfacing systems, and have developed specific guidelines for their specific use. However, among all these guidelines, ISSA and ASTM are commonly used worldwide. All the above mentioned standards are reviewed in this part of study.
2.2 Slurry Seal Mix Design Procedures:
2.2.1 ISSA Design Method for Slurry Seal, ISSA A105 (ISSA, 2005)
This guideline and specification is the most widely used procedure for the design of Slurry Seal. The components of the mix are tested first. Based on this standard, aggregate gradation has to be conform with one of the three gradations given in the table 2.1.
Table 2.1 ISSA Types I, II, and III aggregate gradations for slurry seal Adopted From (ISSA, 2005)
Sieve Size % Passing by Weight Stockpile
Tolerance,%
In mm Type I Type II Type III
3/8 9.500 100 100 100 No. 4 4.750 100 90-100 70-90 +/- 5 No. 8 2.360 90-100 65-90 45-70 +/- 5 No. 16 1.180 65-90 45-70 28-50 +/- 5 No. 30 0.600 40-60 30-50 19-34 +/- 5 No. 50 0.300 25-42 18-30 12-25 +/- 4 No. 100 0.150 15-30 10-21 7-18 +/- 3 No.200 0.075 10-20 5-15 5-15 +/- 2
Also, the aggregate has to pass the tests and criteria listed in the table 2.2:
Table 2.2 Aggregate tests and criteria for slurry seal Adopted From (ISSA, 2005)
AASHTO
TEST NO ASTM TEST NO QUALITY SPECIFICATION
ASHTO
T-176 ASTM D 2419 Sand equivalent 45 Minimum AASHTO T-104 ASTM C 88 Soundness 15% Maximum using Na₂SO₄ or 25% Maximum Using MgSO₄ AASHTO
The mineral filler can be any non-air entrained hydrated lime or Portland cement. This mineral filler has to conform with ASTM D-242 as well (Ramirez, 1994).
Based on the ISSA specification, the asphalt emulsions type can be: SS-1, SS-1h, CSS-1, CSS-1h, QS-1h, CQS-1h or Quick-Set Mixing Grade as specified in ASTM D977 (ASTM, 2003) and D2397 (ASTM, 1999), with the caveat that the cement mixing test can be waived.
Table 2.3 Asphalt Emulsion Specifications for Slurry Seal Adopted From (ISSA, 2005)
In addition, the asphalt emulsion must have a minimum of 60% residue (ASTM, 1999). The emulsion residue must have a penetration value of 40 to 90, which is 0.1 mm at 25°C (77°F), as shown in table 2.3. Table 2.4 gives the mix tests recommended for Slurry Seal.
Below is the description of tests based on mix test recommended by the ISSA for Slurry Seal. Again, in the ISSA mix design, not all tests are required and designers are permitted to eliminate tests based on their past experience with the material.
AASHTO TEST METHOD
ASTM TEST
METHOD QUALITY SPECIFICATIONS
TEST ON EMULSION
AASHTO T59 ASTM D-244 Residue after
Distilliation 60% Minimum TEST ON EMULSION RESIDUE
Table 2.4 Mix Tests Recommended by the ISSA for Slurry Seal Adopted From (ISSA, 2005)
ISSA TEST NO DESCRIPTION SPECIFICATION
ISSA TB 106 Slurry Seal Consistency Between 2 to 3 cm flow
ISSA TB 139 (For Quick-Traffic
Systems)
Wet Cohesion 30 Minutes Minimum (Set) Wet Cohesion 60 Minute Minimum
12 kg-cm Minimum 20 kg-cm minimum ISSA TB 109
(For Heavy-Traffic Areas Only)
Excess Asphalt by Loaded Wheel Test
Sand Adhesion 538 g/m² Maximum
ISSA TB 114 Wet Stripping Pass (90% Minimum)
ISSA TB 100 Wet Track Abrasion Lost, One-Hour Soak 807 g/m² Maximum
ISSA TB 113 Mix Time Controllable to 180 second Minimum
1) Consistency Test, ISSA TB 106
Cone consistency test is used to determine proper amount of water at which mixture is workable (ISSA, 2005). Mixture designer prepares several trial mixtures using 400 grams dried aggregate with optimum asphalt emulsion, and different amount of water. The number of trial mixtures is not stated in ISSA TB 106 and designer can prepare as many samples as required to reach desired workable mixture. Based on ISSA TB 106, cone is centered on the flow scale and filled with mixture within 30 second. The con is then immediately removed and outflow of the slurry is measured at four points 90º apart. For a mix to pass the consistency test, the flow should be between 2 cm and 3 cm (ISSA, 2005) (see Figure 2.1, Figure 2.2).
Figure 2.1 Consistency test, mixture with 2cm Flow
2) Modified Cohesion Test, ISSA TB 139
Modified Cohesion Tester is used to measure cohesion of the mixture at suitable time intervals such as 30, 60, 90, 150, 210, and 270 minutes after casting (ISSA, 2005). To do this, a torque wrench is used to measure the torque required to rotate neoprene cylinder in contact with the specimen. Set time is defined as the elapsed time after casting when a slurry system may not be remixed into homogenous slurry. A plot of torque versus time is developed based on modified cohesion test results to classify the system in terms of set time and traffic time.
3) Mix Time Test, ISSA TB 113
This test makes use of trial mixtures to identify if the material can be mixed at temperature of 77ºF (25ºC) and 100ºF (37, 7ºC) for at least 120 and 180 seconds respectively (ISSA, 2005). It can be a good reference check to verify consistent sources of material.
4) Wet-Track Abrasion Loss Test, ISSA TB 100
Wet track abrasion test is a field simulation test to measure the wearing qualities of micro-surfacing mixture under wet abrasion conditions (ISSA, 2005). Wet track abrasion test establishes the minimum asphalt emulsion content necessary to prevent excessive raveling of cured micro-surfacing mixture. This test was conducted after curing the samples. Wet track abrasion test were performed on 1-hour soaked sample to determine susceptibility to short-term moisture exposure. The result of the test is the loss in weight of the specimen expressed in grams per square meter (or square foot) and is reported as the wear value, also denoted as WTAT loss. For a design to be acceptable, the one-hour soak WTAT wear value must be less than 807 g/m² or 75 g/ft².
5) Loaded Wheel Test, ISSA TB 109
Loaded wheel test measures the resistance of mixture against flushing under heavy traffic. This test establishes the maximum asphalt emulsion content necessary to prevent flushing of cured micro-surfacing mixtures (ASTM 1998). The mixture is compacted by means of a
loaded, rubber tired, reciprocating wheel. The measured parameter is the sand adhesion, which is an indirect measure of the amount of excess asphalt in the mix. Sand adhesion value is a function of the number of cycles (usually 1,000 cycles conditioning and 100 for the test) and load (usually 57 kg [125 lbs] plus the weight of the frame). For a design to be acceptable, the LWT sand adhesion has to be less than 538 g/m² or 50 g/ft².
2.2.2 ASTM Design Method for Slurry Seal, ASTM D3910-98 (ASTM, 1998)
Similar to ISSA A105, ASTM D3910-98 guideline and specification are another widely used procedure for the design of Slurry Seal. Based on this standard, the components of the mix are tested first. Aggregate gradation has to conform to one of the three gradations give in the table 2.5.
Table 2.5 ASTM types I, II, and III aggregate gradations for Slurry Seal Adopted From (ASTM, 1998)
Sieve Size % Passing by Weight
in mm Type I Type II Type III
3/8 9.500 100 100 100 No. 4 4.750 100 90-100 70-90 No. 8 2.360 90-100 65-90 45-70 No. 16 1.180 65-90 45-70 28-50 No. 30 0.600 40-60 30-50 19-34 No. 50 0.300 25-42 18-30 12-25 No. 100 0.150 15-30 10-21 7-18 No.200 0.075 10-20 5-15 5-15
The mineral filler can be any non-air entrained hydrated lime or Portland cement. This mineral filler has to conform with ASTM D-1073 as well. Based on the ASTM specification for slurry Seal, the asphalt emulsion has to be a SS-1h, CSS-1h, QS-1h or a CQS-1h.
Also, the aggregate has to pass the following tests and criteria:
1. Quality requirements of ASTM Specification D1073 (ASTM, 2001). 2. Sand equivalent no less than 45.
4. Water absorption less than 50% of the total combined aggregate.
The tests recommended by the ASTM procedure for Slurry Seal are shown in table 2.6. Table 2.6 Mix Tests Recommended by the ASTM for Slurry Seal
Adopted From (ASTM, 1998)
ASTM TEST RECOMMENDED FOR SLURRY SEAL SPECIFICATION Slurry Seal Consistency (ISSA TB 106) Between 2 to 3 cm flow
Set Time Less than 12 hours
Cure Time (ISSA TB 139) Less than 24 hours Wet Track Abrasion Lost, One-Hour Soak (ISSA TB 100) 807 g/m² Maximum
Below is the description of the ASTM tests for Slurry Seal. Among the four of ASTM mix design procedure, Slurry Seal consistency test (ISSA TB 106) and Wet Track Abrasion Lost, One-Hour Soak (ISSA TB 100) are exactly the same with the tests described in sections 2.2.1.2 and 2.2.1.4. However Set Time and Cure Time tests are different and described below.
1) Set Time Test
Set time test is used to determine the time required for mixture to reach initial set. Based on this test, the slurry is poured on a flat surface, screeded to 6mm (0.25 in) thickness, and the wet surface of mixture is dried by pressing a white paper towel at several time intervals. Set time is the time required to obtain a stain-free blot. For design to be acceptable, the initial set time of mixture must be less than 12 hours.
2) Cure Time Test, ISSA TB 139
Modified Cohesion Tester is used to measure cohesion of the mixture at the interface between a rotating neoprene cylinder and the test specimen (ISSA, 2005). Based on this test,
the cure time is the time required to reach a constant maximum torque. For design to be acceptable, the cure time must be less than 24 hours.
2.2.3 ISSA TB111 – Outline Guide Design Procedure for Slurry Seal (ISSA, 2005) ISSA TB 111 presents a different method of design procedure for Slurry Seal. This design procedure suggests ranges of variation for the input design variables and provides a method to choose the optimum design while ISSA A-105 does not suggest any method to choose the optimum design. ISSA TB 111 was developed from papers presented by Huffman, Benedict, Gordillo, and others at the ISSA World Congress in Madrid and the Asphalt Emulsion Manufacturers Association (AEMA) convention in Phoenix, in 1977. The method has two parts.
Part I is about primary design considerations. In this part, information such as pavement surface condition, climate condition, and traffic volume are considered. Then objective of surface treatments is stated. These objectives can be improving skid resistance of surface, crack filling, or rut correction. At the end part I suitable aggregate type, gradation and asphalt emulsion materials are selected.
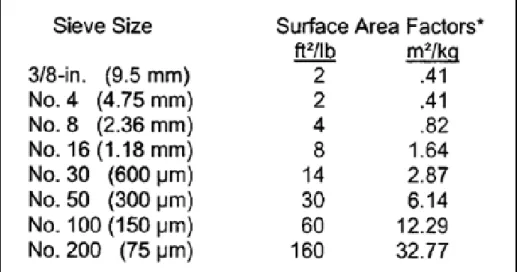
Part II is about developing a job mix formula for the selected materials in part I. Firstly, theoretical bitumen requirement (BR) is obtained by adding the percent bitumen required for an 8µm coating and the percent required for absorption. Percent bitumen required for an 8µm coating is determined by Surface Area Method. The surface area of aggregate is calculated by multiplying the percent of aggregate passing a given sieve by a surface area factor based on the sieve size. The surface area of the aggregate is determined for each particle size and then summed to obtain the total surface area in square meter per kilogram (m²/kg). Figure2.3 shows factors used in calculating surface area of slurry seal aggregates suggested by ISSA TB 118. The absorption requirements of the aggregate are determined by using the Centrifuge Kerosene Equivalent test. The amount of Kerosene retained by the aggregate is assumed to approximate the amount of bitumen that the aggregate will absorb.
Figure 2.3 Factors Used in Calculating Surface Area of Slurry Seal
Extracted from Technical Bulletin (ISSA TB 118) International Slurry Seal Associations (2005, p. 1)
Three level of BR is selected from surface area method, and then, the water and cement content for mixture is selected so that the minimum of 80 second mixing time is provided based on mix time test (ISSA TB 102). This 80 seconds minimum time is required to ensure that the mixture will be able to mix without breaking in the slurry machine. Then, for each BR level that was selected from previous step, optimum water content is selected. For this, a number of Consistency test (ISSA TB 106) are carried out. The water content for each BR level that results in a 2.5 cm flow is reported as optimum water content for each BR level. At this time, designers have three levels of PAR, and optimum water content for each PAR. In order to check whether or not the optimum water content is correctly selected, designer run three consistency test with different water content for each of three BR levels to find 2 to 3 cm, 4 to 5 cm, and 6 to 7 cm flow in specimen mixture. These three mixtures are air dried and saved at ambient temperature. Next step is compatibility tests. In this step, designer examine cross-section of each three consistency specimen mixtures, saved from previous step, to evaluate asphalt or aggregate migration to specimen surface (bleeding and segregation?). If suspicious non-uniformity is observed, consistency test is run again, and water contents are adjusted. Wet stripping test are also conducted to evaluate poor mixture formulation in each mixtures. If result of consistency test is less than 90%, consistency test is
run again to adjust water content in mixtures. Finally, optimum BR is selected. For this, three formulations which meet requirements of two already described compatibility tests are selected for wet track abrasion (WTAT) and loaded wheel tests (LWT). A maximum limit of 807 g/m² for WTAT, and 538 g/m² for LWT is sated. A graph of physical test data is drawn and stated limit for PAR is superimposed. Designer read optimum asphalt content at the middle of stated limit (Figure 2.4). As it can be seen from figure 2.4, firstly, minimum asphalt emulsion is determined by wet track abrasion test. Then, loaded wheel test is used to establish maximum required asphalt emulsion for mixture. A graph of physical test data for wet track abrasion and loaded wheel test is superimposed. Designer read the optimum asphalt content as shown in figure 2.4.
Figure 2.4 Graphical Determination of Optimum Asphalt Content
Extracted from Technical Bulletin (ISSA TB 111) International Slurry Seal Associations (2005, p. 2)
2.3 Micro-Surfacing Mix Design Procedures:
2.3.1 ISSA Design Method for Micro-surfacing, ISSA A143
ISSA A143 guideline and specification is the most widely used mix design procedure for micro-surfacing. The components of the mix are tested first. Based on this standard, aggregate gradation has to conform to one of the two gradations given in table the 2.7.
Table 2.7 ISSA Type II and III aggregate gradation for Micro-surfacing Adapted from (ISSA, 2005)
Sieve Size % Passing by Weight Stockpile
Tolerance,%
in mm Type II Type III
3/8 9.500 100 100 No. 4 4.750 90-100 70-90 +/- 5 No. 8 2.360 65-90 45-70 +/- 5 No. 16 1.180 45-70 28-50 +/- 5 No. 30 0.600 30-50 19-34 +/- 5 No. 50 0.300 18-30 12-25 +/- 4 No. 100 0.150 10-21 7-18 +/- 3 No.200 0.075 5-15 5-15 +/- 2
As it can be seen from table 2.7, in micro-surfacing, aggregate gradation has to conform only to type II and III aggregate gradations while for slurry seal has to conform to type I, II, and III gradations.
This is the first difference between ISSA mix design procedures for slurry seal and micro-surfacing. It should be noted that type III aggregate gradation is coarser and more appropriate for high traffic load and volume.
Table 2.8 Aggregate tests and criteria for Micro-surfacing Adapted from (ISSA, 2005)
AASHTO
TEST NO ASTM TEST NO QUALITY SPECIFICATION
ASHTO
T-176 ASTM D 2419 Sand equivalent 65 Minimum AASHTO T-104 ASTM C 88 Soundness 15% Maximum using Na₂SO₄ or 25% Maximum Using MgSO₄ AASHTO
T-96 ASTM C 131 Abrasion Resistance 30% Maximum
As it can be seen form Table 2.8, ISSA mix design procedure for micro-surfacing recommend the maximum sand equivalent of 65% for aggregate while the recommended amount for slurry seal is a maximum of 45% for sand equivalent. This indicates that the aggregate use for micro-surfacing should have less relative proportion of detrimental fine dust or clay-like particles in fine portion of aggregates. In other words, the quality of micro-surfacing aggregates should be higher than quality of aggregates use for slurry seal. It also can be seen from tables 2.2 and 2.8 that aggregates used for micro-surfacing must be tougher and have better abrasion resistance than for slurry seal in order to prevent crushing, degradation, and disintegration.
However, ISSA recommends same durability/soundness characteristics for aggregates used in micro-surfacing and slurry seal. The binder is normally a quick traffic, polymer modified, asphalt emulsion conforming to the requirements of ASTM D2397 for CSS-1h (the cement mixing test is waived).
In addition, the asphalt emulsion must have a minimum of 62% residue after distillation using ASTM D244 (14). This indicates that asphalt emulsion used in micro-surfacing should have higher asphalt residue. The emulsion residue has to meet the criteria shown in table 2.9.
Table 2.9 Asphalt Emulsion Specifications for Micro-surfacing Adapted from (ISSA, 2005)
It can be seen from table 2.9 that the asphalt emulsion used for micro-surfacing should be of better quality than for slurry seal. It should be noted that ISSA suggest the same penetration value at 25ºC for asphalt emulsion use in micro-surfacing and slurry seal. The mix design tests recommended by the ISSA for micro-surfacing are presented in table 2.10. As it can be seen from table 2.10, two more tests are recommended for micro-surfacing than for slurry-seal. These two tests are wet track abrasion test for six-day soaked sample and lateral displacement test. The reason for recommending lateral displacement test is because of the application of micro-surfacing for filling ruts. Also, ISSA recommends maximum 538 g/m² to evaluate short-term abrasion properties of mixture (one-hour soak sample), while this maximum limit for wet track abrasion one-hour soaked sample of slurry seal is 807 g/m².
Moreover, mix time for slurry seal mixture is recommended to be at least 180 seconds while this limit for micro-surfacing is 120 seconds. ISSA mix design procedure for micro-surfacing evaluates relative compatibility between the aggregate filler of a specific gradation and emulsified asphalt residue as well. The test recommended for this evaluation for micro-surfacing is ISSA TB 144. This test is not recommended for slurry seal. It should be noted that in ISSA mix design procedure for slurry seal, consistence test have been recommended, while for micro-surfacing, this test is not recommended.
AASHTO TEST METHOD
ASTM TEST
METHOD QUALITY SPECIFICATIONS
TEST ON EMULSION
AASHTO T59 ASTM D-244 Residue after
Distilliation 62% Minimum TEST ON EMULSION RESIDUE
Table 2.10 Mix Design Tests recommended by ISSA for Micro-surfacing Adapted from (ISSA, 2005)
ISSA TEST NO DESCRIPTION SPECIFICATION
ISSA TB 139 (For Quick-Traffic)
Wet Cohesion 30 Minutes (Set) Wet Cohesion 60 Minute
12kg-cm Minimum 20kg-cm Minimum ISSA TB 109
(For Heavy-Traffic)
Excess Asphalt by Loaded Wheel Test
Sand Adhesion 538 g/m² Maximum
ISSA TB 114 Wet Stripping Pass (90% Minimum)
ISSA TB 100 Wet Track Abrasion Lost, One-Hour Soak 538 g/m² Maximum
ISSA TB 100 Wet Track Abrasion Lost, Six-Days Soak 807 g/m² Maximum
ISSA TB 113 Mix Time at 25°C Controllable to 180 second Minimum ISSA TB 147 Lateral Displacement 5% Maximum ISSA TB 144 Classification Test Minimum 11 Points
Other test such as wet stripping test, cohesion test, and loaded wheel test are exactly the same with those recommended for slurry seal by ISSA mix design procedure and follow same limits. Below are the descriptions of two tests, ISSA TB 147 and 144, which are only recommended by ISSA mix design procedure for micro-surfacing.
1) Lateral Displacement Test, ISSA TB 147 (ISSA, 2005)
Multilayer Loaded Wheel test measures the amount of compaction or displacement characteristics of surfacing under simulated rolling traffic compaction. Because micro-surfacing can be used for filling ruts, it should have proper resistance against vertical and lateral deformations under heavy traffic. This test establishes the minimum asphalt emulsion
content necessary to prevent excessive deformation of micro-surfacing mixture. There are three test procedures used to measure the amount of compaction or displacement characteristics of micro-surfacing under simulated rolling traffic compaction.
1. The Loaded Wheel Test (LWT).
2. The Modified British Wheel Tracking Test.
3. The C-LAI/GA.DOT Modified Loaded Wheel Test.
A brief description of each test is presented below:
• The loaded wheel test is described in Section 2.2.1.5. In addition to the regular procedure, the width and height of the specimen are measured (in the wheel path) before and after 1000 cycles of LWT compaction, and the vertical and lateral displacement are calculated. Density (before and after compaction) is also to be calculated. For a design to be acceptable, lateral and vertical deformations must be less than respectively 5 and 10% of original width and thick at mid-length of specimen are not satisfactory for multi-layer applications.
• The modified British wheel tracking test has a long experience in the prediction of pavement rutting performance. This test was originally developed to measure the rate of loaded wheel penetration into compacted hot mixed asphaltic concrete. The wheel tracking test is similar to the LWT. The only difference is that in the loaded wheel test, the wheel moves to and fro in a rocking motion, however, in the wheel tracking test, the table moves to and fro while the wheel remains stationary and there is no rocking motion. The wheel tracking test is run at 45ºC (113ºF) and the load on the wheel is approximately half of that used in the LWT loading, 11.4 kg/cm (63.8 lbs/in) of tire width. For uncompacted mixes, the test is run for 1 hour or 2520 cycles. For pre-compacted samples, the test is run for 45 minutes or 1890 cycles. For a design to be acceptable, lateral and vertical displacements must not exceed 5 and 10% of original width and thick at mid length of specimen.
• The C-LAI/GA.DOT modified loaded wheel test is a modification of the LWT machine to accommodate the larger specimens, and test rutting characteristics of 76.2mm x 76.2mm x 381mm compacted hot mixed asphalt concrete fatigue beams. This test uses a variably pressured air hose between the loading wheel and the test specimen, and is run at a temperature of 105ºF (40.6ºC). The pressure in the hose is 100 ± 2 psi (689.5 kpa ± 13.8 kpa). Rut depth is measured after 1000 cycles of loading. Good correlation between Lai modified LWT laboratory rutting and field rutting potential have been found.
2) Classification Test, ISSA TB 144 (ISSA, 2005)
This test is used to determine the relative compatibility between the aggregate filler of a specific gradation and emulsified asphalt residue (24). As it can be seen from table 2.11 results of test are presented as a grading value, or rating system, for adhesion (in percent coated), abrasion loss (in grams lost), and high temperature cohesion characteristics (absorption in grams absorbed and integrity in percent retained mass). For a design to be acceptable, the mix must achieve 11 grade points minimum (i.e., AAA or AAB).
Table 2.11 Compatibility Classification system suggested by ISSA for Micro-surfacing Adapted from (ISSA, 2005)
Grade Rating each test Point Rating each test Abrason Loss (grams) Adhesion 30 Min Boil (% coated) Integrity 30 min boil (% retained) A 4 0-0.7 90-100 90-100 B 3 0.7-1.0 75-95 75-90 C 2 1.0-1.3 50-75 50-75 D 1 1.3-2.0 10-50 10-50 E 0 > 2.0 0 0
2.3.2 ASTM Design Method for Micro-Surfacing, ASTM D 6372-99a (ASTM, 1999) This guideline and specification is also from the most widely used procedure for the design of micro-surfacing. Similar to ISSA specification, the components of the mix are tested first. Based on this standard, aggregate gradation has to conform to one of the two gradations give in table the 2.12.
Table 2.12 ASTM type II and III for Micro-surfacing Adapted from (ASTM, 1999)
Sieve Size % Passing by weight
in mm Type II Type III
3/8 9.500 100 100 No. 4 4.750 90-100 70-90 No. 8 2.360 65-90 45-70 No. 16 1.180 45-70 28-50 No. 30 0.600 30-50 19-34 No. 50 0.300 18-30 12-25 No. 100 0.150 10-21 7-18 No.200 0.075 5-15 5-15
It should be noted that, ASTM design procedure for micro-surfacing recommend type II and III aggregate gradation while this procedure recommend type I, II, and III aggregate gradation for slurry seal. Also, tolerances are not specified in both ASTM mix design procedures for slurry seal and micro-surfacing.
The mineral filler can be any recognized brand non-air entrained hydrated lime or Portland cement. This filler should be free of lumps and accepted upon visual inspection. Based on this guideline, the asphalt emulsions should be a quick set, polymer modified, asphalt emulsion and have to conform to the requirements of ASTM D 2397for CSS-1h. Aggregates also have to meet the criteria shown in table 2.13.
Table 2.13 Aggregate tests and criteria for micro-surfacing Adapted from (ASTM, 1999)
AASHTO
TEST NO ASTM TEST NO QUALITY SPECIFICATIONS
ASHTO
T-176 ASTM D 2419 Sand equivalent 65 Minimum AASHTO T-104 ASTM C 88 Soundness 15% Maximum using Na₂SO₄ or 25% Maximum Using MgSO₄ AASHTO
T-96 ASTM C 131 Abrasion Resistance 30% Maximum
As it can be seen form Table 2.13, ASTM mix design procedure for micro-surfacing recommend maximum sand equivalent of 65% for aggregates while the recommended amount for slurry seal is a maximum of 45%. This indicates that the aggregates use for micro-surfacing should have less relative proportion of detrimental fine dust or clay-like particles. In other words, ASTM mix design indicates that the quality of micro-surfacing aggregates should be higher than quality of aggregates use for slurry seal. Following are the mix tests recommended by the ISSA procedure for Micro-surfacing (Table 2.14).
Table 2.14 Mix design tests recommended by ASTM for micro-surfacing Adapted from (ASTM, 1999)
ISSA TEST NO DESCRIPTION SPECIFICATION
ISSA TB 139 (For Quick-Traffic)
Wet cohesion 30 Minutes (Set) Wet cohesion 60 Minute
12kg-cm Minimum 20kg-cm Minimum ISSA TB 109
(For Heavy-Traffic) Excess asphalt by loaded wheel test sand adhesion 538 g/m² Maximum ISSA TB 100 wet track abrasion lost, one-hour soak 807 g/m² Maximum ISSA TB 144 Classification test Minimum 11 Points
As it shows from table 2.14, wet track abrasion lost one-hour soak test specimen is same in both ASTM mix design procedures for micro-surfacing and slurry seal. Maximum limit for abrasion loss of one-hour soak specimen for both ASTM slurry seal and micro-surfacing procedures is 807 g/m². ASTM mix design procedure for micro-surfacing recommend cohesion test (ISSA TB 139) to measure set and traffic characteristics of mixture while ASTM mix design procedure for slurry seal recommend set time test and suggest a limitation of less than 12 hours to evaluate set characteristics of mixture. Moreover, ASTM mix design procedure for micro-surfacing recommended two more tests which are excess asphalt by loaded wheel test sand adhesion for high traffic areas and classification test to evaluate relative compatibility between the aggregate filler and emulsified asphalt residue. These tests have not been recommended by ASTM mix design procedure for slurry seal.
2.3.3 TTI Design Method for Micro-surfacing, TTI 1289 (TTI, 2005)
Texas Transportation Institute (TTI) recommended a new mix design procedure for micro-surfacing in early 1994 (TTI, 2005). Following a study on reliability of determining mixture quality of micro-surfacing with the ISSA mix design procedure for micro-surfacing, they developed a new mix design procedure which is somewhat different from ISSA and ASTM mix design procedures. Similar to other ISSA and ASTM procedures, the components of the mix are tested first. The gradations proposed by TTI are shown in table 2.15.
Table 2.15 TTI Type II and III aggregate gradation for Micro-surfacing Adopted from (TTI, 2005)
Sieve Size % Passing by Weight Stockpile
Tolerance,%
In mm Type II Type III
3/8 9.500 100 100 +/- 5 No. 4 4.750 98-100 99-100 +/- 5 No. 8 2.360 75-90 45-65 +/- 5 No. 16 1.180 50-75 25-46 +/- 5 No. 30 0.600 30-50 15-35 +/- 3 No. 50 0.300 18-35 10-25 +/- 3 No. 100 0.150 10-21 7-18 +/- 3 No.200 0.075 5-15 5-15 +/- 2
It should be noted from table 2.15 that the aggregate gradation recommended by TTI design procedure for micro-surfacing is different from the gradations recommended by ISSA and ASTM. These aggregate gradations are finer for sieve sizes 3/8 in to #16 than those used in ASTM and ISSA methods. Aggregates also have to meet the criteria listed in table 2.16.
Also, the mineral filler can be any recognized brand of non-air entrained Portland cement or hydrated lime.
Table 2.16 TTI Aggregates specifications for micro-surfacing Adopted from (TTI, 2005)
AASHTO
TEST NO ASTM TEST NO QUALITY SPECIFICATION
ASHTO
T-176 ASTM D 2419 Sand equivalent 70 Minimum AASHTO T-104 ASTM C 88 Soundness 15% Maximum using Na₂SO₄ or 25% Maximum Using MgSO₄ AASHTO
T-96 ASTM C 131 Abrasion Resistance 30% Maximum
The emulsion should be a cationic, slow setting, polymer modified emulsion which is designated as CSS-1P. Also binder should meet the following criteria as well:
• minimum 3% polymer by weight,
• viscosity, Saybolt Furol at 25ºC (77ºF): 20 to 100 seconds, • storage stability test, one day: 1% maximum,
• particle charge test: positive, • sieve test: 0.1% maximum,
• oil distillate, by volume of emulsion: 0.5% maximum, • residue: 62% minimum,
The different tests for the design procedure are explained in the next section.
1) Estimation of Optimum Binder Content (TTI, 2005)
ASTM D5148-90 test method is used to determine Centrifuge Kerosene Equivalent index (CKE), which is the aggregate particle roughness and surface capacity based on porosity. CKE index is also used to determine the approximate bitumen ratio (ABR) by Hveem mix design procedure. TTI mix design method for micro-surfacing uses the ASTM D5148-90 test method to determine CKE index and ABR. The optimum residual asphalt cement (RAC) content for a given micro-surfacing mixture is ABR plus 2.0% (25). Designer can prepare seven trial mixtures that are mixture with optimum RAC value, with 2.0, 1.0, and +/-0.5% from the optimum RAC value.
2) Mixing Test (TTI, 2005)
Based on ISSA TB 102, mixing time test is used to determine the time required for slurry and recommends that the mixtures should be mixed at room temperature for at least 120 seconds without breaking (ISSA, 2005). After selection of optimum residual asphalt content, designer makes use of trial mixtures with different amounts of amounts (0.5, 1.0, 1.5 and 2.0%) of Portland cement and added water content. TTI mix design procedure recommends that the mixing test be performed at each RAC/cement/water combinations to select minimum required added water content at which the slurry mixture can be mixed at room temperature for at least 120 seconds without breaking. For this, designer has freedom to reduce the water content at 1.0% intervals in order to obtain this minimum water content.
3) Modified Cup Flow Test (TTI, 2005)
Modified cup flow test is used to determine the optimum water content. TTI mix design procedure recommends that the modified cup flow test be performed at each RAC/cement combinations used in the mixing test to select the amount of added water content at which the separation of fluids and solids in mixture is greater than 5mm (0.2 in). The optimum water continent is selected at 2% below this amount of added water content. TTI mix design
procedure also recommend that the optimum added water content obtained from modified cup flow test reported should be greater than the minimum added water content obtained from mixing time test. If it is less, the design is rejected.
4) Modified Cohesion Test, ISSA TB 139
Based on TTI mix design procedure for micro-surfacing, modified cohesion test should be performed at each RAC/water content combination with various amount of Portland cement (0.25, 0.5, 0.75, 1.0, 1.5, 2.0 and 2.5%) to select required amount of Portland cement to obtain a cohesion torque greater than 12 kg-cm at 30 minutes and 20 kg-cm at 60 minutes. Modified cohesion test procedure was described in section 2.2.1.2.
5) Wet-Track Abrasion Loss Test, ISSA TB100
One of the differences between TTI mix design procedure for micro-surfacing and ISSA mix design procedure is about the procedure to select optimum binder content for mixture. In ISSA mix design procedure, the optimum binder content will be selected by evaluating the abrasion loss in the WTAT and the binder content versus pick up from the loaded wheel tester. However, TTI mix design procedure for micro-surfacing recommends only use of wet track abrasion test to select optimum RAC content for mixture. Similar to ISSA TB 100 mix design test procedure, the wet track abrasion test is performed for all RAC/cement/water combinations to select the minimum RAC content at which aggregate loss of sample is less than 807 g/m² (75g/ft²) for 6-day soaked samples (10). Then, the optimum RAC content is determined as minimum RAC content plus 0.5%. This 0.5% is accounted for variability. Wet track abrasion test was described in section 2.2.1.4.
2.3.4 Caltrans Mix Design Method for Slurry Seal and Micro-surfacing (Caltrans, 2004)
California Department of Transportation (Caltrans) developed a single mix design procedure for both slurry seal and micro-surfacing (Caltrans, 2005). The difference between slurry seal and micro-surfacing can be defined in terms of both chemical and performance differences.
Caltrans researchers concluded that for the purpose of mix design, these chemical differences are not relevant. Therefore, Caltrans research team considers that the procedures are the same for both slurry seal and micro-surfacing systems. Similar to other mix design procedures, the components of the mix are tested first. Aggregate gradation, asphalt emulsion and their chemical characteristics has to conform to ISSA specification for slurry seal and micro-surfacing. After the materials have been selected, the proportions of aggregate, water, emulsion, and additives are determined. For this, the German mix test is used to determine the mix and spread indices. German Mix Tester develop a graph from which the numbers for Mix and spread indices can be read. An example of output from the German Mix Test is given in figure 2.5. The mix index is the cohesion when full coating occurs and the mix flows easily, the spread index is the maximum cohesion when mixing is no longer possible, but the mix will spread. These numbers represent the conditions at which the materials can be mixed safely and placed in a timely fashion. These tests will be performed at standard laboratory conditions and repeated for selected mixes for a range of anticipated application conditions. The test data would be evaluated by observing the indices of the mixes noted above as compared to results from ISSA TB 113 (mixing time test) to visually evaluate the coating of the aggregates. German Mix Test would determine the preliminary range of mix proportions.
Figure 2.5 German Mix Test Cohesion Parameters versus Time
Extracted from Slurry/micro-surfacing mix design pooled fund study, California Transportation, Pavement Preservation Compendium, (2006, p. 49)