HAL Id: hal-00835395
https://hal.sorbonne-universite.fr/hal-00835395
Submitted on 18 Jun 2013
HAL is a multi-disciplinary open access
archive for the deposit and dissemination of
sci-entific research documents, whether they are
pub-lished or not. The documents may come from
teaching and research institutions in France or
abroad, or from public or private research centers.
L’archive ouverte pluridisciplinaire HAL, est
destinée au dépôt et à la diffusion de documents
scientifiques de niveau recherche, publiés ou non,
émanant des établissements d’enseignement et de
recherche français ou étrangers, des laboratoires
publics ou privés.
Probe and Pray: Using UPnP for Home Network
Measurements
Lucas Di Cioccio, Renata Teixeira, Martin May, Christian Kreibich
To cite this version:
Lucas Di Cioccio, Renata Teixeira, Martin May, Christian Kreibich. Probe and Pray: Using UPnP
for Home Network Measurements. Passive and Active Measurement, Mar 2012, Vienna, Austria.
pp.96-105, �10.1007/978-3-642-28537-0_10�. �hal-00835395�
Probe and Pray: Using UPnP for Home
Network Measurements
Lucas DiCioccio1,2, Renata Teixeira2,3, Martin May1, and Christian Kreibich4
1
Technicolor
2
UPMC Sorbonne Universites
3 CNRS 4
ICSI
Abstract Network measurement practitioners increasingly focus their interest on understanding and debugging home networks. The Universal Plug and Play (UPnP) technology holds promise as a highly efficient way to collect and leverage measurement data and configuration settings available from UPnP-enabled devices found in home networks. Unfortu-nately, UPnP proves less available and reliable than one would hope. In this paper, we explore the usability of UPnP as a means to measure and characterize home networks. We use data from 120,000 homes, collected with the HomeNet Profiler and Netalyzr troubleshooting suites. Our re-sults show that in the majority of homes we could not collect any UPnP data at all, and when we could, the results were frequently inaccurate or simply wrong. Whenever UPnP-supplied data proved accurate, however, we demonstrate that UPnP provides an array of useful measurement techniques for inferring home network traffic and losses, for identifying home gateway models with configuration or implementation issues, and for obtaining ground truth on access link capacity.
1
Introduction
The network measurement community increasingly focuses attention on mea-suring and characterizing broadband Internet access and home networks. For example, measurements from end-hosts connected to home networks have high-lighted the “buffer bloat” problem of oversized buffers found in a wide range of home gateways, which hurt interactive applications [8]. In addition, a number of measurement efforts infer the speed of residential Internet access networks from different vantage points: servers in the Internet [7], end-hosts connected to home networks [2, 8], or home gateways [9]. Some research groups advocate instrumenting home gateways for measuring both access network performance and properties of home networks, because all traffic between the home network and the Internet traverses the home gateway [3–5, 9]. On the other hand, mea-surement suites such as Netalyzr [8] and Ono [2], which run on the end-hosts, face a lower start-up cost and have demonstrated the potential to reach a large number of homes quickly.
Universal Plug and Play (UPnP) [10] offers great opportunities for home net-work measurement. The UPnP standard provides a suite of protocols for home
network devices to automatically discover one another, retrieve operational pa-rameters, and configure themselves. Hence, a tool running on an end-host con-nected to the home network can directly query the home gateway. For instance, the tool can obtain the manufacturer and the model of the home gateway to then pinpoint devices that suffer from particularly oversized buffers. As another example, end-hosts can obtain the capacity of the access link and the volume of traffic traversing the gateway, which can help explain measured link speeds. De-spite UPnP’s promises, the few measurement studies that have leveraged UPnP to date have focused on only a handful of home gateways [1, 5], and so the gen-eral degree of UPnP adoption and the usability of its implementations has so far remained unclear.
This paper explores the opportunities and pitfalls of using UPnP to measure home networks using data collected with Netalyzr [8] and HomeNet Profiler [6]. Our analysis combines and contrasts end-to-end link capacity and buffer delay measurements with additional information obtained from UPnP queries to local gateway devices (§2). While our dataset covers over 120,000 home networks, we only succeed in obtaining UPnP measurements in around 35% of these homes (§3). Worse, when UPnP implementations do produce responses, they sometimes turn out to be misleading or simply wrong (§4).
When the UPnP responses prove accurate, however, they provide consider-able value. We show how practitioners can leverage the information for a range of interesting measurements and troubleshooting tasks (§5). First, we use the UPnP data to determine the real access link capacity and find that the protocol over-head is about 14% in most home network deployments. Then, we use the data from the UPnP reports together with end-to-end measurements to determine the amount of cross-traffic from the home traversing the gateway. Furthermore, we quantify packet losses occurring in the home and in the wide area network by comparing the end-to-end measurements with the local information available at UPnP-enabled home gateways. Finally, we leverage UPnP-provided information in order to tie measured buffer sizes and other device characteristics to specific gateway models.
We hope that this paper will inspire researchers to include UPnP in their home network measurement testsuites, and to encourage gateway vendors to improve their UPnP implementations.
2
Measurement method
We base our analysis on measurement data collected by the Netalyzr [8] and HomeNet Profiler [6] testsuites. Both run on end-hosts, frequently within a home network, and perform a series of measurements when prompted by the user. This section discusses only the subset of measurements we study in the rest of this paper. To get a common baseline for buffer delays, up/downlink capacities, and round-trip times both tools execute the same code: HomeNet Profiler runs Netalyzr via its command-line API. The main Netalyzr paper [8] presents the details of these measurements. In the following we describe UPnP’s basic
op-eration, and present the UPnP measurements we implemented in Netalyzr and HomeNet Profiler.
UPnP protocol UPnP provides mechanisms for LAN-level discovery and con-trol of a wide range of services specified by the UPnP standards. Discovery employs multicast UDP requests in order to contact peers matching a specific service class, expressed in HTTP header-like plaintext. The responses, if any, contain HTTP URLs via which the client may obtain a device’s full description, expressed in XML. This description contains a list of APIs the client may sub-sequently invoke via the HTTP SOAP protocol. The UPnP standard specifies security levels for the APIs to limit the threat of rogue clients accessing sensitive APIs. We employ only non-sensitive APIs.
UPnP measurements Given our focus on services offered by home gateways, we first discover any ‘WANCommonInterfaceConfig’ services. We then retrieve the device description from responding devices, and collect four non-sensitive gateway configuration parameters: (1) the device model name and version, (2) the device’s WAN interface type (e.g., DSL, Cable), (3) the physical connection rate (e.g., 10 Mbps/1 Mbps), and (4) unidirectional byte/packet counters main-tained by the gateway. To test the accuracy of these counters, we retrieve them immediately before and after sending known-size packet trains to a server in the Internet. HomeNet Profiler’s train consists of 20 ICMP pings over 10 seconds, Netalyzr’s of UDP bursts making up its bandwidth test. Comparing the actual before/after counters to the expected values allows us to gauge cross-traffic. HomeNet Profiler also obtains traffic counters from the local system to account for other cross-traffic from the local host.
In addition to the client-side measurements, both Netalyzr’s and HomeNet Profiler’s servers log the client’s AS number and geographical location based on the public IP address that reports the measurements. Both tools include a survey that explicitly asks users whether they ran the tests from their home. We use this information to identify runs from home networks as opposed to tests conducted from public or office networks. When users did not complete the survey, we apply a heuristic to detect home networks: we first identify all ASes belonging to home access providers (for details, see our technical report [6]). Our analysis considers only a single run from each home network.
3
Dataset
We employ three datasets, summarized in Table 1. The HomeNet Profiler dataset (“HNP”) included UPnP measurements from the beginning. Netalyzr added UPnP measurement incrementally. The first version with UPnP, which we call “Netalyzr-1,” performed only the device identification. More recent versions, “Netalyzr-2,” implement all UPnP measurements discussed in Section 2.
The table indicates that we only obtain UPnP measurements in 35% of all homes. An explanation for the differences in the fraction of homes with UPnP
Dataset Start date End date Homes UPnP Countries ASes HNP 4/4/2011 12/15/2011 2209 54% 43 208 Netalyzr-1 3/23/2011 8/29/2011 95417 22% 131 1373 Netalyzr-2 8/30/2011 12/15/2011 30243 47% 114 949 Table 1. Dataset description (UPnP refers to the percent of homes with UPnP gate-ways)
gateway may come from the population bias of each dataset. HNP is biased towards France, Netalyzr-2 towards Germany, whereas Netalyzr-1 is more bal-anced. This value does not necessarily mean that the home gateways do not implement UPnP. We identify three possible reasons for failing UPnP measure-ments, which we cannot distinguish in the data: (1) some gateways do not ac-tually implement UPnP; (2) others implement it, but keep UPnP disabled by default; (3) host-level firewalling prevents the end-host from issuing UPnP’s mul-ticast discovery query [6] or seeing the responses. The rest of this paper analyzes the homes in which at least one gateway responded to the service discovery query. We first discuss measurements artifacts and how we eliminate them from our dataset, then we present the results with the rest of the data.
4
Measurement artifacts
When the client manages to receive UPnP responses, the reported values may still be misleading or simply wrong. This section discusses the issues we encoun-tered in practice and explains how we clean the dataset from these measurement artifacts. We first discuss the challenge of interpreting UPnP data correctly without additional information about the home network configuration. Then, we report UPnP specification and implementation problems.
4.1 Misleading home network configurations
Gateways connected over Ethernet We find 10% of homes with UPnP where the gateway reports Ethernet WAN connectivity. While some homes might connect to the Internet via Ethernet, only few ISPs offer this kind of service. In fact, the top ISPs with gateways that reported Ethernet connectivity in our measure-ments were Vodafone, Verizon, and Comcast, which do not provide this type of connectivity. We thus believe that most of these cases correspond to homes where the UPnP gateway connects to a modem via Ethernet and the modem connects to the ISP. The reported synchronization rate is then the speed of the Ethernet link between modem and UPnP gateway (e.g., 100 Mbps), which does not reflect the access link speed. When comparing UPnP link speeds with mea-sured link capacity, we therefore eliminate all cases where the gateway claims Ethernet connectivity.
Homes with more than one UPnP gateway We detect that 3% of the homes with UPnP have more than one UPnP gateway in Netalyzr-2 and 4% homes in HNP. Such configurations occur in large homes, where it becomes necessary to install multiple access points to cover the entire place. In these deployments, the pri-mary gateway connects to the access link and the others connect to this pripri-mary gateway via Ethernet. Since our data cannot reveal the actual primary gateway, we remove these homes from the rest of the analysis. In Netalyzr-1, we only have UPnP queries to the first device that responded as a gateway. Hence, Netalyzr-1 may contain outliers. Given the number of homes with multiple gateways is small, this artifact should not bias our results.
4.2 UPnP design and implementation issues
Inconsistent UPnP discovery HomeNet Profiler uses two distinct queries to dis-cover UPnP services: one query searches explicitly for gateways (as described in §2), the other queries for any UPnP service with a wildcard option. We compare the number of UPnP gateways found by these two queries as a sanity check. Among the 2186 homes with both measurements, the two queries agree in 85% of the homes; in 14% of the homes, the gateway only answers to the specific search, and in 1% of the homes the gateway only answers the wildcard search. We found no correlation between the gateway model or the ISP and these incon-sistent responses, so if the differences stem from implementation errors, these problems only manifest rarely. Lost query packets could likewise offer an expla-nation for the differences. In the rest of the paper, we only analyze data from devices we discovered via explicit requests for gateway devices.
Incomplete identifiers UPnP provides two fields to identify devices: name and model. In practice, these fields are not always specified. In some cases, we only get the device name, but not the model. In others, the device name has the UPnP profile name or a vague description such as “Wireless Router” and not the device name.
Inaccurate connection type We find 25% of homes in the French ISP SFR where the gateway reports Cable connectivity. This ISP does not offer cable Internet. In addition, the same homes all report a symmetric synchronization rate of 4.2 Mbps, which the ISP does not actually offer. We conjecture that some SFR’s gateways have a hardcoded UPnP configuration. We find a similar configuration in other models but at a lower frequency.
Inaccurate synchronization rates We identified three cases of access link synchro-nization rates reported inaccurately. First, in 1% of homes, the synchrosynchro-nization rate is reported in wrong units. The gateway reports a synchronization rate lower than 64 Kbps, even for ADSL or Cable users. Given the values, we believe that these UPnP implementations report values in Kilobits/s or KiloBytes/s, instead of bits per second (as specified in UPnP specification). This problem af-fects 30 models by three distinct vendors. Second, in 7% of homes, the gateway
reports a synchronization rate of zero in both directions, which clearly cannot be the case given we could contact servers outside the home. Most of these in-accurate values occurred with Sagem and Fritzbox gateways. Finally, some ISPs configure the gateway to report a hardcoded synchronization rate, which often corresponds to the rate the ISP advertises commercially and not the rate nego-tiated between the modem and the DSLAM or CMTS. In particular, almost all customers of the French ISP Free have the exact same synchronization rate.
Inaccurate traffic counters The UPnP gateway does not respond to the traffic counter queries in 22% of the homes of Netalyzr-2 and HNP datasets. In 3% homes, UPnP gateways answer the query for traffic counters, but always report the exact same value.
We remove all inaccurate reports (on connection types, synchronization rates, and traffic counters) from the relevant analysis in the rest of this paper.
5
Analysis
This section illustrates four practical examples where UPnP queries help enhance end-host based measurements.
5.1 UPnP link capacity versus measured capacity
We compare the upload and download capacities measured by Netalyzr with the capacity reported by UPnP. Figure 1(a) presents the measured upload rates versus the reported upload rates per home. Most points in this figure fall on a straight line with slope 0.86 and zero intercept (72% of the points are within a 5% interval). This linear relationship comes from the protocol overhead of PPP encapsulation. This result means that UPnP reports the raw rates, whereas Netalzyr measures IP rates. We observe a cluster of points with upload rates around 1.2 Mbps, which is a common commercial uplink limitation. Measured upload rates are consistently close to the 0.86 line, which indicates that the uplink is the bottleneck in the end-to-end path and that there is little cross-traffic from the home competing for uplink bandwidth.
Figure 1(b) compares the measured download rates with the download rates UPnP reports per home. Again, we see few points above the Y = 0.86X line, indicating the same overhead as for uploads, and clustering along the line. How-ever, download rates exhibit more variance than upload rates. In general, most Internet applications (such as web surfing or media streaming) consume more downlink than uplink bandwidth. The higher variance in the downstream di-rection thus suggests that cross-traffic may affect downstream bandwidth mea-surement accuracy more than in the upstream direction, despite upstreams fre-quently possessing smaller available bandwidths. This result reaffirms previous measurements of residential broadband Internet access in the United States [9].
UPnP capacity (logscale)
Measured capacity (logscale)
200k 500k 2M 5M 100k 500k 2M Y=0.86 X (a) upload
UPnP capacity (logscale)
Measured capacity (logscale)
500k 2M 5M 20M 50M 50k 500k 5M 20M Y=0.86 X (b) download
Figure 1. UPnP reported capacities versus active capacity measurements (This figure presents results for 1,084 homes in HNP, Netalyzr-1, and Netalyzr-2)
5.2 Inferring cross traffic
1e−04 1e−02 1e+00 1e+02
1e−05
1e−03
1e−01
1e+01
1e+03
Normalized UPnP counters
Nor
maliz
ed end−host counters
Y=X
Figure 2. Access link uplink usage from the localhost and at the gateway (This figure presents results for 461 homes in HNP)
A measurement tool running on an end-host inside the home can estimate the cross traffic from other hosts connected to the home network by querying the gate-way’s UPnP traffic counters. We study traffic counters in the HNP dataset, be-cause it logs both UPnP counters and traffic counters in the local host. In this dataset, we obtain realistic traffic counter measurements in a total of 461 homes. Homes in the dataset have different ac-cess link capacities, so to compare re-sults across homes we normalize the num-ber of bytes observed by the gateway (computed from UPnP counters) by Net-alyzr’s measured uplink capacity; we per-form the same normalization to the num-ber of bytes sent by the local host.
Figure 2 plots the normalized traffic observed at the gateway on the x-axis versus the normalized traffic sent by the host in the y-axis. When x=y, the gateway and the host observe the same traffic, which implies that there is no other traffic in the home network or to the Internet. For points below the diagonal line, the gateway saw more traffic than the end-host, which indicates that other devices in the home network were sending traffic to the Internet. For points above this line, the host was sending traffic to other local destinations (note that the
UPnP counter only reports traffic to and from the WAN interface). This plot shows that in most of the homes there was mainly local traffic (from the host to other devices in the home) during our measurements. This case accounts for 53% of the points in Figure 2, whereas the case with cross-traffic from other devices to the Internet represents 38% of points. It may seem surprising to have more traffic to the local network than the Internet. This result is just an artifact of our measurement methodology. When users run HomeNet Profiler or Netalyzr, they often just wait for the results instead of running other Internet applications on the side. In this scenario, the background traffic in the home network (of protocols such as DHCP) composes most of the cross-traffic. In fact, the volume of local cross-traffic is less than 18 KB in 90% of HomeNet Profiler’s test.
5.3 Quantifying loss in the home vs. the wide area
The UPnP traffic counters also prove useful for distinguishing packet loss in the home network from that in the wide area, a use case often mentioned by proponents of gateway-driven measurements. We can conduct the same mea-surement with a passive UPnP-enabled gateway by extending Netalyzr’s band-width test, as follows. The test consists of UDP packet roundtrips from the client to Netalyzr’s servers and back. Small upstream packets with large downstream responses measure downstream bandwidth and vice versa. The measurement records the number of packets sent by the client (Pc), received by the server
(Ps), and responses received back at the client (Pc0). The packet counters
pro-vided by UPnP gateways (Pg) add an extra loss tracking point, which allows
locating dominant loss directionally: for the uplink, Pc Pg∼ Psindicates loss
in the home, while Pc ∼ Pg Ps reflects loss in the wide area. The downlink
follows analogously. This inference could misreport if the local network drops packets while traffic from another home device to the Internet increments the UPnP counters. To avoid false identification, we only consider cases with at least 5% packet loss.
WAN No loss Loss LAN No loss 2 % 48 % Loss 28 % 22 %
Table 2. Location of losses (This ta-ble presents results for 6,887 homes in Netalyzr-2)
Table 2 breaks down the location of packets losses in Netalyzr-2. We have correct traffic counter measurements for 11508 homes. We keep 6887 homes for which UPnP traffic counters report cross-traffic less than 10% of the estimated up-link capacity. There was no loss in only 2% of tests. This result is expected because Netalyzr’s capacity test sends a high rate
of packets to fill the pipe, which induces loss. In 47% of tests, losses occur in the wide-area (possibly at the access link, but we cannot pinpoint where in the wide-area exactly). In total, we observe losses in the home network in 28% of tests. It is expected that well provisioned local networks will have less losses. In our future work, we will study whether these losses correlate with wireless home networks.
5.4 Buffer sizes
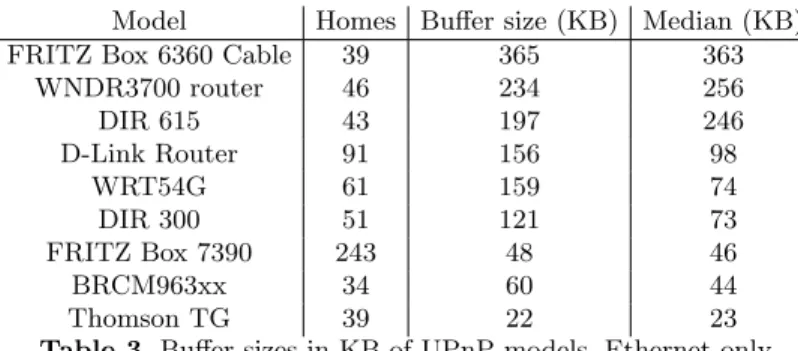
The effects of over-sized buffers, so-called “buffer bloat”, have recently received renewed attention by our community. Common wisdom holds that most end-to-end buffering occurs at the gateway, but many different places could introduce buffering, for example the operating system on the end host; wireless access points; or other equipment in the access link. We use UPnP’s gateway model information together with Netalyzr’s upload capacity and RTT-under-load mea-surements to infer the buffer sizes of individual gateway models. To avoid any bias in our inferences because of buffering happening on the wireless link, we only conduct this analysis for homes where our measurements run over a wired link. For each home, we infer the amount of buffering from the RTT under load and the measured upload capacity. We then plot the probability density function of these buffering values for all homes with a given gateway model. We take the point of highest density in this plot as the inferred buffer size for this gateway model. In most cases, we see one clear spike in the density function. The con-sistency of the gateway buffer measurements for all homes with a given model confirms that most current gateways have a fixed buffer size, irrespective of the uplink capacity. Ideally, the buffer size should be proportional to the uplink capacity, which determines the buffer draining rate.
Model Homes Buffer size (KB) Median (KB) FRITZ Box 6360 Cable 39 365 363
WNDR3700 router 46 234 256 DIR 615 43 197 246 D-Link Router 91 156 98 WRT54G 61 159 74 DIR 300 51 121 73 FRITZ Box 7390 243 48 46 BRCM963xx 34 60 44 Thomson TG 39 22 23 Table 3. Buffer sizes in KB of UPnP models, Ethernet only
Table 3 presents the inferred buffer sizes and the median buffering values for gateway models that appeared in at least 30 homes. For conciseness, we only present one model per vendor if several models from the same vendor have similar buffer sizes (for example, other models of Fritzbox have similar buffer sizes to the Fritzbox 7390). Buffer sizes vary from 22 to 365 KB. For a typical uplink rate of 1.2 Mbps, any buffer larger than 150 KB will introduce more than one second delay under load, which is prohibitively large for interactive applications. This delay would increase to 2.3 seconds for a 512 Kbps uplink.
6
Conclusion
This paper showed the potential of UPnP as a tool to complement end-host measurements in home networks. UPnP queries can determine the ground-truth
access link capacity, pinpoint cross-traffic from the home network, differentiate local from wide-area losses, and identify gateway characteristics per model (as we did for the buffer size). The caveat is that in the majority of homes we measured the end-host could not find an UPnP gateway. To make matters worse, when we were able to find an UPnP gateway, the responses were sometimes hard to interpret and other times simply wrong. Our hope is that as UPnP starts getting used in practice, gateway vendors will enable UPnP by default and improve their implementation. Given that UPnP standards are still evolving, there is an opportunity for the measurement community to influence the standards and determine what future gateways should report to assist in analysis and diagnosis. Acknowledgements. This work was supported by the Agence National de la Recherche grant C’MON and by the European Community’s Seventh Frame-work Programme (FP7/2007-2013) no. 258378 (FIGARO). We thank Amazon for supporting our EC2 deployment and acknowledge support by the National Science Foundation under grant NSF CNS-0905631, with additional support from Google and Comcast.
References
1. B. Aggarwal, R. Bhagwan, T. Das, S. Eswaran, V. N. Padmanabhan, and G. M. Voelker. NetPrints: Diagnosing Home Network Misconfigurations Using Shared Knowledge. In Proc. NSDI, Apr 2009.
2. Z. S. Bischof, J. S. Otto, M. A. Sanchez, J. P. Rula, D. R. Choffnes, and F. E. Bustamante. Crowdsourcing ISP Characterization to The Network Edge. In ACM SIGCOMM Workshop on Measurements Up the Stack, 2011.
3. K. L. Calvert, W. K. Edwards, N. Feamster, R. E. Grinter, Y. Deng, and X. Zhou. Instrumenting Home Networks. In ACM SIGCOMM Workshop on Home Networks, Aug 2010.
4. M. Chetty, D. Halsem, A. Baird, U. Ofoha, B. Summer, and R. E. Grinter. Why Is My Internet Slow?: Making Network Speeds Visible. In Proc. ACM CHI, May 2011.
5. L. DiCioccio, R. Teixeira, and C. Rosenberg. Impact of Home Networks on End-to-End Performance: Controlled Experiments. In ACM SIGCOMM Workshop on Home Networks, Aug 2010.
6. L. DiCioccio, R. Teixeira, and C. Rosenberg. Characterizing Home Networks With HomeNet Profiler. Technical Report CP-PRL-2011-09-0001, Technicolor, Sep 2011. 7. M. Dischinger, A. Haeberlen, K. P. Gummadi, and S. Saroiu. Characterizing
Res-idential Broadband Networks. In Proc. IMC, Oct 2007.
8. C. Kreibich, N. Weaver, B. Nechaev, and V. Paxson. Netalyzr: Illuminating the Edge Network. In Proc. IMC, Oct 2010.
9. S. Sundaresan, W. de Donato, N. Feamster, R. Teixeira, S. Crawford, and A. Pescap`e. Broadband Internet Performance: A View From the Gateway. In Proc. ACM SIGCOMM, Aug 2011.