HAL Id: hal-01415620
https://hal.archives-ouvertes.fr/hal-01415620
Submitted on 6 Mar 2017HAL is a multi-disciplinary open access
archive for the deposit and dissemination of sci-entific research documents, whether they are pub-lished or not. The documents may come from teaching and research institutions in France or abroad, or from public or private research centers.
L’archive ouverte pluridisciplinaire HAL, est destinée au dépôt et à la diffusion de documents scientifiques de niveau recherche, publiés ou non, émanant des établissements d’enseignement et de recherche français ou étrangers, des laboratoires publics ou privés.
Distributed under a Creative Commons Attribution| 4.0 International License
Interferometry: the example of the Eiffel Tower
Flora Weissgerber, Jean-Marie Nicolas
To cite this version:
Flora Weissgerber, Jean-Marie Nicolas. Joint measurement of height and deformation by radar Inter-ferometry: the example of the Eiffel Tower. ONERA-DLR Aerospace Symposium, Jun 2016, Oberp-faffenhofen, Germany. �hal-01415620�
Propriété de l’ONERA - Reproduction, communication, utilisation même partielles interdites sans accord écrit préalable
TITLE: Fusion of SAR images for urban monitoring : the Eiffel Tower case NAME & First name of main author: WEISSGERBER Flora
NAME & First name of co-authors: NICOLAS Jean-Marie Address (Department/Institute):
Flora Weissgerber : ONERA
Jean-Marie Nicolas : LTCI, CNRS, Télécom ParisTech, Université Paris-Saclay, 75013, Paris, France E-mail address of main author: flora.weissgerber@telecom-paristech.fr
Phone number of main author: +33687474655 Date of birth of all authors:
Flora Weissgerber : 07/09/1990 Jean-Marie Nicolas : 02/01/1954
Joint measurement of height and deformation by radar
Interferometry: the example of the Eiffel Tower.
1 INTRODUCTION; INTERFEROMETRY FOR 3D AND DINSAR IN URBAN AREAS
In radar imaging, across-track interferometry is a mode in which the signals acquired by two slightly spatially separated antennas are combined in phase, to deduce information about the elevation of the scatterers of the image, or on their displacement. Classic across track interferometry is designed to measure heights or elevation. It is a way in which we exploit the phase difference related to the separation of the antennas in the direction perpendicular to the line of sight.
Differential interferometry exploits the phase difference simply related to a possible shift of scatterers in the radial direction, between two acquisitions.
Across-track interferometry can be made in a single-pass or repeat-pass mode. In the latter case, it is possible to use the successive passages of a satellite, for computing elevation maps, as shown in [1]. However, this method generates the temporal decorrelation phenomenon, which can make it ineffective on certain types targets. This phenomenon increases with the frequency.
On the other hand, recently, several papers have shown that it is still possible to exploit the phase of the interferogram using successive passes of TerraSAR-X on some types of scenes, including urban areas, where permanent scatterers are less sensitive to the decorrelation. [1], [2]
Even with a time interval of several years, the information contained in the phase.remains. Also, it is conceivable to use the repeat-pass mode in order to evaluate the height of buildings. This has been particularly shown on images taken over Paris by TerraSAR-X, on the Eiffel Tower.
2 WHAT IS NEW AT X-BAND IN REPEAT-PASS INTERFEROMETRY ?
The use of X-band is particularly interesting for urban areas because it enables to obtain high resolution maps, in areas where penetration properties of the electromagnetic wave are not required [3]. TerraSAR-X thus offers space-based observation capabilities that were previously unavailable.
Propriété de l’ONERA - Reproduction, communication, utilisation même partielles interdites sans accord écrit préalable
2.1 WHAT IS NEW FOR 3D AT X-BAND.
At X-band, temporal decorrelation is particularly high in repeat-pass interferometry. However, we have noticed that most of the buildings are still coherent and then it is possible to estimate their elevation trough the interferometric phase.
Figure 1 – repeat-pass interferogram on the left, and single-pass interferogram on the right (Tandem data)- HSV coding : Intensity = signal power, Hue :interferometric phase Saturation : coherence level
On measures elevation of isolated buildings, the interest of a high-resolution repeat-pass data has been for example also illustrated by the DLR on the Eiffel Tower, by finding a measure of height of 300m. However,
- It is impossible to estimate the associated ground elevation, as signals of the ground surface are completely uncorrelated, even after only 11 days.
- A detailed analysis of several pairs of images and other attempts of elevation estimation led to completely false results for this structure!
A priori, we have found that this should be due to deformation of the Eiffel Tower between two acquisitions.
In summary, elevation measurement through repeat-pass interferometry suffers from two drawbacks: - As soon as the measured object is deformed, if only a few millimeters, the height
measurement becomes false.
- It is impossible to estimate the ground elevation.
2.2 WHAT IS NEW IN DINSAR AT X-BAND ?
The term connected to the deformation being proportional to the wavelength, this band allows particularly fine motion estimation [4].
However, in order to deduce the deformation, we have to compensate first for the other contributions to the interferometric phase:
- The term proportional to the elevation of the object, and inversely proportional to the perpendicular baseline;
- Terms related to the propagation of the wave in the atmosphere; - a thermal noise term.
Propriété de l’ONERA - Reproduction, communication, utilisation même partielles interdites sans accord écrit préalable
A numerical study showed that the phase terms related to the deformations !!
! !!
and those related to elevation !!! with k! = !"
!!!, and h!!=
!"
!!! sin !, have comparable magnitudes. It
is therefore necessary to compensate accurately the elevation of the object before the deformation estimation, and vice versa: it is necessary to compensate the deformation before the elevation estimation. These two terms are illustrated here:
2.3 A PROPOSITION OF A NEW PRODUCT: ESTIMATION OF THE DEFORMATION IN 3D SPACE
Repeat-pass interferometry suffers from many difficulties in urban area for 3D elevation: - Temporal decorrelation
- Necessity to compensate exactly potential deformations, in some configurations with a millimetric precision.
On the other hand, repeat pass interferometry allows measuring the deformation of the scatterers provided the elevation is known. Therefore, we propose here to obtain a map of deformation for all scatterers in three dimensions, by the fusion of a Tandem image and a high resolution image acquired at a different date. The two companion satellite TanDEM-X and TerraSAR-X are able to acquire single-pass interferometric data, in order to produce numerical elevation models, by avoiding any temporal decorrelation and deformation of the targets. Then, it is possible to compensate for this elevation in the repeat-pass interferometric product to measure the deformation.
The different steps are the following ones:
- A repeat-pass interferometric product is processed
- The interferometric phase Φ is unwrapped, then transformed into an elevation (m), by taking into account the geometric acquisition parameters:
§ ! = ΔΦ!"#"$%!!"##/!! !"#"$%!!"##
- The Tandem-X images are reconstructed first at the same sampling rate than the High Resolution image. After this step, we also measure:
Propriété de l’ONERA - Reproduction, communication, utilisation même partielles interdites sans accord écrit préalable
Then the map of ℎ!!!" is pixelwise coregistered with the z image. - We compute the phase for all pixels:
Φ!"##$!%$& = !! !"#"$%!!"##(! − ℎ!!!") This term contain the deformation according to:
!!= ! 4!Φ!"##$!%$& To sum up: !!= ! 4!!! !"#"$%!!"##(ΔΦ!"#"$%!!"##/!! !"#"$%!!"##− ΔΦ!"#$%&! !"##/!! !"#$%&! !"##)
3 PROTOCOL OF VALIDATION ON THE EIFFEL TOWER
3.1 THE DEFORMATION OF THE EIFFEL TOWER
The tower is subjected to deformation depending on weather conditions, mainly because of three factors:
• The sunlight. The tower may also lean to one side under the influence of sunlight. The sunlight heats one side of the tower and it expands, tilting the tower. Here again, the magnitude of the movement is never more than eight to twelve centimeters. This is a tilt, not a sway, and the tower remains tilted until the sun goes down. It follows a very regular pattern throughout the day, if the sun is shining.
• Thermal expansion. Depending on the temperature, the tower can elongate or shrink several centimeters.
• The wind. This tower moves in the wind. On days with high, gusting winds, the wind can reach speeds in excess of 160 km/h at the summit of the tower. The magnitude of the sway in the tower, under worst-case conditions, does not exceed 15 cm. There is no danger of the tower being damaged by wind-induced movement since it has been designed by Gustave Eiffel to withstand movements easily five times beyond those produced by the highest winds ever recorded.
Propriété de l’ONERA - Reproduction, communication, utilisation même partielles interdites sans accord écrit préalable
We have considered a data set of TSX images constituted by:
- 100 Spotlight High resolution TSX images, acquired between 2009 and 2012.
- 2 couples of Stripmap Tandem PolInSAR images, with a 2mx2m resolution, acquired in 2015, December.
The couple is in interferometric conditions with the previous temporal stack. These are the first full polarimetric images acquired over Paris!
- Five spotlight high resolution acquisitions PolSAR called Double Dual-Pol images: the master satellite acquired the co-pol channel while the slave satellite acquired the cross-pol channel, leading to quad-pol images with a 1m x2m resolution. These are experimental data acquired by DLR on following dates: 2015-11-04, 2015-11-15, 2015-12-29, 2016-01-09 and 2016-01-20.
3.3 THE TRIHEDRAL CORNERS
Several trihedral corner reflectors were installed on 28 December 2015 (the day before the third acquisition) with the help of SETE, the company that operates the Eiffel Tower. These corners are stable reference points that will be used as a benchmark to measure heights and possible expansions.
• Two of them have been installed for the duration of the experiment on the Eiffel Tower • Two other were installed on the Iena Bridge before each acquisition.
Propriété de l’ONERA - Reproduction, communication, utilisation même partielles interdites sans accord écrit préalable
Figure 3 – one trihedral corner put on the Iena Bridge
Figure 4- Picture of trihedral corner C2 put on the roof of the Restaurant Jules Vernes
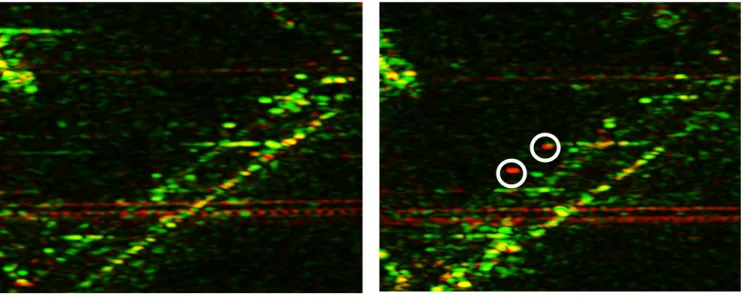
A color composition was made to highlight the presence of the corners. In the chosen composition, the corner appears in red, as on the bridge of Iena, represented in Figure 6. Other bright scatterers on the bridge in green correspond to street lamps. The detection of the corners placed on the second floor of the tower is more difficult. Only the presence of one of them was detected. It is indicated by the white arrows in Figure 7. But this result remains to be confirmed.
Propriété de l’ONERA - Reproduction, communication, utilisation même partielles interdites sans accord écrit préalable
Date 2 Date 4
Figure 5- Corner detection on Iéna Bridge
Date 1 Date 3
Date 2 Date 4
Figure 6- Corner detection on the tower
Colored composition – Green Channel :double-bounce signals and oriented elements Red Channel :odd bounce power HH+VV
Propriété de l’ONERA - Reproduction, communication, utilisation même partielles interdites sans accord écrit préalable
3.4 COLLECTING GROUND TRUTH
Considerable emphasis was also placed on the collection of ground truth in order to validate our fusion process and the precision of the deformation measurement [5]:
- Meteorological data were collected in weather archives, at the dates of acquisitions by Telecom Paris Tech during the internship of Elise Nkassa. These data enables to check the correlation of our measurement with one of the known sources of deformation: thermal vertical dilatation.
- Optical strands are installed on the Eiffel Tower by the company OSMOS. OSMOS uses a unique technology - the Optical Strand. Positioned where phenomena occur, it has a unique capacity for collecting data and is accurate down to the nearest micron. The OSMOS process, based on the principle of the modulation of light intensity by measuring analog attenuation, ensures the instantaneous response of the sensor. For over 20 years, OSMOS has monitored the stability of the main structural elements of the Eiffel Tower. Preventive monitoring using optical strands allows managers to confirm the stability of the structure and address the technical management constraints of this type of monument.
A collaboration with OSMOS has been established in order to discuss with them the degree of confidence of our results.
4 FIRST RESULTS AND PERSPECTIVES
First deformation results were obtained considering only a linear deformation throughout the second floor using the official ℎ!!!" of the Eiffel Tower. The order of magnitude of measured deformation was the centimeter which is in agreement with the knowledge of the deformation. Moreover, these results were correlated to the temperature as shown on Figure 7.
Propriété de l’ONERA - Reproduction, communication, utilisation même partielles interdites sans accord écrit préalable
acquisition of the Tandem data using a fine 3D model of the tower projected in the (range-azimuth) plane of the SAR image. This 3D model correspond to ℎ!!!" as described in the fusion process. This process is illustrated on Fig 7.
Figure 8- left to right - a repeat-pass interferogram, and its height after conversion - in the middle: the 3D model of the tower - His conversion height in the HR spotlight spatial reference plane. Right: residual phase (in radians) connected to the expansion
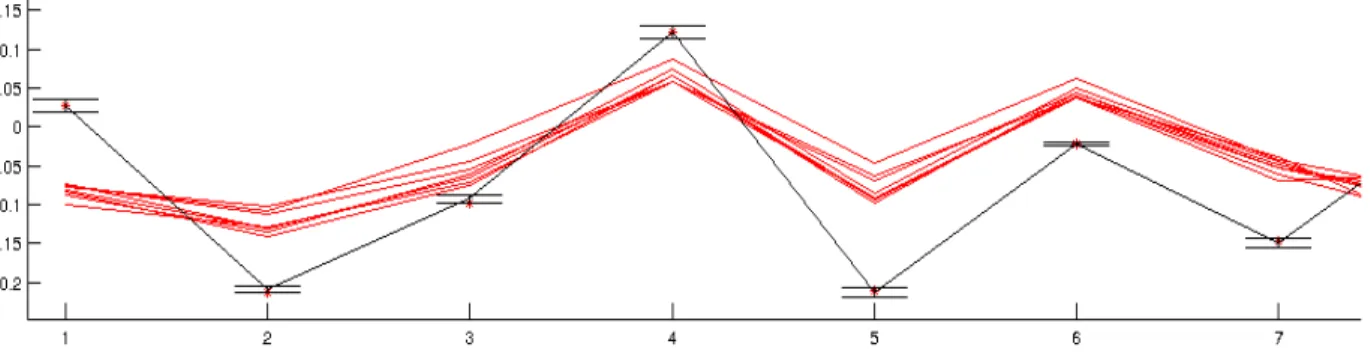
The mean linear expansion of the tower was compared to optical strand measurement for several interferograms. The trends were the same even if the magnitude of the deformation is not retrieved.
Figure 9 - Comparisons of SAR expansion measures (black) to Osmos data (red curves) for 7 interferometric couples. Ordinates: linear expansion in mm / m
These data are being analyzed; it is felt particularly that other effects, including atmospheric ones, could explain the fact that the deformations are not solely due to thermal expansion.
5 REFERENCES
[1] Bamler, R., Eineder, M., Adam, N., Zhu, X., & Gernhardt, S. (2009). Interferometric potential of high resolution spaceborne SAR. Photogrammetrie-Fernerkundung-Geoinformation, 2009(5), 407-419.
[2] Koeniguer, E, PolSARAP: Investigating the Benefits of Polarimetry for Urban Applications using X-Band SAR Images, POLINSAR 2013 WOrkshop
Propriété de l’ONERA - Reproduction, communication, utilisation même partielles interdites sans accord écrit préalable
[3] Gernhardt, S., Adam, N., Eineder, M., & Bamler, R. (2010). Potential of Very High Resolution SAR for Persistent Scatterer interferometry in urban areas.Annals of GIS, 16(2), 103-111. [4] Guillaume Quin and Philippe Loreaux, Submillimeter accuracy of multipass corner reflector
monitoring by PS technique. IEEE Transactions on Geoscience and Remote Sensing, 2013(3), 1775-1783
[5] Flora Weissgerber, Jean-Marie Nicolas, Elise Colin-Koeniguer et Nicolas Trouvé. « Mesure de la dilatation thermique de la Tour Eiffel par interférométrie RSO différentielle ». Gretsi 2015, Lyon