This is an author-deposited version published in:
http://oatao.univ-toulouse.fr/
Eprints ID: 11890
To link to this article: DOI: 10.1260/1756-8293.5.3.193
URL: http://dx.doi.org/10.1260/1756-8293.5.3.193
To cite this version:
Liu, Zhen and Dong, Longlei and Moschetta,
Jean-Marc and Zhao, Jianping and Yan, Guirong Evaluation of nano-scale
rotors and motors at static condition. (2013) International Journal of
Micro Air Vehicles, vol. 5 (n° 3). pp. 193-206. ISSN 1756-8293
O
pen
A
rchive
T
oulouse
A
rchive
O
uverte (
OATAO
)
OATAO is an open access repository that collects the work of Toulouse researchers and
makes it freely available over the web where possible.
Any correspondence concerning this service should be sent to the repository
administrator: [email protected]
Evaluation of Nano-scale rotors and
motors at static condition
Zhen Liu1a, Longlei Dong1b, Jean-Marc Moschetta2c, Jianping Zhao1d
and Guirong Yan1e
1Xi’an Jiaotong University, Xi’an, 710049, China
2Institut Supérieur de l’Aéronautique et de l’Espace, University of Toulouse,
Toulouse 31400, France
ABSTRACT
The static performance of nano-scale rotor and the mechanical efficiency of micro rotors are important factors to evaluate rotary-wing NAVs. In this paper, two pairs of nano-scale rotors, which were formed with the same airfoil section for each pair, were compared to find the influence of chord distribution and twist distribution to rotor performance. A test bench was designed with highly sensitive mechanism systems in order to be able to measure the thrust and torque of rotors accurately. The static performance of nano-scale rotors was evaluated experimentally with the test bench at ultra-low Re. And computations based on 3D unsteady incompressible Navier-Stokes solver with artificial compressibility were carried out as well to obtain the detailed flow field of nano rotor. It was found that the rotor figure of merit degraded a lot with size reduction. And the rotor solidity determined by chord distribution has a positive effect on the rotor thrust coefficient while pitch angle distribution influences the power coefficient. Flow field analysis indicated that the state of leading edge vortex might be the inherent reason of the difference of performance between rotors. The mechanical efficiency of several small motors were also compared which showed that the performance of small rotors decline with the reduction of size.
NOMENCLATURE A disk area of rotor, m2
CT rotor thrust coefficient [T/(1/2ρAΩ2 R2)]
CP rotor power coefficient [Q/(1/2ρAΩ2 R3)]
FM figure of merit of rotor η motor efficiency
Q torque of rotor R radius of rotor
ρ freestream fluid density
σ blade solidity [ ]
T thrust of rotor Ω rotational velocity 1. INTRODUCTION
Micro Air Vehicles (MAVs) have emerged dramatically [1-5] with the desire on the military and civilian applications over the past decades. The conception of even smaller unnamed air vehicles of dimension less than 7.5cm, called Nano Air Vehicles [6] (NAVs) proposed by DARPA in 2005, has attracted more attention in recent years. NAVs are required to fulfil missions in complex and cluttered environments [7-9] with a hovering capacity enabling the timely collection of comprehensive
π
N cb / ( R)
aLecturer, State Key Laboratory for Strength and Vibration of Mechanical Structures, school of Aerospace, E-mail:[email protected] bAssociate Professor, State Key Laboratory for Strength and Vibration of Mechanical Structures, school of Aerospace,
E-mail:[email protected]
cProfessor of Aerodynamics, Department of Aerodynamics, Energetics and Propulsion, E-mail: [email protected] dEngineer, State Key Laboratory for Strength and Vibration of Mechanical Structures, school of Aerospace, E-mail:[email protected] eProfessor, State Key Laboratory for Strength and Vibration of Mechanical Structures, school of Aerospace, E-mail: [email protected]
intelligence information. Therefore, NAVs are widely studied since they can be utilised in the antiterrorism war and civil rescue. The Rotary-wing configuration is one of the popular configurations of NAVs as processing the advantages of compactness and high payload-carrying ability within size and weight constraints. However, the design of rotary-wing NAV is facing plenty of obstacles. Referring to the definition proposed by DARPA, it is expected that NAVs should have an endurance of 20 minutes to complete a recognition mission within a range of less than 1 km. Consequently, the propulsion efficiency of rotor turns out to be a quite important parameter for NAV design. However, the studies of micro and mini UAVs show that hover performance is always a bottleneck for the design of small UAVs as a result of the degradation of the aerodynamic performance at low Reynolds numbers [10, 11].
With the reduction of size and rotational velocity, a nano rotor operates in a significantly low Reynolds number ranging from 5000 to 15,000 based on the chord at 0.75R accompanying with the phenomena of separation, transition and reattachment of boundary layer flow. The maximum Figure of Merit (FM) of micro rotor could drop to 0.2 [11, 12] as a result, while the maximum FM of full-scale helicopter is about 0.7 to 0.8 [13]. In order to study the hover performance of rotary-wing NAVs, it is necessary to test the propulsive efficiency of nano rotor. Thrust and torque of rotor are the key parameters to calculate the FM of rotor. In recent years, several studies [11, 12, 14] on hovering performance of small rotors or propellers have been reported. Bohorquez [15] designed a hover stand, which was composed of a torque sensor with capacity of 0.0353 N·m and a tension/compression load cell with capacity of 1 Kg, to measure the nano-scale rotor. However, the capacities and precisions of both torque sensor and load cell are too large to measure static performance of nano-scale rotor. The studies of a gearless torque-canceling coaxial propeller were conducted by measuring torque and thrust separately [12]. Schafroth et al. [16] designed a test bench with a torque sensor and tension load cell
to measure the total thrust and torque of coaxial rotor with radii from 5 cm to 7 cm. Smedresman et al. [17] tested a micro-propeller operated at rotational speed between 2000 RPM and 9000 RPM with a 6-axis load cell. Deters and Selig [11] have carried out research on static performance of micro rotors and propellers. However, less study focused on the influence of chord distribution and twist angles to the rotor performance at such a small scale.
Computational study of the rotor in hover is also an interesting research field. Analytical approaches and CFD are frequently utilized for these cases [18-23]. Analytical methods have been well studied in the past decades. Lifting line theory, which is efficient and simple, is the popular method for rotor and propeller analysis. For instance, XRotor [18] applies the lifting line theory to analyze and design propeller. In order to predict the accurate aerodynamics of rotor or propeller, more complicated analytical methods, e.g. vortex lattice method (VLM) which models the rotor or the propeller as a series of horseshoe vortices, were developed [24-26]. The vortex lattice wake model was utilized to study the transient aerodynamics of rotor and propeller [27]. The introduction of more complex analytical model enhances the accuracy of calculation. Nevertheless, it is still insufficient to study the detailed flow field and flow mechanics induced by rotor or propeller movement. With the development of computer performance and computational techniques, huge computation can be implemented by the computers. The Euler or NS equations are solved to study the rotor and propeller performance. Rotary-wing NAVs typically fly in the Reynolds number ranging from 103to 104, where viscous effects are very strong.
The LSB [28] and strong rotational flow are usually induced by small rotors causing complicated flow phenomena. Therefore, Euler equations frequently utilized for full-scale helicopters numerical study [22, 23] are usually not applicable. Lakshminarayan [19, 20] simulated a mico hovering rotor operated at tip Reynolds number varying from 19,000 to 27,000 with a compressible Reynodls Averaged Navier-Stokes (RANS) code. It was found that the tip vortex formed on the rotor blades interacted with secondary vortices and the thrust coefficient was well predicted. Kalra et al. [29] examine the pertinent
aerodynamics of a hovering micro-rotor in ground effect with RANS code embedding Spalart-Allmaras turbulence model as well. Blade tip vortices were captured in virtue of helical shaped grids incorporating overset meshes system. Since the laminar flow is dominant when the Reynolds number is below 20,000 [28], the application of turbulence fluid model in the entire flow field is still an open debate to the simulation of rotary-wing NAVs. The description method of rotor rotation has a profound impact on the computational efficiency and accuracy, so it is necessary to choose an appropriate method for the simulation of nano coaxial rotor. The actuator disk model [30], MRF method [31], sliding mesh [32], adaptive deforming mesh [33] and chimera techniques [34, 35] are developed to describe the rotation of rotor or propeller during simulation. These methods have both pros and cons due to the
differences to describe the rotor rotation. Sliding mesh is a transient method which simulates the moving of the rotor by embodying it in a block with a shape of sphere or cylinder so as to rotate the block with attaching the outer block through interface. Sliding mesh can capture more complicated flow characteristics than actuator disk model and MRF but with less computational time than adaptive deforming mesh and chimera techniques.
Studies of nano-scale rotor with twisted blades in a low Reynolds number range of less than 20,000 are limited. For a deep under-standing of the influence of chord distribution and twist angles to the performance of such small rotor, the propulsive performance of two pairs of rotors with the same airfoil section for each pair were studied experimentally. Computations were also carried out to find out the inherent flow characteristics induced by the rotor geometry variation that resulted in differences between two rotors’ performance. Besides, mechanical efficiencies of several commercial micro motors from the same company were tested.
2. EXPERIMENTAL SETUP 2.1 Test bench
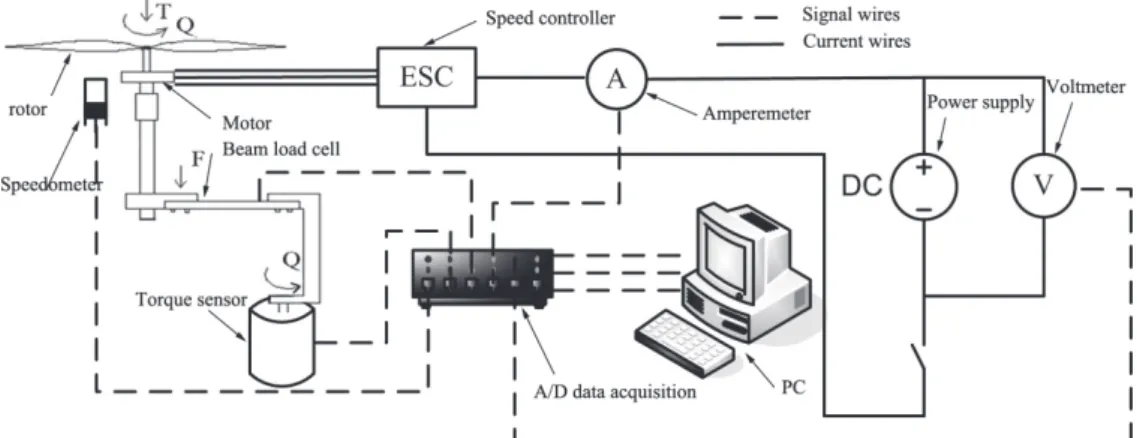
A nano-scale test bench, which was based on sensitive mechanisms, was designed to measure the tiny force and torque generated by small rotors simultaneously. The test bench was composed of complicated mechanical and electrical systems to uncouple the thrust and the torque generated by rotor. It was equipped with the energy supply system, the thrust and torque measurement system, the speed measurement system, the electric parameter measurement system and the control and data acquisition system to control and process the experiments accurately as shown in Fig. 1.
Figure 1. Schematic diagram of the experiment platform.
The energy supply system is a regulated DC power supply, which can adjust the voltage and stabilize it at a certain value to provide micro motor with current. Thrust and torque measurement system is primary component of test bench which is composed of load cells and sensitive mechanism. The friction of mechanism influences the torque greatly since the torque of nano rotor is quite small. In order to establish the pure torque of the rotor, an ultra-low-capacity static torque sensor DH15 by the SCAIME company with a capacity of 0.005 N·m and an accuracy class of 0.2% was used to measure the torque. In addition, the load cell for measuring the thrust was a beam load cell MEIRI F1200 with a capacity of 0.5 N. As shown in Fig. 2, the torque sensor has a length of 48 mm and a diameter of 45 mm, so an extended supporting beam was installed to avoid the effect of the torque sensor to the rotor downstream.
Additionally, a long carbon tube was installed vertically from one end of the beam load cell to support the motor and rotor. Thick wires were adopted to connect the electronic devices on the test bench, as the deformation of the beam load cell and the movement of the torque sensor are small enough. The speed measurement system included the speedometer and other instruments to process the speed signals. The electric parameters measurement system consisted of an amperemeter and a voltmeter to measure the input current and voltage. The control and data acquisition system was
composed of speed controller, analog-to-digital data acquisition, pc and processing software. The controller was YGE4-BL [25] from the Wes-Technik company for brushless motors. An USB analog-to-digital data acquisition (DAQ) of NI USB-6229 BNC was used in the test. During tests, the DAQ worked in both directions: a command generated by Measurement and Automation Explorer (MAX) and Labview was transmitted to the speed controller via this device, and the measurements acquired during the experiment (voltage, current, thrust, torque and rotational speed) were relayed back to MAX and Labview as well.
Figure 2. Photograph of the experiment platform.
2.2 Description of rotors and motors
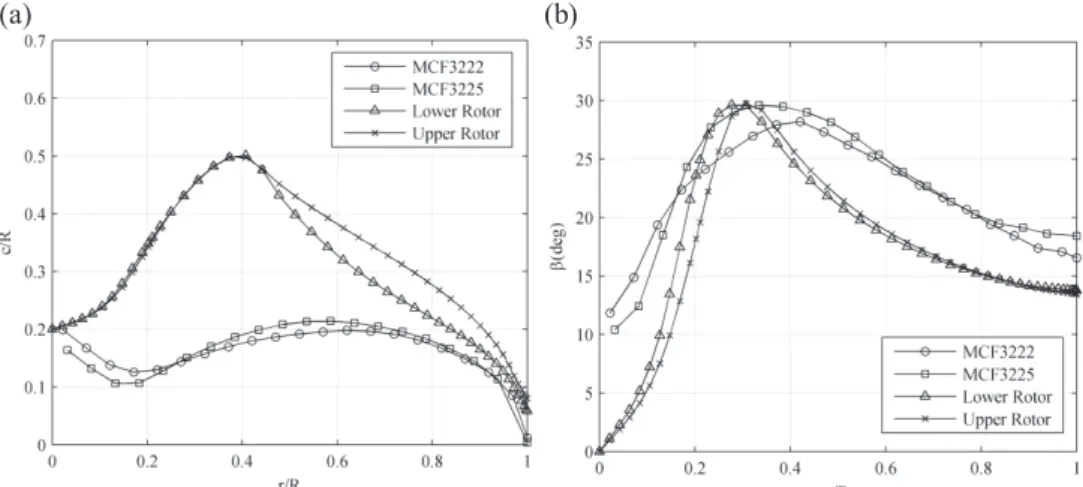
Two pairs of rotor were tested in the experiments. One pair of rotor is the carbon rotors MCF3222 and MCF3225 from MicroInvent, and the other pair of rotors are upper rotor and lower rotor from a coaxial rotor. MCF3222 and MCF3225 were declared as 81mm×56mm propeller weighing 0.2 g and 81mm×63mm propeller weighing 0.2 g as illustrated in Fig. 3(a). Two nano-scale rotors, called upper rotor and lower rotor which were originally two parts of coaxial rotor, were designed and fabricated using Carbon laminate with diameter of 7.5 cm weighing less than 0.3 g as illustrated in Fig. 3(b) [36]. The chord and twist distributions of the first pair of commercial rotors were determined by PropellerScanner [37]. Fig. 4(a) and Fig. 4(b) present the chord distribution and pitch angle distribution along blade for all rotors. The chord length of MCF3222 varies from zero to 0.2 R while that of MCF3225 varies from zero to 0.21 R. The average chord length of MCF3222 is 0.161 R which is lower than that of MCF3225 of 0.163 R. From Fig. 4(a), the chord of MCF3222 was longer than that of MCF3225 at the root of blades from 0 R to 0.2 R, but shorter than that of MCF225 from 0.2 R to 0.8 R. The pitch angle of MCF3222 and MCF3225 varies from 10 degree to 30 degree. And the pitch angle of MCF3222 was higher than that of MCF3225 from 0 R to 0.18 R, while it was lower than that of MCF3225 from 0.18 R to 0.6 R as illustrated in Fig. 4(b). Lower rotor and upper rotor have longer chords than MCF3222 and MCF3225 with a maximum chord of 0.5 R at 0.4 R of blade, while the chords drop dramatically at the tip of blade. The average chord length of upper rotor is 0.33 R which is higher than that of lower rotor of 0.30 R since the chord length of upper rotor is higher than that of lower rotor from 0.4 R to 1.0 R. The lower rotor and upper rotor nearly have the same pitch angle distribution except at the segment near blade root. The maximum pitch angle about 30° was detected at 0.3 R. It shall be pointed out that commercial rotors were originally designed as propellers for forward flight instead of hover so that the pitch angles are not as high as the upper rotor and lower rotor. The brushless out-runner motors of PICO, NANO, MICRO from MicroInvent used in experiments are illustrated in Fig.3 (a). All the motors were fabricated with nearly the same wire and diameter but with different length. PICO, NANO and MICRO weighed 1.28 g, 1.65 g and 2.40 g, respectively.
Figure 3. Micro bench motors and rotors from MicroInvent (a) and upper rotor and lower rotor (b).
Figure 4. Chord distributions (a) and pitch angle distributions (b) along blades of rotors.
3. COMPUTATION METHODOLOGY
To capture the detailed flow field characteristics of the nano rotor, Computational Fluid Dynamics (CFD) method was used. Because of the special flight condition of nano rotor, the operating Reynolds number of nano rotors is typically lower than 20,000 and the blade tip Mach number is less than 0.1 Ma. For low-Mach and low-Re flow, conventional NS equations might fail to converge to a correct solution. Therefore, 3D unsteady incompressible Navier-Stokes (INS) solver with artificial compressibility was used to compute the aerodynamic performance of nano rotor at ultra-low Re. The simulation was performed based on NS equations in a coordinate system which rotated around the y-axis with an angular velocity Ω. Sliding mesh was applied to describe the movement of rotor. Previous research [38] showed that laminar flow model has high fidelity to predict the flow field of nano rotor, thus laminar flow model was adopted in this study. The unsteady incompressible Navier-Stokes equations [39] in integral form for an arbitrary control volume are written in three dimensions for a moving domain with the addition of pseudo time of density and velocity as follows.
(1)
Ò
r
r
r
t
∫∫∫
VQ dV
∫∫
V(
F
F
v)
ndS
∫∫∫
VW dV
∂
∂
+
∂−
⋅
=
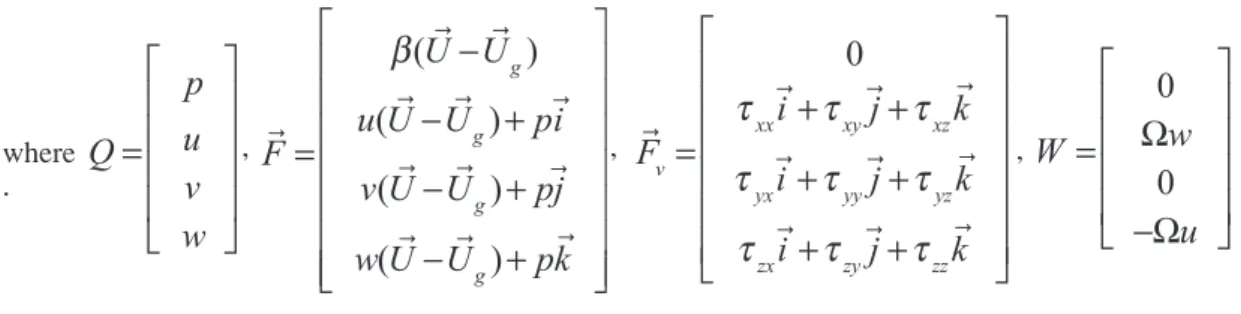
(a) (b) (a) (b)where , , , .
Here, Q is vector of primitive flow variables. F→termed vector of convective fluxes are related to the convective transport of quantities in the fluid. F→v termed vector of viscous fluxes contain the viscous stresses τij and β is pseudo-compressibility factor. In the formula, U→ and U→g are the velocity component and moving grid velocity component which can be expressed as
(2)
and
. (3)
The equations were solved with finite volume method and Roe’s flux scheme was employed. 4. EXPERIMENT DESIGN, COMPUTATION DESIGN AND DATA PROCESSING
4.1 Experiment design
Static performance of MCF3222, MCF3225, upper rotor and lower rotor was tested with designed test bench. In order to compare the performance of rotors, each rotor was tested with motor MICRO at a voltage of 3.6 V. At the voltage, the rotational velocity could be adjusted by the controller with PWM signals. The rotational velocity varied typically from 2000 RPM to 10000 RPM.
In order to compare the performance among several micro motors, the mechanical efficiency of PICO, NANO and MICRO were measured as well. Similarly, each motor was tested with lower rotor at voltage of 3.6 V.
Prior to the experiments, calibrations of test benches were performed to eliminate nonlinearity of load cell and uncertainty factors. The calibration was carried out before the experiments as shown in Fig. 5. Since the beam load cell is directly connected to the motor, with no mechanical linkage between,
r
r
r
r
U
g=
u i
g+
v j
g+
w k
gr
r
r
r
U
=
ui
+ +
vj
wk
W
w
u
0
0
=
Ω
−Ω
r
r
r
r
r
r
r
r
r
r
F
i
j
k
i
j
k
i
j
k
0
v xx xy xz yx yy yz zx zy zzτ
τ
τ
τ
τ
τ
τ
τ
τ
=
+
+
+
+
+
+
r
r
r
r
r
r
r
r
r
r
r
r
F
U U
u U U
pi
v U U
pj
w U U
pk
(
)
(
)
(
)
(
)
g g g gβ
=
−
−
+
−
+
−
+
Q
p
u
v
w
=
(a) (b)the relative fit errors of beam load cell are very small; they are below 0.5% when the force applied is above 1.5 g. The relative fit errors of the torque sensor are below 2% when the torque applied is above 10 g·mm and below 0.5% when the torque applied is above 30 g·mm.
4.2 Computation design
The computation was performed to observer the detailed flow field of nano rotors to find inherent reason of the rotor performance difference induced by the variation of chord distribution and twist distribution along the blade. The flow fields of upper rotor and lower rotor were compared with each other. Since the chord length of both upper rotor and lower rotor varies along the span, simulations were carried out on both rotors at the same Re of 18,000 based on average chord length at the 3/4 of blade. A radius of diameter of 10 mm was added at the center of rotor to take into account the influence of motor. Structured grid was generated for each rotor with a grid number of 3.5 million. Special treatment was performed near the wall so that the detailed flow field characteristics can be captured. The rotor rotated 2 degree per physical time step. In addition, rotor rotated more than four cycles for each rotational speed. The computations were performed on HP8400 station with 16 CPU of Xeron 5610 and 16GB memory for two weeks.
4.3 Data processing
Figure of merit is defined as the ratio of ideal power Pidealto the actual power P and motor mechanical
efficiency ηis defined as the ratio of actual power P to input electric power,
(4)
(5)
where CT, CP, Ω, Q, U and I are thrust coefficient, power coefficient, rotational velocity, rotor torque,
input voltage and input current, respectively.
In the experiment, two principal sources of uncertainty were contained. One is the bias errors inherent in the measurement devices with regard to offset and drift, and the other is the precision error. The precision error of measurement was calculated using the Kline-McClintock method for error propagation. All of the results have a confidence of 95% in experiments.
5. RESULTS AND DISCUSSION
5.1 Comparison of rotor static performance
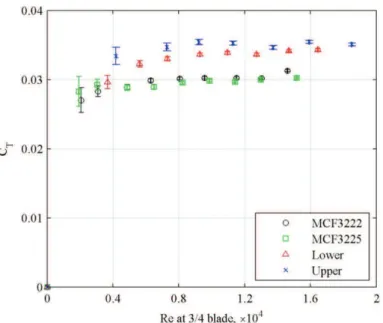
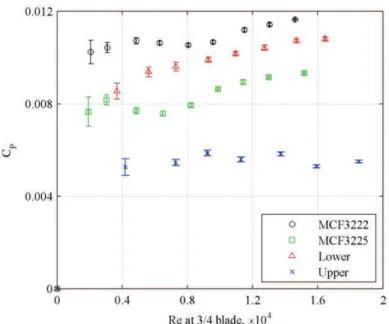
The rotor static performance was compared according to experimental results. Figure 6 shows that thrust coefficient varies with Re at 3/4 blade. Experimental results showed that the thrust coefficients of all rotors are from 0.024 to 0.036 in general. Even the rotors use the fixed pitch angle along the blade, the thrust coefficient of each rotor increases slightly with Re. Upper rotor generated the highest thrust coefficient while MCF3225 generated the lowest one among the rotors. Generally, MCF3222 and MCF3225 have lower thrust coefficients than upper rotor and lower rotor. If the two rotors in one pair were compared, it can be found that upper rotor generated higher thrust coefficient than lower rotor while MCF3222 generated nearly the same thrust coefficient as MCF3225. Power coefficient of each rotor varying with Re at 3/4R of blade is illustrated in Fig. 7. Power coefficient of each rotor changes arbitrarily with Re which is different from thrust coefficient. For different rotor, the power coefficient varies from each other greatly. Generally, MCF3222 has the highest power coefficient from 0.010 to 0.012, while upper rotor has the lowest one which is from 0.005 to 0.006. The power coefficient of lower rotor which is only lower than that of MCF3222 is the second highest among all rotors. The power of coefficient of MCF3225 is in the middle, while it is rather higher than that of lower rotor. When the power coefficients of two rotors in one pair were compared, it can be detected that upper rotor generated lower power coefficient than lower rotor, and MCF3222 generated higher power coefficient than MCF3225. Figure of merit is one of criterions to judge the performance of rotor. Figure 8 shows the FMs of every rotor. It was detected that FMs of upper rotor reach 0.63 which is two times higher than those of the other rotors. The FMs of other rotors are lower than 0.35. And the FMs of lower rotor
P
UI
Q
UI
η =
=
Ω
FM
P
P
C
C
2
ideal T P 3/2=
=
are about 0.3 which is slightly lower than those of MCF3225 of 0.33. The lowest FM is found from 0.22 to 0.25 for MCF3222. Obviously, upper rotor has higher FMs than lower rotor, and MCF3225 has higher FMs than MCF3222.
In general, the first pair of rotors which are upper rotor and lower rotor generated higher thrust coefficient than the second pair of rotors which are MCF3222 and MCF3225. When comparing the average chord length of the two pairs of rotor, the average chord lengths of the first pair were about two times higher than those of the second pair. When comparing rotors in the first pair, it was found that upper rotor which has a slightly higher average chord length generated higher thrust coefficient than lower rotor despite the fact that upper rotor has lower pitch angle than lower rotor from 0 R to 0.3 R along the blade. MCF3222 generated nearly the same thrust coefficient as MCF3225 due to the nearly same chord length. So, it was indicated that chord length has a positive effect on rotor thrust coefficient at the same Re. The increase of chord length also augments the rotor solidity which is the inherent reason to increase rotor thrust coefficient. This result was also validated by Bohorquez [10] for micro rotor. However, it shall be pointed out that the airfoil section and pitch angle distribution will also influence the rotor thrust coefficient in light of the blade element theory [13]. Power coefficient performed an irregular tendency from conventional theory. The upper rotor had not only the maximum thrust coefficient but also the minimum power coefficient resulting in the best hovering performance among rotors according to experiments. When comparing with lower rotor, it was found that upper rotor has lower pitch angle from 0 R to 0.3 R which might induce less drag causing less power coefficient because higher pitch angle resulted in a high possibility suffering flow separation on blade surface due to the decrease of Reynolds number at blade root. The second pair of rotors, that are MCF3225 and MCF3222, exhibited nearly the same characteristics. The experimental results of thrust coefficient and power coefficient decided the results of FMs. So, upper rotor exhibited the highest FMs than other rotors. However, the hovering performance of small rotors drops dramatically even though the FMs of upper rotor reach 0.6 which is still far lower than that of full scale helicopter of about 0.8. Therefore, the hovering performance of rotor decreases with the reduction of rotor size.
It shall be pointed out that the second pair of rotors was typically designed for fwd flight while the first pair of rotors was optimized for hovering flight. It is evidenced as well that the optimization of rotor can improve the performance of small rotors.
Figure 7. Torque coefficient varying with the Re at 3/4 blade.
Figure 8. Figure of merit varying with thrust coefficient (Reynolds number ranging from 2000 to 18,000).
5.2 Flow field comparison between upper rotor and lower rotor
The thrust characteristics of both lower rotor and upper rotor were calculated. Numerical results showed that the thrust coefficient of lower rotor and upper rotor were 0.035 and 0.039 at Re number of 18,000 based on the average chord length, respectively, while experimental results showed that they were about 0.033 and 0.035, respectively. The power coefficients of lower rotor and upper rotor were 0.012 and 0.0079 and FMs of lower rotor and upper rotor were 0.29 and 0.50 according to calculation. Comparisons between experimental results and numerical results showed that calculation over-predicted both thrust coefficient and power coefficient. However, numerical results also stated that upper rotor exhibited better performance than lower rotor. In order to analyze the inherent reason of the difference, the detailed flow fields of both upper rotor and lower rotor were analyzed and comparisons were performed. Every variable has been nondimensionalized with the blade tip velocity and rotor radius.
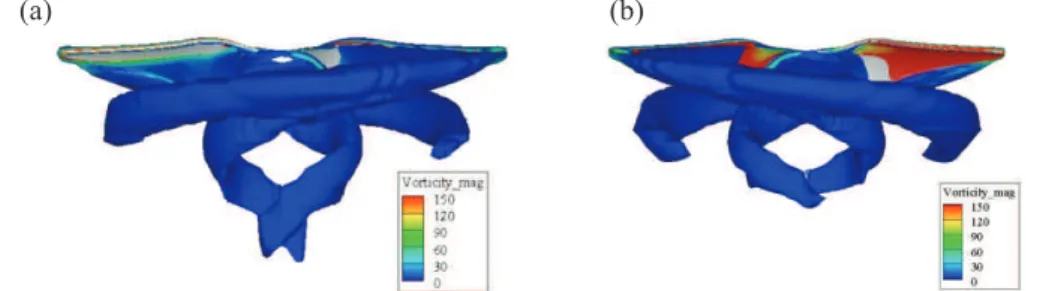
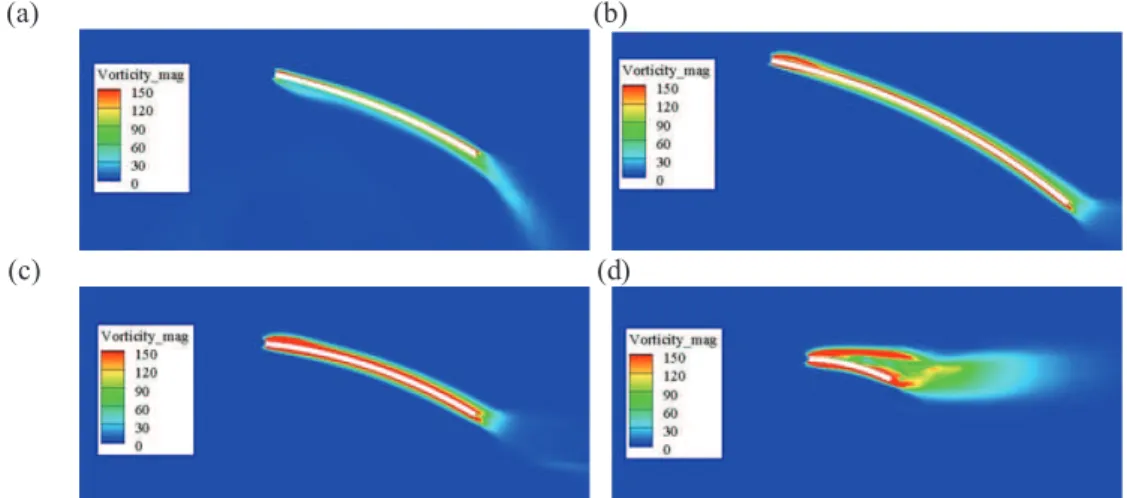
Figure 9 and Figure 10 show the contours of pressure coefficient of lower rotor and upper rotor. The surface distribution of pressure coefficient is helpful to understand the variation of thrust coefficient and power coefficient. High negative pressure coefficient was found at the location of 0.8R on suction surface. High positive pressure coefficient appeared near the blade tip on pressure surface. Analysis revealed that the blade tip flow is the reason that the highest negative pressure coefficient doesn’t emerge at the blade tip on the suction surface where the flow velocity is the highest. Relative low pressure coefficient appeared at the location of about 0.3R where the chord length turns out to be short for both rotors. This phenomenon resulted from the vortex which can be observed from the iso-surfaces of second invariant of vorticity magnitude as illustrated in Fig. 11. Iso-surfaces were generated from the blade tip and 0.3 R of the span. And higher vorticity magnitude can be found on the iso-surfaces near the blade for the upper rotor. Therefore, vortex is considered as a significant factor to influence the performance on the rotor surface. Because the velocity varies along the span, vortex is formed on the blade surface. Furthermore, the pressure on the suction surface differs from that on the pressure surface greatly so that tip flow generates. In order to further analyze the difference of the flow field between the two rotors, the contour of vorticity magnitude was presented at several blade stations. Figure 12 and Figure 13 illustrate the contour of vorticity magnitude at the stations of 0.2 R, 0.4 R, 0.6 R and 0.95 R for lower rotor and upper rotor, respectively. Leading vortex can be found at all stations and the strength increases with the distance between the station and the center of rotor. The contour of voriticity magnitude of lower rotor is similar to that of upper rotor except at the location of 0.95 R. When comparing Fig. 12(d) and Fig. 13(d), it was found that vortex reattached on the suction surface for upper rotor but unattached for the lower rotor. It is indicated that the attachment of leading vortex was the reason that the performance of upper rotor is better than that of the lower rotor.
Figure 9. Contour of pressure coefficient of lower rotor (a) suction surface, (b) pressure surface.
Figure 10. Contour of pressure coefficient of upper rotor (a) suction surface, (b) pressure surface.
Figure 11. Iso-surfaces of second invariant of vorticity magnitude q = 0.5 (a) lower rotor, (b) upper rotor.
(a) (b) (a) (b) (a) (b)
Figure 12. Contour of vorticity magnitude at the stations of (a) 0.2 R, (b) 0.4 R, (c) 0.6 R and (d)0.95 R on lower rotor.
Figure 13. Contour of vorticity magnitude at the stations of (a) 0.2 R, (b) 0.4 R, (c) 0.6 R and (d)0.95 R on upper rotor.
5.3 Mechanical efficiency of micro motors
The mechanical efficiencies of PICO, NANO and MICRO were compared based on the measurement with lower rotor at voltage of 3.6 V.
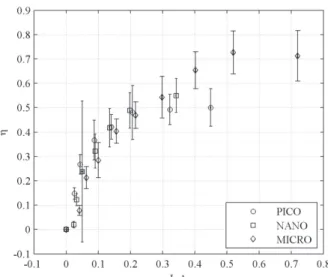
The mechanical efficiencies of various motors driving by lower rotor were also compared as illustrated in Fig. 13. Motor mechanical efficiency increased sharply with inputted current but reached a maximum value at a certain current. After that, it retained nearly as a constant. The mechanical efficiencies of all motors kept low values less than 0.75. At low current, PICO motor had the highest motor mechanical efficiencies. With the increase of inputted current, the mechanical efficiency of PICO motor reached a maximum value of about 0.5 and the mechanical efficiency of MICRO motor kept on increasing until a maximum value of 0.73. The meachnical efficiency of NANO rotor was between the PICO motor and MICRO motor.
Experimental results showed that the mechanical efficiency of small motor degrades dramatically due to the decrease of motor size. Analysis revealed that the decrease in wire diameter reduction, compared to full scale motors, likely leads to increased motor resistance. For PICO, NANO and MICRO motors which were developed by the same company, MICRO has the highest motor mechanical efficiency while PICO has lowest ones, so motor size influences the motor mechanical efficiency.
(a) (b) (c) (d) (a) (b) (c) (d)
Figure 14. Mechanical efficiency varying with current for motor of Pico, Nano and Micro.
CONCLUSION
Hovering performance of two pairs of rotor including MCF3222, MCF3225, upper rotor and lower rotor were tested with the designed test bench. And the mechanical efficiencies of several small motors including PICO, NANO and MICRO were also compared with the lower rotor. The chord and the twist angle distributions were compared to analyze the difference of hovering performance among rotors. Upper rotor, which is originally optimized for coaxial rotor, has the most excellent hovering performance with a maximum thrust coefficient of 0.36, a minimum power coefficient of 0.0055 and a maximum figure of merit of about 0.63 as a result. The figure of merit of lower rotor is only 0.3 lower than that of upper rotor. Analysis revealed that it contributes to the decrease of chord length from 0.4 R to 1.0 R of blade of lower rotor comparing with upper rotor. It shall be pointed out that lower rotor is optimized by introducing the induced flow of upper rotor as the freestream, whereas the upper rotor is influenced little by the lower rotor. So, the design of the upper rotor is more like an independent optimization than a dependent optimization, vice verse for lower rotor. Commercial rotors exhibit poor performance. One explanation might be that the commercial rotors are originally designed as a propeller instead of a rotor. Despite the fact that the figure of merit of upper rotor exceeds 0.6, the hovering performance of nano rotor is still lower than that of full-scale rotors. The comparison between the two pairs of rotors shows that the rotor solidity has positive effect on the thrust coefficient and pitch angle distribution influences the power coefficient. The flow field comparison between upper rotor and lower rotor stated that the state of leading vortex determined by the chord distribution and pitch angle distribution has an effect on the rotor performance.
The mechanical efficiencies of several small motors including PICO, NANO and MICRO were also compared with the lower rotor. Results showed that the maximum mechanical coefficiencies of all motors are lower than 0.75. And a maximum value of 0.73 was found for MICRO motor while PICO motor only obtains a maximum value of 0.5. The comparison among motors indicated that the motor mechanical efficiency drops dramatically with the motor size. Analysis revealed that the thickness of wires has impacts on the motor performance.
In conclusion, rotor performance degraded with the decrease of rotor size. It was found that rotor solidity has a positive effect on the thrust coefficient while pitch angle distribution influences the power coefficient. Flow field analysis indicated that leading edge vortex has an effect on the rotor performance. The study of mechanical efficiency of small motors showed that the performance of small rotors decline with the reduction of size.
Further study shall be performed on series of rotors with different chord length and pitch angle. Detailed flow field shall be analyzed to state the importance of the flow phenomenon to the rotor performance.
ACKNOWLEDGEMENTS
The authors would like to thank the support of project 11302164 supported by National Natural Science Foundation of China, project 2012JQ1018 supported by Natural Science Foundation of Shaanxi Province and the Fundamental Research Funds for the Central Universities. They would also like to thank the laboratory of DAEP of ISAE.
REFERENCES
[1] Pines DJ and Bohorquez F. Challenges facing future Micro-Air-Vehicle development [J]. Journal of Aircraft, 2006, 43(2): 290-305.
[2] Grasmeyer JM and Keennon MT. Development of the black widow micro air vehicle [C]. 39th Aerospace Sciences Meeting and Exhibit. Nevada: AIAA E-library, 2001: 127.
[3] Bohorquez F, Samuel P, Sirohi J and et a. Design, analysis and hover performance of a rotary wing Micro Air Vehicle [J]. AHS Journal, 2003, 48: 80-90.
[4] Conn A, Brugess S, Hyde R and et a. From natural flyers to the mechanical realization of a flapping wing Micro Air Vehicle [C]. 2006 IEEE International Conference on Robotics and Biomimetics. Robio: IEEE Press, 2006: 439-444.
[5] SUPAERO and ONERA. Demo [CD]. 3rd US-European Competition and Workshop on Micro Air Vehicle and 7th European Micro Air vehicle conference and Flight competition, 2007. [6] Pines DJ. 06-06 proposer Information Pamphlet (PI) for Defense Advanced Research Project
Agency (DARPA) Defense Sciences Office (DSO) Nano Air Vehicle (NAV) program [R]. USA: DARPA DSO, 2005.
[7] Zhen Liu, MinXu, Jean-marc Moschetta, Shibin Yang. A review on conceptual design of nano air vehicles (in Chinese), Chinese Sci Bull (Chinese Ver), 2010, 55(34), 3257-3268.
[8] Sato S, Drela M, Lang JH and Otten DM. Design and characterization of hover nano air vehicle propulsion system [C]. 27th AIAA Applied Aerodynamics Conference. San Antonio: AIAA
E-library, 2009: 3962.
[9] Youngren H, Kroninger C, Chang M and et a. Low Reynolds number testing of the AG38 airfoil for the SAMARAI nano air vehicle [C]. 46th AIAA Aerospace Sciences Meeting and Exhibit. Nevada: AIAA E-library, 2008: 417.
[10] Bohorquez F and Pines DJ. Rotor design for efficient rotary wing Micro Air Vehicles [C]. The International Specialists’ Meeting on Unmanned Rotorcraft: Design, Control and Testing. USA: AHS Press, 2005.
[11] Deters RW and Selig MS. Static testing of micro propellers [C]. 26th AIAA Applied Aerodynamics Conference. Hawaii: AIAA E-library, 2008: 6246.
[12] He R and Sato S. Design of a single-motor nano aerial vehicle with a gearless torque-canceling mechanism [C]. 46th AIAA Aerospace Sciences Meeting and Exhibit. Nevada: AIAA E-library,
2008: 1417.
[13] Leishman JG. Principles of helicopter aerodynamics [M]. 2nd Edition. New York: CambridgeUniv. Press, 2005: 135.
[14] Bohorquez F, Rankins F, Daeder JD and et a. Hovering performance of rotor blades at low Reynolds numbers for rotary wing Micro Air Vehicles-an experimental and CFD study [C]. 21st AIAA Applied Aerodyanmics Conference. Orlando: AIAA E-library, 2003: 3930.
[15] Bohorquez F, Pines DJ and Samuel PD. Small rotor design optimization using blade element momentum theory and hover tests [J]. Journal of Aircraft, 2010, 47(1): 268-283.
[16] Schafroth D, Bouabdallah S, Bermes C and et a. From the test benches to the first prototype of the muFly micro helicopter [J]. Journal of Intelligent & Robotic System, 2009, 54(1): 245-260.
[17] Smedresman A, Yeo D and Shyy W. Design, fabrication, analysis, and testing of a micro air vehicle propeller [C]. 29th AIAA Applied Aeroydnamics Conference. Hawaii, 2011: 3817.
[18] Drela M. Xrotor version 7.2 user guide [CP]. MIT Aero and Astr, 2002.
[19] Lakshminarayan VK, Bush BL, Duraisamy K and et a. Computational investigation of micro hovering rotor aerodynamics [C]. 24th AIAA Applied Aerodyanmics Conference. California:
[20] Lakshminarayan VK, Bush BL, Duraisamy K and et a. Computational investigation of small scale coaxial rotor aerodynamics in hover [C]. 47th AIAA Aerospace Sciences Meeting Including The New Horizons Form and Aerospace Exposition. Orlando: AIAA E-library, 2009: 1069.
[21] Schroeder EJ and Baeder JD. Using Computational fluid dyanmics for Micro-Air Vehicle airfoil validation and prediction [C]. 23rd AIAA Applied Aerodyanmics Conference. Toronto: AIAA E-library, 2005: 4814.
[22] Modisette JM and Darmofal DL. An output-based adaptive and higher-order method for a rotor in hover [C]. 26th AIAA Applied Aerodyanmics Conference. Hawaii: AIAA E-library, 2008:
6396.
[23] Strawn RC and Djomehri MJ. Computational modeling of hovering rotor and wake aerodyanmics [J]. Journal of Aircraft, 2002, 39(5): 786-793.
[24] Usab WJ, Lee kH and Sullivan JP. A comparison of numerical simulation and experimental measurements of flow through propellers [C]. AIAA 26th Aerospace Sciences Meeting. Nevada:
AIAA E-library, 1988: 0367.
[25] Burger C. Propeller Performance Analysis and Multidisciplinary Optimization Using a Genetic Algorithm [D]. Auburn: Auburn University, 2007.
[26] Berry JD. A multi-element vortex lattice method for calculating the geometry and effects of a helicopter rotor wake in forward flight [C]. AIAA 26th Aerospace Science Meeting. Nevada:
AIAA E-library, 1988: 0664.
[27] JR Graham kS. An architecture for real-time flight simulation of a vortex lattice rotor wake model [D]. Alabama: University of Alabama, 2001.
[28] Shyy W, Lian YS, Tang J and et a. Low Re number aerodynamics of low Reynolds number flyers [M]. New York: Cambridge University Press, 2008.
[29] kalra TS, Lakshminarayan VK, Daeder JD and Thomas S. Methodological Improvements for computational study of hovering micro-rotor in ground effect [C]. 20th AIAA Computational Fluid Dynamics Conference. Hawaii: AIAA E-library, 2011, pp. 3552.
[30] Grondin G, Thipyopas C and Moschetta JM. Aerodynamic analysis of a multi-mission short-shrouded coaxial UAV: Part III-CFD for hovering flight [C]. 28th AIAA Applied Aerodynamics Conference. Chicao: AIAA E-library, 2010: 5073.
[31] Boelens OJ, Van der ven H, Oskam B and et a. Boundary Conforming Disontinuous Galerkin Finite Element Approach for Rotorcraft Simulations [J]. Journal of Aircraft, 2002, 39(5):
776-785.
[32] Steijl R and Barakos G. Sliding mesh algorithm for CFD analysis of helicopter rotor-fuselage aerodynamics [J]. International Journal for Numerical Methods in Fluids, 2008, 58: 527-549.
[33] Kang HJ and Kwon OJ. Numerical prediction of rotor hover performances using unstructured adaptive meshes [C]. 38th Aerospace Sciences Meeting and Exhibit. Reno: AIAA E-library, 2000:
0258.
[34] Sitaraman J and Baeder JD. Field velocity approach and geometric conservation law for unsteady flow simulations [J]. AIAA Journal, 2006, 44(9): 2062-2074.
[35] Xu HY and Ye ZY. Numerical simulation of rotor-airframe aerodynamic interaction based on unstructured dynamic overset grids [J]. Science China Technological Sciences, 2012, 55(10):
2798-2807.
[36] Liu Z, Moschetta JM and Xu M. Design, fabrication and hovering performance study of nano coaxial rotor [J]. International Journal of Aerospace and Lightweight Structures, 2011, 1(1):
119-132.
[37] Hepperle M. Propellerscanner manual [CP]. www.mh-aerotools.de, 2003.
[38] Liu Z, Roberto A, Moschetta JM and Thipyopas C. Experimental and Computational Evaluation of Small Micro Coaxial Rotor in Hover [J]. Journal of Aircraft, 2011, 48(1): 220-229.
[39] Yan C. Methodology and Application of Computational Fluid Dynamics [M]. Beijing: Beijing University of Aeronautics and Astronautics Press, 2006: 88-99.