O
pen
A
rchive
T
OULOUSE
A
rchive
O
uverte (
OATAO
)
OATAO is an open access repository that collects the work of Toulouse researchers and
makes it freely available over the web where possible.
This is an author-deposited version published in :
http://oatao.univ-toulouse.fr/
Eprints ID : 12459
To link to this article : DOI :10.1002/asi.23014
URL :
http://dx.doi.org/10.1002/asi.23014
To cite this version : Cabanac, Guillaume and Hubert, Gilles and
Hartley, James Solo versus collaborative writing: Discrepancies in the
use of tables and graphs in academic articles
. (2014) Journal of the
Association for Information Science and Technology, vol. 65 (n° 4).
pp. 812-820. ISSN 1532-2882
Any correspondance concerning this service should be sent to the repository
administrator:
[email protected]
Solo Versus Collaborative Writing: Discrepancies in the
Use of Tables and Graphs in Academic Articles
Guillaume Cabanac and Gilles Hubert
Computer Science Department, University of Toulouse, IRIT UMR 5505 CNRS, 118 Route de Narbonne, F-31062 Toulouse Cedex 9, France. E-mail: {guillaume.cabanac, gilles.hubert}@univ-tlse3.fr
James Hartley
School of Psychology, Keele University, Staffordshire, United Kingdom ST5 5BG. E-mail: [email protected]
The number of authors collaborating to write scientific articles has been increasing steadily, and with this col-laboration, other factors have also changed, such as the length of articles and the number of citations. However, little is known about potential discrepancies in the use of tables and graphs between single and collaborating authors. In this article, we ask whether multiauthor articles contain more tables and graphs than single-author articles, and we studied 5,180 recent articles pub-lished in six science and social sciences journals. We found that pairs and multiple authors used significantly more tables and graphs than single authors. Such find-ings indicate that there is a greater emphasis on the role of tables and graphs in collaborative writing, and we discuss some of the possible causes and implications of these findings.
Introduction
It is a well known fact that the numbers of authors of individual scientific articles have been increasing. Indeed, as Price (1963, pp. 86–91) put it for chemistry, perhaps tongue in cheek, “The proportion of multiauthor articles has accel-erated steadily and powerfully, and it is now so large that if it continues at the present rate by 1980, the single-author paper will be extinct.” Today, commentators are more cir-cumspect. Abt (2007, p. 358) for example, writes, “We con-clude that single authored papers will decrease in frequency in the coming years, but will not disappear . . . [because] . . . the rapid increase between 1900 and 1960 did not continue, but changed into an exponential that will never reach zero.”
Currently, we estimate that about 30% of the articles in
JASISTare single authored (Cabanac & Hartley, 2013). The numbers of authors contributing to scientific articles covers a considerable range—from single authorship to
hyperauthorship (Cronin, 2001, 2005). There are articles with more than 100 authors in some domains (e.g., see Adiga et al., 2002; Foster et al., 2004), and, of course, there is the spectacular contribution by Aamodt et al. (2010) with its 1,055 coauthors.
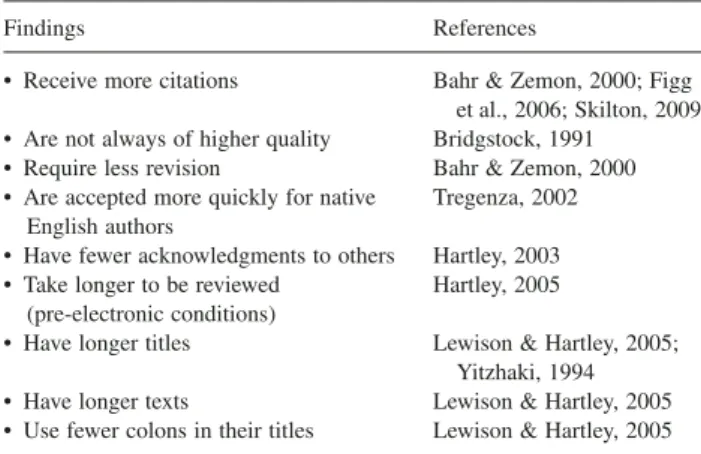
Together with this increase in the numbers of authors there has been an increase in the numbers of articles about the effects of coauthorship. Table 1 lists the findings from some of these studies. Many of these articles were published from the 1960s to 1990s (see Speck, Johnson, Dice, & Heaton, 1999), and these predate the electronic revolution that now facilitates collaborative writing.
Of course, different authors collaborate in different ways. Indeed, for the purposes of this article, it might be of interest for the reader to know that the article was initially proposed to James (Hartley) by Guillaume (Cabanac) working with Gilles (Hubert), who had suggested the study. Guillaume and Gilles carried out the data collection and analysis; then the article was initially written in six parts. James drafted the Introduction and squabbled over various titles. Guillaume and Gilles wrote up the Methods and Results sections. James wrote the Discussion and the Conclusions, and Guillaume completed the References section. But in all of these stages the manuscript passed backward and forward electronically between us numerous times with suggestions for improvement and agreement on every section. Then the final version was checked by James for appropriate English before it was checked by Gilles and Guillaume for submis-sion by Guillaume.
Nonetheless, various patterns of collaboration need to have certain features in common. There has to be a senior author responsible for the submission. Everyone has to agree with the final version. Different authors contribute different things, so the more authors there are the more areas there are for discussion and perhaps disputation. Some authors are seen as more expert than the others on different issues. Therefore, deciding on the order of the authors on the title page can sometimes present problems (Kosmulski, 2012; Waltman, 2012), and sometimes, as in the present article, the author who proposed the study comes last.
There have to be negotiations, too, about the amount of detail to contain in the Introduction, Methods, Results, and Discussion sections. There needs to be agreement over the numbers and suitability of the tables, graphs, and references. Also, after submission, the criticisms of editors and referees have to be discussed and responded to by all or by a selec-tion of the authors.1
In this article, we focus on the numbers of tables and graphs in single and coauthored articles. There have not been, as far as we are aware, any previous articles on this topic. So we have no specific hypotheses generated by earlier research, but we believe that as “more heads are better than one,” there might be more tables and graphs in articles written with more authors. The earlier research sum-marized in Table 1 suggests that increasing the numbers of authors appears to lead to increases in other key features in academic publications.
Accordingly, we made the following predictions:
• On the use of tables:
— Hypothesis 1 (H1): Multiauthor articles feature more tables than single-author articles.
— Hypothesis 2 (H2): Two-author articles feature more tables than single-author articles.
• On the use of figures:
— Hypothesis 3 (H3): Multiauthor articles feature more figures than single-author articles.
— Hypothesis 4 (H4): Two-author articles feature more figures than single-author articles.
Methods
We tested these hypotheses using the following six-step method. It relies on processing all of the articles published in each issue of selected research journals during a specific time period.
1. Retrieve the full text of each article and count the follow-ing: number of pages, number of authors, number of tables, and number of figures.
2. Discard articles with less than four pages to eliminate nonresearch articles, such as book reviews, editorials, errata, letters to the editor, notes, and so on.
3. Group articles according to their number of authors. We thus defined “Group 1A” and “Group 2A+” for single-author and multisingle-author articles, respectively.
4. Use box plots to inspect visually the differences in the distribution of the number of tables and figures between Groups 1A and 2A+ for each journal.
5. Test the statistical significance of these differences with the nonparametric Mann–Whitney U test on two independent samples. The null hypothesis H0 assumes that the distribution of the variable under study (e.g., number of tables) is not statistically significant between single-author (Group 1A) and multiauthor articles (Group 2A+). When H0 is rejected, we report the level of significance of the test (two-tailed) accord-ing to the classical three levels: *p < .05, **p < .01, and ***p < .001.
6. Further analyze the data to check whether any such dif-ference can also be observed between single-author and two-author articles (instead of multiauthor articles). This analysis repeats Steps 3 to 5 to compare the use of tables and figures among single-author (Group 1A) and two-author articles (Group 2A).
Data
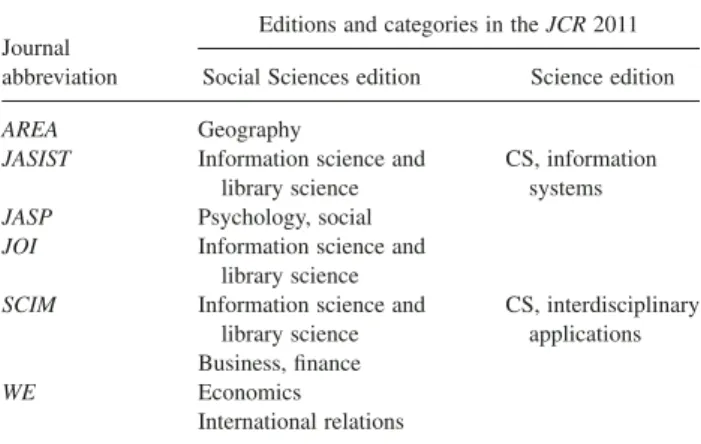
We considered several journals related to various scien-tific domains to have a range of different types of journals for our studies. We selected six peer-reviewed journals listed under the two editions of the Thomson Reuters Journal
Citation Reports(JCR 2011), namely, the Social Sciences and Sciences editions. Moreover, these journals appear in various categories of the JCR, some of them being listed in more than one category (Table 2).
The following criteria were considered in selecting these journals:
1. The journals had to publish a large number of articles per year for our analyses. We thus focused on the top journals of JCR categories according to the “Articles” field.
1We wonder how Aamodt et al. (2010) collaborated in these respects!
Hence the need to differentiate between contributors and coauthors, as suggested by Rennie, Yank, and Emanuel (1997).
TABLE 1. Findings from previous research comparing multiple with
single authors.
Findings References
• Receive more citations Bahr & Zemon, 2000; Figg
et al., 2006; Skilton, 2009
• Are not always of higher quality Bridgstock, 1991
• Require less revision Bahr & Zemon, 2000
• Are accepted more quickly for native English authors
Tregenza, 2002
• Have fewer acknowledgments to others Hartley, 2003
• Take longer to be reviewed (pre-electronic conditions)
Hartley, 2005
• Have longer titles Lewison & Hartley, 2005;
Yitzhaki, 1994
• Have longer texts Lewison & Hartley, 2005
• Use fewer colons in their titles Lewison & Hartley, 2005
Note. Articles on research collaboration published before 2005, although
of general interest, do not reflect the changes in academic writing brought about by new technology.
2. The journals had to publish at least 60% of articles fea-turing tables and figures. This was not the case of some fields, such as pure mathematics.
3. The journals had to publish a reasonable ratio of single-author versus multisingle-author articles. Journals that mainly publish multiauthor articles (or only single-author articles) do not meet this requirement (e.g., often in physics and biology).
4. The journals had preferably to publish articles by researchers involved in a diversity of scientific domains. Multidisciplinary journals were of particular interest in this respect.
5. The journals had to publish articles in HTML format. This pragmatic requirement allowed us to count the number of tables and figures systematically and in the same way for each journal.
6. The journals had to have no restrictions on the numbers of tables and figures allowed per article, as sometimes occurs in medical and science journals (e.g., Journal
of Biological Chemistry and International Journal of
Pharmaceutical Science and Research).
Table 2 shows our six selected journals that complied with these criteria. Journals listed in only one category of the
JCRare Area (AREA), Journal of Applied Social Psychology (JASP), and Journal of Informetrics (JOI). Note, however, that the researchers publishing in JOI come from various backgrounds (e.g., economics, chemistry, computer science, psychology, sociology). There is one journal listed in three categories of the Social Sciences edition, namely, The World
Economy(WE), and two journals appear in both JCR edi-tions, Journal of the American Society for Information
Science and Technology (JASIST) and Scientometrics (SCIM). Similarly to JOI, these multidisciplinary journals feature authors from different backgrounds.
The journal parts considered in this study are shown in Table 3. For each journal, we retrieved the latest and every part published in HTML format. The number of retrieved articles ranged from 389 to 1,834. JOI, the newest journal in our data set, had the lowest number of articles. In addition, we note that focusing on recent articles controls for a bias
related to any potential lack of up-to-date software used for designing tables and figures in earlier sources.
Figure 1 shows that the share of single-author articles (12%–62%) was not uniform across our journals. These substantial differences may be because of the varying numbers of contributors required to complete a piece of work in the various scientific domains. Indeed, Barrios, Villarroya, and Borrego (2013) have documented a limited number of single-author articles in psychology (9%). In our data set, more than two thirds of the articles are multi-authored, except for the journal AREA (geography) in which single-author articles prevail (62%).
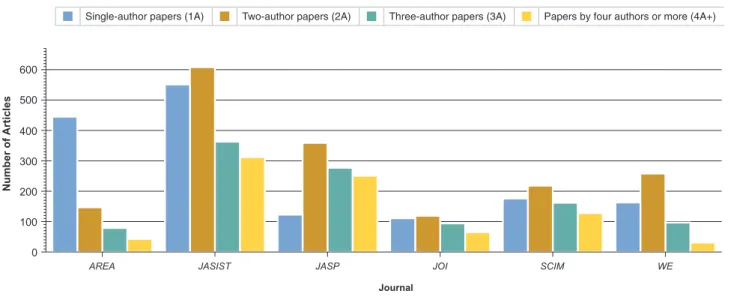
As far as the multiauthor articles are concerned, the dis-tribution of articles per number of coauthors is not uniform across journals (Figure 2). For all journals, the number of published articles is inversely proportional to the number of coauthors. In addition, there are notable differences in the formatting of articles (e.g., number of columns [one, two, or even three], fonts, and type sizes). Moreover, in this study, each journal contributes a different number of articles. Thus, it was necessary to sample articles at the journal level, as opposed to studying the distribution of tables and figures regardless of the journal in which they appeared.
We used the SOFA statistical package in this study (http://www.sofastatistics.com). For reproducibility con-cerns, the data used in this study are released as an online Supplementary Appendix, following the advice of Hanson, Sugden, and Alberts (2011).
Results
Differences in the Use of Tables
We first consider the case of tables by addressing the following question: Are there differences in the use of tables in single-author articles versus multiauthor articles (H1), as well as two-author articles (H2)?
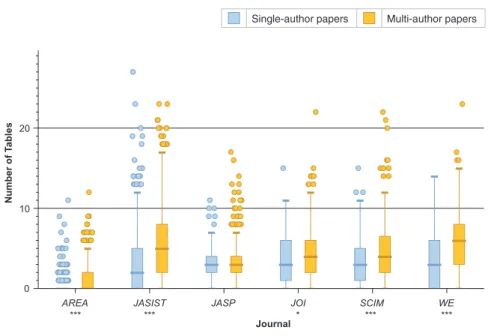
H1: There are more tables in multiauthor articles than in single-author articles.
Multiauthor articles feature more tables than single-author articles, as suggested in Figure 3. Visual inspection reveals differences between the two distributions for each journal, except for JASP. The middle 50% of the distributions, as
TABLE 2. JCReditions and categories of the six journals under study.
Journal abbreviation
Editions and categories in the JCR 2011
Social Sciences edition Science edition
AREA Geography
JASIST Information science and library science
CS, information systems
JASP Psychology, social
JOI Information science and
library science
SCIM Information science and
library science CS, interdisciplinary applications Business, finance WE Economics International relations CS = computer science.
TABLE 3. Source of the 5,180 articles under study with features of the
considered six journals.
Journal abbreviation
Volumes (issues) considered
No. of articles Single-author articles (%) Earliest Latest AREA 35(1) of 2003 45(1) of 2013 714 62 JASIST 52(14) of 2001 64(3) of 2013 1,834 30 JASP 36(12) of 2006 43(2) of 2013 1,010 12 JOI 1(1) of 2007 7(2) of 2013 389 28 SCIM 82(2) of 2010 92(3) of 2012 684 26 WE 29(12) of 2006 36(1) of 2013 549 30
showed by the boxes, is lower for single-author articles compared with multiauthor articles.
Statistics reported in Table A1 (see Appendix) confirm this visual observation. For instance, multiauthor articles in JASIST contain, on average, 1.82 more tables (+50%) than single-author articles. The difference found between single- and multiauthor articles is significant for all journals but JASP, which actually shows an average 6% decrease. H1 is thus supported for five of the six journals selected.
H2: There are more tables in two-author articles than in single-author articles.
Two-author articles still feature more tables and figures than single-author articles, as suggested by Figure 4. Visual inspection reveals differences between the two distributions for each journal. The middle 50% of the distributions is lower for single-author articles compared with multiauthor articles for all journals but JASP and JOI.
Single-author papers Multi-author papers
1400 1300 1200 1100 900 800 700 600 500 400 300 200 100 1000 0 WE SCIM JOI JASP JASIST AREA Journal Number of Articles
FIG. 1. Distribution of single-author and multiauthor articles for the six journals under study. All journals but one publish more multiauthor articles than
single-author articles (between 12% and 30%). [Color figure can be viewed in the online issue, which is available at wileyonlinelibrary.com.]
Single-author papers (1A) Two-author papers (2A) Three-author papers (3A) Papers by four authors or more (4A+)
600 500 400 300 200 100 0 WE SCIM JOI JASP JASIST AREA Journal Number of Articles
FIG. 2. Distribution of the articles according to the number of coauthors: one author (1A), two authors (2A), three authors (3A), and four or more authors
Statistics reported in Table A2 (see Appendix) confirm this visual observation. For instance, two-author articles in
JASISTcontain, on average, 1.67 more tables (+46%) than author articles. The difference found between single-and multiauthor articles is significant for all journals except
JASPand JOI. H2 is thus partly supported.
Differences in the Use of Figures
Having found a difference in the use of tables between single-author and two-author (H1) or multiauthor (H2) articles, we now repeat our study by focusing on figures (H3 and H4).
Single-author papers Multi-author papers
20 10 0 WE *** SCIM *** JOI JASP JASIST *** AREA *** Journal Number of T ables *
FIG. 3. These box plots show the number of tables in single-author versus multiauthor articles. Visual inspection and significance tests (*p < .05, **p < .01,
***p < .001) show that there are more tables in multiauthor articles when compared with single-author articles for five of six journals. H1 is thus supported. [Color figure can be viewed in the online issue, which is available at wileyonlinelibrary.com.]
Single-author papers Two-author papers
20 10 0 WE *** SCIM *** JOI JASP JASIST *** AREA *** Journal Number of T ables
FIG. 4. These box plots show the number of tables in single-author versus two-author articles. Visual inspection and significance tests (*p < .05, **p < .01,
***p < .001) show that there are more tables in two-author articles when compared with single-author articles for four of six journals. H2 is thus partially supported. [Color figure can be viewed in the online issue, which is available at wileyonlinelibrary.com.]
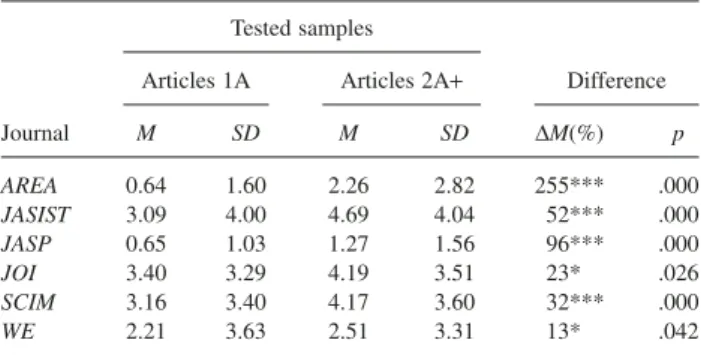
H3: There are more figures in multiauthor articles than in single-author articles.
Multiauthor articles feature more figures than single-author articles, as suggested by Figure 5. Visual inspection reveals differences between the two distributions for each journal. The middle 50% of the distributions is lower for single-author articles when compared with multisingle-author articles.
Statistics reported in Table A3 (see Appendix) confirm this visual observation. For instance, multiauthor articles in
JASISTcontain 1.60 more figures (on average +52%) than single-author articles on average. The difference found between single-author and multiauthor articles is significant for all journals. H3 is thus supported.
H4: There are more figures in two-author articles than in single-author articles.
Two-author articles still feature more tables and figures than single-author articles, as suggested by Figure 6. Visual inspection reveals differences between the two distributions for each journal. The middle 50% of the distributions is lower for single-author articles compared with multiauthor articles. Statistics reported in Table A4 (see Appendix) confirm this visual observation. For instance, two-author articles in
JASISTcontain 1.07 more figures (+35%) than single-author articles on average. The difference found between single-author and multisingle-author articles is significant for all journals but JASP and WE, which nonetheless show an 8% increase on average. H4 is thus supported.
Discussion and Concluding Remarks
The two main findings from this study are the following:
• Authors in groups use significantly more tables than single authors (H1). Indeed, this is also noticeable between paired
and single authors (H2). For instance, in JASIST, authors in groups use 50% more tables than single authors in their articles.
• Authors in groups use significantly more figures than single authors (H3). This is also noticeable between paired and single authors (H4). For instance, in JASIST, authors in groups use 52% more figures than single authors in their articles.
This balance between the use of tables and graphs by single and multiple authors is present in JASIST. Some other journals, however, feature a different balance, such as WE. In WE, the difference in the use of tables (48%) is larger than the difference in the use of figures (13%).
These findings, although clear, require some explanation. We need to consider the role of tables and figures in aca-demic articles and, more especially, features of writing together versus writing alone.
Role of Tables and Figures
There is considerable literature about what tables and figures (and their derivatives) are actually for, and when a table is more appropriate than a graph, and vice versa (e.g., see Durbin, 2004; Kastellec & Leoni, 2007; Vessey & Galletta, 1991). The Publication Manual of the American
Psychological Association provides recommendations regarding the use of tables and figures, and how they should be presented (American Psychological Association, 2010, Chapter 5). Generally speaking, it is suggested that tables are best when one wants to present/retrieve exact numbers and that graphs are best at showing trends. However, some authors (e.g., Gelman, Pasarica, & Dodhia, 2002; Kastellec & Leoni, 2007) advocate turning tables into graphs to improve the presentation of results. Gelman et al.
Single-author papers Multi-author papers
30 20 10 0 WE * SCIM *** JOI JASP *** JASIST *** AREA *** Journal Number of Figures *
FIG. 5. These box plots show the number of figures in single-author versus multiauthor articles. Visual inspection and significance tests (*p < .05,
**p < .01, ***p < .001) show that there are more figures in multiauthor articles when compared with single-author articles for all journals. H3 is thus supported. [Color figure can be viewed in the online issue, which is available at wileyonlinelibrary.com.]
demonstrate the effects of doing this with graphs and tables from The American Statistician. As an aside, we might note here that Tartanus, Wnuk, Kozak, and Hartley (2013) found that agricultural journals containing a higher number of graphs had higher impact factors than did those with a smaller number. Furthermore, Gelman et al. (2002) and Hartley (2012) both argue that increasing the caption lengths to explain more fully what the data actually show can increase the readers’ comprehension of both tables and figures.
Collaborative Writing and Authors’ Features and Skills
The earlier findings suggest that groups of authors use more tables and figures in their articles than single authors. The question is, of course, why do such results occur?
Earlier (see Introduction) we outlined how we as authors had set about writing this article. We now want to note how this description, although perhaps helpful at the time to the reader, appears to give no more than one freeze frame from a lengthy film and that any bland description of how two (or more) authors collaborate cannot be the same for everyone. As Noël and Robert (2004) point out, there are too many sets of multiple and overlapping variables. Different authors in a team may differ in terms of age, sex, nationality, background knowledge on the topic, discipline, and mathematical, com-puting, statistical, and verbal skills, and so on. Some may work together in the same office (e.g., Gilles and Guil-laume), some may never have met in person the other authors with whom they collaborate (e.g., James and Gilles), and some may be close friends (e.g., Guillaume and Gilles). Some may prefer graphical complexity (e.g., Guillaume and
Gilles) to verbal simplicity (e.g., James). And, finally, none of us has used any of the more complex computer-based tools written to facilitate coauthorship (e.g., see Churchill, Trevor, Bly, Nelson, & Cubranic, 2000; Noël & Robert, 2004; Sharples, 1999).
The more authors there are the more substantial is the mix of these multifaceted attributes. In writing this article, Gilles and Guillaume have tended to talk about tables and graphs supporting collaboration in writing research articles as though they emerge in some way out of the collaboration. In contrast, James has preferred to think that those with a visual bent can help make the verbally-oriented writer clearer, and that such people will bring these tools “ready-made” as it were. It would indeed be interesting to discuss these issues further with other groups of coauthors or trace the history of particular articles written in different ways by different groups of authors. Table 4 lists some recent related studies in this respect, and it is interesting to note that these studies about how and why tables and figures support collaboration in academic writing call for additional, qualitative research.
Single-author papers Two-author papers
20 10 0 WE SCIM ** JOI JASP *** JASIST *** AREA *** Journal Number of Figures
FIG. 6. These box plots show the number of figures in single-author versus two-author articles. Visual inspection and significance tests (*p < .05, **p < .01,
***p < .001) show that there are more figures in two-author articles when compared with single-author articles for four of six journals. H4 is thus partially supported. [Color figure can be viewed in the online issue, which is available at wileyonlinelibrary.com.]
TABLE 4. Some representative reports on how jointly written articles and
book chapters have been written.
Articles Chapters
Katz & Martin, 1997 Sharples, 1999
Noël & Robert, 2004 MacArthur, 2006
Rigby & Edler, 2005 Moore & Barrett, 2010
Wyatt, Gale, Gannon, & Davies, 2010 Nevin, Thousand, & Villa, 2011
Hurford & Read, 2011 Badenhorst et al., 2013 Egghe, Guns, & Rousseau, 2013
References
Aamodt, K., Abel, N., Abeysekara, U., Abrahantes Quintana, A., Acero, A., Adamová, D., . . . Zychácˇek, V. (2010). First proton–proton collisions at the LHC as observed with the ALICE detector: Measurement of the
charged-particle pseudorapidity density at s = 900GeV. The European
Physical Journal C, 65(1–2), 111–125. doi: 10.1140/epjc/s10052-009-1227-4
Abt, H.A. (2007). The future of single-authored papers. Scientometrics, 73(3), 353–358. doi:10.1007/s11192-007-1822-9
Adiga, N., Almasi, G., Almasi, G., Aridor, Y., Barik, R., Beece, D., . . . Yates, K. (2002). An overview of the BlueGene/L supercomputer. In Sc’02: Proceedings of the 2002 ACM/IEEE Conference on Supercom-puting (pp. 1–22). Los Alamitos, CA: IEEE Computer Society Press. American Psychological Association. (2010). Publication Manual of the
American Psychological Association (6th ed.). Washington, DC: American Psychological Association.
Badenhorst, C.M., Penney, S., Pickett, S., Joy, R., Hesson, J., Young, G., . . . Li, X. (2013). Writing relationships: Collaboration in a faculty writing group. The All Ireland Journal of Teaching and Learning in Higher Education, 5(1).
Bahr, A.H., & Zemon, M. (2000). Collaborative authorship in the journal literature: Perspectives for academic librarians who wish to publish. College & Research Libraries, 61(5), 410–419.
Barrios, M., Villarroya, A., & Borrego, A. (2013). Scientific production in psychology: A gender analysis. Scientometrics, 95(1), 15–23. doi: 10.1007/s11192-012-0816-4
Bridgstock, M. (1991). The quality of single and multiple authored papers: An unresolved problem. Scientometrics, 21(1), 37–48. doi:10.1007/ BF02019181
Cabanac, G., & Hartley, J. (2013). Issues of work-life balance among JASIST authors and editors. Journal of the American Society for Infor-mation Science and Technology, 64(10), 2182–2186. doi:10.1002/ asi.22888
Churchill, E.F., Trevor, J., Bly, S., Nelson, L., & Cubranic, D. (2000, April). Anchored conversations: Chatting in the context of a document. In CHI’00: Proceedings of the SIGCHI Conference on Human Factors in Computing Systems (pp. 454–461). New York: ACM Press. doi:10.1145/ 332040.332475
Cronin, B. (2001). Hyperauthorship: A postmodern perversion or evidence of a structural shift in scholarly communication practices? Journal of the American Society for Information Science and Technology, 52(7), 558– 569. doi:10.1002/asi.1097
Cronin, B. (2005). The hand of science: Academic writing and its rewards (pp. 41–70). Lanham, MD: Scarecrow Press.
Durbin, C.G. (2004). Effective use of tables and figures in abstracts, pre-sentations, and papers. Respiratory Care, 49(10), 1233–1237. Egghe, L., Guns, R., & Rousseau, R. (2013). Measuring co-authors’
contribution to an article’s visibility. Scientometrics, 95(1), 55–67. doi:10.1007/s11192-012-0832-4
Figg, W.D., Dunn, L., Liewehr, D.J., Steinberg, S.M., Thurman, P.W., Barrett, J.C., & Birkinshaw, J. (2006). Scientific collaboration results in higher citation rates of published articles. Pharmacotherapy, 26(6), 759– 767. doi:10.1592/phco.26.6.759
Foster, I., Gieraltowski, J., Gose, S., Maltsev, N., May, E., Rodriguez, A., . . . Sheldon, P. (2004). The Grid2003 production grid: Principles and practice. In HPDC’04: Proceedings of the 13th IEEE International
Symposium on High Performance Distributed Computing (pp.
236–245). Washington, DC: IEEE Computer Society. doi:10.1109/ HPDC.2004.36
Gelman, A., Pasarica, C., & Dodhia, R. (2002). Let’s practice what we preach: Turning tables into graphs. The American Statistician, 56(2), 121–130. doi: 10.1198/000313002317572790
Hanson, B., Sugden, A., & Alberts, B. (2011). Making data maximally available. Science, 331(6018), 649. doi:10.1126/science.1203354 Hartley, J. (2003). Single authors are not alone: Colleagues sometimes help.
Journal of Scholarly Publishing, 34(2), 108–113.
Hartley, J. (2005). Refereeing and the single author. Journal of Information Science, 31(3), 251–256. doi:10.1177/0165551505052474
Hartley, J. (2012). New ways of making academic articles easier to read. International Journal of Clinical and Health Psychology, 12(1), 143–160.
Hurford, D., & Read, A. (2011). Working collaboratively: Reflecting on unexpected outcomes. Brookes eJournal of Learning and Teaching, 3(2).
Kastellec, J.P., & Leoni, E.L. (2007). Using graphs instead of tables in political science. Perspectives on Politics, 5(4), 755–771. doi:10.1017/ S1537592707072209
Katz, J.S., & Martin, B.R. (1997). What is research collaboration? Research Policy, 26(1), 1–18. doi:10.1016/S0048-7333(96)00917-1
Kosmulski, M. (2012). The order in the lists of authors in multi-author papers revisited. Journal of Informetrics, 6(4), 639–644. doi:10.1016/ j.joi.2012.06.006
Lewison, G., & Hartley, J. (2005). What’s in a title? Numbers of words and the presence of colons. Scientometrics, 63(2), 341–356. doi:10.1007/ s11192-005-0216-0
MacArthur, C.A. (2006). The effects of new technologies on writing and writing processes. In C.A. MacArthur, S. Graham, & J. Fitzgerald (Eds.), Handbook of writing research (pp. 248–263). New York: Guildford. Moore, S., & Barrett, T. (2010). How we wrote this book: A PBL approach to
collaborative writing. In T. Barrett & S. Moore (Eds.), New approaches to problem-based learning (pp. 266–278). London: Routledge.
Nevin, A.I., Thousand, J.S., & Villa, R.A. (2011). Working with coauthors. In T.S. Rocco & T. Hatcher (Eds.), The handbook of scholarly writing and publishing (pp. 274–292). San Francisco: Jossey-Bass.
Noël, S., & Robert, J.-M. (2004). Empirical study on collaborative writing: What do co-authors do, use, and like? Computer Supported Cooperative Work, 13(1), 63–89. doi:10.1023/B:COSU.0000014876.96003.be Price, D.d.S. (1963). Little science, big science. New York: Columbia
University Press.
Rennie, D., Yank, V., & Emanuel, L. (1997). When authorship fails: A proposal to make contributors accountable. Journal of the American
Medical Association, 278(7), 579–585. doi:10.1001/jama.1997.
03550070071041
Rigby, J., & Edler, J. (2005). Peering inside research networks: Some observations on the effect of the intensity of collaboration on the variability of research quality. Research Policy, 34(6), 784–794. doi:10.1016/j.respol.2005.02.004
Sharples, M. (1999). Writing together. In M. Sharples (Ed.), How we write: Writing as creative design (pp. 168–186). London: Routledge. Skilton, P.F. (2009). Does the human capital of teams of natural science
authors predict citation frequency? Scientometrics, 78(3), 525–542. doi:10.1007/s11192-007-1953-z
Speck, B.W., Johnson, T.R., Dice, C.P., & Heaton, L.B. (Eds.). (1999). Collaborative writing: An annotated bibliography. Wesport, CT: Green-wood Press.
Tartanus, M., Wnuk, A., Kozak, M., & Hartley, J. (2013). Graphs and prestige in agricultural journals. Journal of the American Society for Information Science and Technology, 64(9), 1946–1950. doi:10.1002/ asi.22868
Tregenza, T. (2002). Gender bias in the refereeing process? Trends
in Ecology & Evolution, 17(8), 349–350.
doi:10.1016/S0169-5347(02)02545-4
Vessey, I., & Galletta, D. (1991). Cognitive fit: An empirical study of information acquisition. Information Systems Research, 2(1), 63–84. doi:10.1287/isre.2.1.63
Waltman, L. (2012). An empirical analysis of the use of alphabetical authorship in scientific publishing. Journal of Informetrics, 6(4), 700– 711. doi:10.1016/j.joi.2012.07.008
Wyatt, J., Gale, K., Gannon, S., & Davies, B. (2010). Deleuzian thought and collaborative writing: A play in four acts. Qualitative Inquiry, 16(9), 730–741. doi:10.1177/1077800410374299
Yitzhaki, M. (1994). Relation of title length of journal articles to number of authors. Scientometrics, 30(1), 321–332. doi:10.1007/BF02017231
Supporting Information
Additional supporting information may be found in the online version of this article at the publisher’s website:
Appendix. Detailed results.
TABLE A1. Testing of H1: Are there more tables in multiauthor articles
(2A+) when compared with single-author articles (1A)?
Journal
Tested samples
Difference
Articles 1A Articles 2A+
M SD M SD ΔM(%) p AREA 0.43 1.26 1.47 2.15 241*** .000 JASIST 3.62 4.48 5.44 4.57 50*** .000 JASP 3.26 2.25 3.07 2.16 −6 .336 JOI 3.70 3.33 4.50 3.68 22* .044 SCIM 3.56 3.07 4.75 3.35 33*** .000 WE 3.79 3.50 5.62 3.75 48*** .000
Note. The table reports means (M), standard deviations (SD), difference
in means (ΔM), and the significance of the difference between the two distributions (p value) according to the U test (two-tailed).
Significance: *p < .05, ***p < .001.
TABLE A2. Testing of H2: Are there more tables in two-author articles
(2A) when compared with single-author articles (1A)?
Journal Tested samples Difference Articles 1A Articles 2A M SD M SD ΔM(%) p AREA 0.43 1.26 1.25 2.23 190*** .000 JASIST 3.62 4.48 5.29 4.57 46*** .000 JASP 3.26 2.25 2.98 2.08 −9 .220 JOI 3.70 3.33 3.98 3.50 8 .537 SCIM 3.56 3.07 4.88 3.37 37*** .000 WE 3.79 3.50 5.60 3.88 48*** .000
Note. The table reports means (M), standard deviations (SD), difference
in means (ΔM), and the significance of the difference between the two distributions (p value) according to the U test (two-tailed).
Significance: ***p < .001.
TABLE A3. Testing of H3: Are there more figures in multiauthor articles
(2A+) when compared with single-author articles (1A)?
Journal
Tested samples
Difference
Articles 1A Articles 2A+
M SD M SD ΔM(%) p AREA 0.64 1.60 2.26 2.82 255*** .000 JASIST 3.09 4.00 4.69 4.04 52*** .000 JASP 0.65 1.03 1.27 1.56 96*** .000 JOI 3.40 3.29 4.19 3.51 23* .026 SCIM 3.16 3.40 4.17 3.60 32*** .000 WE 2.21 3.63 2.51 3.31 13* .042
Note. The table reports means (M), standard deviations (SD), difference
in means (ΔM), and the significance of the difference between the two distributions (p value) according to the U test (two-tailed).
Significance: *p < .05, ***p < .001.
TABLE A4. Testing of H4: Are there more figures in two-author articles
(2A) when compared with single-author articles (1A)?
Journal
Tested samples
Difference
Articles 1A Articles 2A+
M SD M SD ΔM(%) p AREA 0.64 1.60 1.88 2.52 196*** .000 JASIST 3.09 4.00 4.16 3.98 35*** .000 JASP 0.65 1.03 1.23 1.57 89*** .000 JOI 3.40 3.29 4.02 3.13 18 .069 SCIM 3.16 3.40 4.07 3.73 29** .004 WE 2.21 3.63 2.39 3.15 8 .089
Note. The table reports means (M), standard deviations (SD), difference
in means (ΔM), and the significance of the difference between the two distributions (p value) according to the U test (two-tailed).