To link to this article: DOI:10.4028/www.scientific.net/MSF.794-796.205 http://dx.doi.org/10.4028/www.scientific.net/MSF.794-796.205
This is an author-deposited version published in: http://oatao.univ-toulouse.fr/ Eprints ID: 13670
To cite this version:
Guérin, Mathilde and Andrieu, Eric and Odemer, Grégory and Alexis, Joël and Blanc, Christine Effect of the microstructure and environmental
exposure conditions on the corrosion behaviour of the 2050 alloy. (2014)
Materials Science Forum, vol. 794-796. pp. 205-210. ISSN 0255-5476
O
pen
A
rchive
T
oulouse
A
rchive
O
uverte (
OATAO
)
OATAO is an open access repository that collects the work of Toulouse researchers and makes it freely available over the web where possible.
Any correspondence concerning this service should be sent to the repository administrator: [email protected]
Effect of the microstructure and environmental exposure conditions
on the corrosion behaviour of the 2050 alloy
Mathilde Guérin
1, a *, Eric Andrieu
1, b,
Grégory Odemer
1, c, Joël Alexis
2, dand Christine Blanc
1, e1
Université de Toulouse, Institut CARNOT CIRIMAT, UPS/CNRS/INPT, ENSIACET, 4 allée Emile Monso, 31030 Toulouse Cedex 4, France
2
Université de Toulouse, LGP, ENIT/INPT, 47 Avenue d’Azereix, 65016 Tarbes, France
a
[email protected], [email protected], [email protected],
d
[email protected], [email protected] *corresponding author
Keywords: aluminium alloys, ageing, corrosion, immersion-emersion tests, grain boundaries.
Abstract. Alternate immersion-emersion tests were performed for a 2050 aluminium alloy to
characterize its corrosion resistance with exposure conditions representative of in service-conditions. Tests were performed for T34 samples and aged samples. After continuous immersion tests, T34 samples exhibited intergranular corrosion while intragranular corrosion was observed for aged samples. The alternate immersion-emersion tests led to a corrosion extension to the subgrain boundaries, for both T34 and aged samples, as shown by electron backscattered diffraction analysis.
Introduction
To reduce in weight aircraft metallic structures, new aluminium alloys are developed, e.g. the third generation aluminium-copper-lithium alloys [1]. Among these alloys, the Al-Cu-Li 2050 alloy is a very promising material but, depending on its metallurgical state, localized corrosion features (pitting, intragranular or intergranular corrosion) can be observed for this alloy due to its heterogeneous microstructure [2-3]. Al-Cu-Li alloys are precipitation-hardening alloys; the main
strengthening phases can be T1 (of nominal composition Al2CuLi) and those of the θ’ sequence
(with its metastable precursors) (Al2Cu) [4]. Since the intermetallics do not have the same
electrochemical reactivity as the matrix, galvanic coupling can occur at the microstructural scale leading to the localized corrosion morphology previously listed. Coarse intermetallic particles are mainly responsible for pitting [5-6]. The effect of the precipitation of finer intermetallics in
Al-Cu-Li alloys on their corrosion behaviour was also studied [2, 5, 7-8]. T1 precipitates were found to
have a more negative corrosion potential than the matrix and were associated with dissolution phenomena such as intergranular corrosion [7-8]. It is worth noticing that most of the studies focused on the corrosion behaviour of Al-Cu-Li alloys are mainly related to continuous immersion tests, but throughout their life, aircraft structures are cyclically exposed to corrosive environment [9]. The aim of this work is to study the effect of exposure conditions to the aggressive media on the corrosion susceptibility of the 2050 alloy. To reproduce as closely as possible the environmental exposure conditions of the structural parts of an aircraft, cyclic corrosion tests with alternate immersion and emersion phases were conducted. Results were analyzed taking into account the microstructure of the alloy; to better understand the results, the 2050 alloy was studied in two metallurgical states, a T34 under peak aged state and a near peak aged state.
Experimental
Material. The material consisted of a 50-mm thick rolled plate of AA 2050 alloy (Al-3.5%
treated, quenched, stretched and naturally aged). To study the influence of an ageing treatment on the corrosion behaviour of AA 2050, T34 samples were aged at 155°C for 30 hours at a heating ramp of 20°C/h. In the following text, samples in the T34 metallurgical state and aged samples are referred to as NHT (non-heat treated) and HT (heat-treated), respectively. The grain structure revealed by Keller’s etching corresponded to grains elongated in the longitudinal (L) direction, with, independently of the ageing treatment, average grain sizes larger than 500, 350 and equal to about 60 µm in the L, long transverse (LT) and short transverse (ST) directions respectively.
Corrosion tests. All corrosion tests were performed in a 0.7 M NaCl solution on samples
extracted from the core of the plate. The exposed area of each sample was 1 cm². The ST-LT plane was exposed to the electrolyte in order to quantify the corrosion induced damage propagating in the L direction. Before corrosion tests, the samples were mechanically abraded up to 4000 grade, then polished with 3 µm and 1 µm diamond paste, rinsed in distilled water and air-dried. The temperature of both the laboratory room and the electrolyte was controlled and maintained at 22°C. Three exposure conditions were studied. A cyclic corrosion test (CR test) consisted of three cycles of 24 hours; each cycle was composed of a 3 hours immersion in the electrolyte followed by a 5 hours dry period at the temperature of the laboratory room, then 2 hours immersion period and finally a 14 hours dry period. Two continuous immersion tests (CI tests) were considered as references. The first lasted 15 hours (CI 15h) which corresponded to the cumulated time of immersion for the cyclic corrosion tests and the second lasted 72 hours (CI 72h) which corresponded to the duration of the whole cyclic corrosion test. After the corrosion tests, each cubic sample was cut along the L-ST plane to obtain several slices; each slice was polished down to 1 µm diamond paste and then observed using an optical microscope. To describe the corrosion morphology, two parameters were statistically determined: the number of corrosion defects propagating in the L direction and observed for a given distance in the ST direction (density of corrosion defects) and the average depth of corrosion defects in the L direction. Taking into account the cumulated length of corroded surface observed in the ST direction, i.e. 80 mm, and the grain size in this direction (about 60 µm), almost 1000 grain boundaries and grains were observed for each test. A Scanning Electron Microscope (ZEISS EVO HD LS15; incident electron beam kept at 15 kV) was used to carefully examine corrosion defects. Each corrosion test was replicated 3 times.
Electron Backscattered Diffraction experiments. EBSD scans were performed on L-ST and
LT-ST planes of the samples by means of a JEOL 7000F field emission gun SEM at an accelerating voltage of 15 kV with a Nordlys II F+ camera. Before corrosion tests, measurements were carried
out with a step size of 1 µm for the 1000 * 2000 µm2 maps. More precise maps were also obtained
around corrosion defects with a step size of 0.5 µm. The orientation data were post-processed with the commercial orientation imaging software package Oxford Channel 5. The Inverse Pole Figure (IPF) maps represent the crystal orientation parallel to the sample surface normal.
Results and discussion
Corrosion behaviour of 2050 alloy during continuous immersion tests. After CI tests, NHT
samples were found to be susceptible to intergranular corrosion (Fig. 1a and c); the corrosion defects depth in the L direction and their width in the ST direction increased when the duration of the corrosion test increased with corrosion defects propagating faster in the L direction. For HT samples, intragranular corrosion, characterized by the dissolution of the whole grain (Fig. 1b and d), was evidenced. When the immersion time increased, intragranular corrosion defects propagated both in the L and ST direction in agreement with the grain morphology. Results obtained concerning the corrosion morphology of NHT and HT samples were in good agreement with literature data obtained for another heat of 2050 alloy [8]. In this previous work [8], results showed that, for the
grain boundaries was promoted due the more negative corrosion potential of T1 precipitates
compared to that of the aluminium matrix. When the NHT samples were aged, the density and size
of T1 precipitates in the grain boundaries increased but numerous T1 precipitates also formed inside
the grains. Therefore, both the corrosion potentials of the grain boundaries and the grains became more negative with a decrease of the difference between the two corrosion potential values. The galvanic coupling effect between the grains and the grain boundaries was reduced so that intergranular corrosion did not occur. Moreover, with a more negative potential due to the presence
of T1 precipitates and to a lower copper content, the grains in the HT samples were more reactive
leading to intragranular corrosion. In the present study, transmission electron microscopy observations were performed for both NHT and HT samples. For HT samples, results were in
agreement with literature data [8]; for NHT samples, no T1 precipitates were observed at the grain
boundaries. This suggested that the susceptibility to intergranular corrosion of 2050 alloy could be
explained taking into account the presence of T1 precipitates at the grain boundaries but this was not
mandatory. Intergranular corrosion could be also observed in the absence of T1 precipitates at the
grain boundaries. In this case, the anodic behaviour of the grain boundaries could be attributed to the segregation of alloying elements. Further analyses are in progress to validate this hypothesis.
Figure 1. NHT a) and HT b) samples after CI 15h. NHT c) and HT d) samples after CI 72h.
Figure 2. Propagation depth along L direction for a) NHT and c) HT samples. Density of corrosion
defects in the ST direction for b) NHT and d) HT samples.
Fig. 2 shows the average, maximum and minimum values for the propagation depth in the L direction and the density of corrosion defects in the ST direction for both NHT and HT samples after CI tests. Because the distributions of the values were not normal, this representation was chosen for each set of data and the standard deviations were not given. For both samples, the results obtained for the average propagation depth of the corrosion defects were in good agreement with previous observations (Fig. 1). For NHT samples, the average propagation depth increased from 115 µm to 160 µm after CI 15 h and CI 72 h respectively. For HT samples, similar values were obtained for the average propagation depth. Concerning the density of corrosion defects, it surprisingly decreased when the immersion time increased for NHT samples while it was logically found to increase for HT samples. These results evidenced that the characterization of the morphology of corrosion defects by using optical observation of the corroded surface is very difficult as shown by a previous study performed on a 2024 alloy [10]. Even though more than 1000 grain boundaries were observed for each sample, it was probably not enough to take into account the large distribution of
the corrosion defect depths and the heterogeneous distribution of the corrosion defects on the sample surface. Therefore, it was assumed that the errors on the previous corrosion depths could be significant. Additional tensile tests were therefore performed on pre-corroded NHT and HT samples to validate the corrosion depth measurements [10]. Results showed that the corrosion depth values obtained for both NHT and HT samples after continuous immersion tests were relevant.
Corrosion behaviour of 2050 alloy during cyclic corrosion tests. Optical micrographs of NHT
and HT samples show that a CR test (Fig. 3) leads to an evolution of the corrosion morphology compared to CI tests (Fig. 1). After a CR test, intergranular corrosion was still observed for NHT samples but the corrosion defects were thinner (in the ST direction) and more branched (Fig. 3a). Fig. 2 shows that their average depth in the L direction was higher; after a CR test, it was equal to 180 µm, for a total immersion time of 15 hours, while, after CI 15h and CI 72h, it was equal to 115 and 160 µm respectively. The density of corroded grain boundaries was increased with cyclic corrosion tests. Fig. 3c suggested that the branching could be attributed to both an extent of the corrosion to a larger number of grain boundaries but also to the dissolution of subgrain boundaries. For HT samples, Fig. 3b and d show that intragranular corrosion was still observed after CR tests but intergranular corrosion and/or corrosion of subgrain boundaries were also observed. Fig. 2 shows that the average depth of the corrosion defects in the L direction was lower after CR tests by comparison with CI tests while the density of the corrosion defects was significantly increased.
Figure 3. Optical micrographs of 2050 alloy samples after cyclic corrosion tests. a) NHT sample b)
HT sample. Zoom on corrosion defects for c) NHT and d) HT samples.
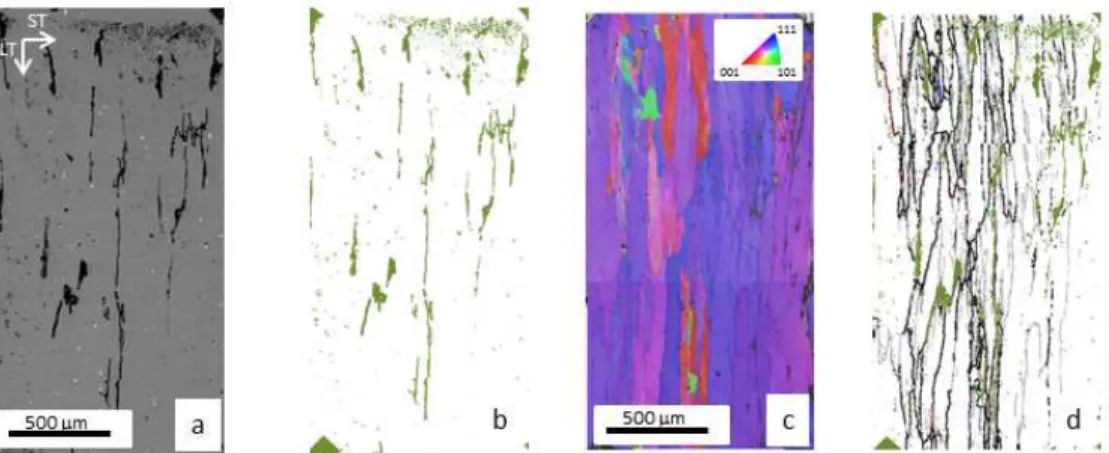
Figure 4. Analysis of a NHT sample after a CI test in a well-identified zone. a) SEM observation of
the corrosion defect, backscattered electron image b) ‘corrosion map’ c) IPF-z0 d) identification of the interfaces (grain boundaries in black or in colour and subgrain boundaries in grey)
To better characterize the evolution of the corrosion defect morphology after CR tests, EBSD experiments were performed on both CI and CR samples. Fig. 4 illustrates the methodology used. In a first step, several zones were accurately localized. For each zone, IPF-z0 were plotted to reveal the
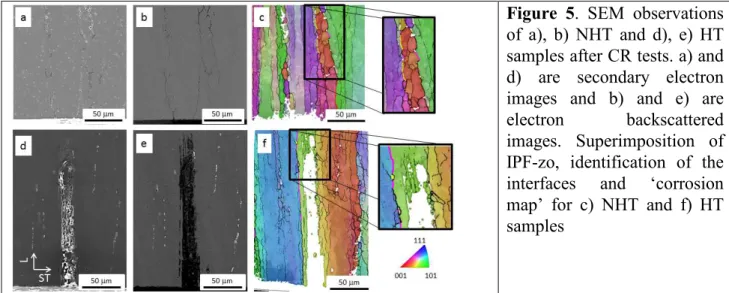
grain and subgrains (Fig. 4c) and the misorientations were calculated to differentiate grain boundaries and subgrain boundaries. Interfaces are considered as grain boundaries for misorientations higher than 10° and subgrain boundaries for misorientations from 2 to 10°. Then, the sample was slightly polished, submitted to the corrosion test, rinsed and dried. All the zones previously localized were observed using a SEM in the backscattered electron mode (Fig. 4a) to easily evidence the corrosion defects due to the presence of corrosion products. SEM micrographs were then analyzed using an Image analysis software (Image J) and the corrosion defects were highlighted (Fig. 4b) to obtain a ‘corrosion map’. This map was superimposed on the IPF-z0 (Fig. 4c and d) to determine the nature of the corroded ‘object’ (interface or grain) and of the corroded interface (grain boundaries or subgrain boundaries). This methodology was applied for NHT and HT samples after CI and CR tests. Results showed that, after CI tests, corrosion defects were localized at the grain boundaries for NHT samples while, for HT samples, corrosion propagated inside the grains in good agreement with observations shown in Fig. 1. EBSD analysis confirmed that cyclic corrosion tests led to a modification of the corrosion morphology by comparison to continuous immersion tests. After CR tests, for NHT samples, corrosion extended to the subgrain boundaries (Fig. 5a, b and c). For HT samples, intragranular corrosion was still observed but a few grain boundaries and a large amount of subgrain boundaries were found to be corroded (Fig. 5d, e and f). For NHT samples, the extension of the corrosion to the subgrain boundaries leading to more branched corrosion defects could be explained by taking into account the evolution during the emersion period of the chemical composition of the electrolyte trapped inside the corrosion defects. Partial drying of the corrosion products led to an increase of the chloride concentration inside the corrosion defects. The electrolyte became more aggressive allowing the dissolution of the subgrain boundaries and promoting the propagation of the corrosion defects which were found to be deeper (Fig. 2). For HT samples, the increase of the aggressiveness of the electrolyte trapped inside the corrosion defects also led to the corrosion of the subgrain boundaries and even of some grain boundaries so that both intragranular and ‘intergranular’ corrosion were observed. The corrosion of the grains was also promoted but in the ST direction so that, after CR tests, the average depth of the corrosion defects in the L direction was lower compared to CI tests (Fig. 2).
Figure 5. SEM observations
of a), b) NHT and d), e) HT samples after CR tests. a) and d) are secondary electron images and b) and e) are
electron backscattered
images. Superimposition of IPF-zo, identification of the
interfaces and ‘corrosion
map’ for c) NHT and f) HT samples
Additional tensile tests were performed for corroded samples after CR tests and confirmed that CR tests were more damaging than CI tests leading to a greater decrease of the mechanical properties compared to CI tests. For NHT samples, this was in good agreement with an increase of the corrosion defects density and depth and the extension of the corrosion to the subgrain boundaries. For HT samples, this could be explained also by the extension of the corrosion to the subgrain boundaries; however, the decrease of the mechanical properties was significant by comparison to CI tests and this seemed surprising taking into account the depth of the corrosion
defects. Hydrogen content of the corroded samples was measured and preliminary results seemed to show a hydrogen enrichment for both NHT and HT samples after CR tests which could explain the strong decrease of the mechanical properties and could be linked to the extension of the corrosion to the subgrain boundaries. This result could be compared to those obtained for 2024 alloy [9]. Additional experiments are in progress to confirm this assumption.
Conclusions
The 2050 aluminium alloy is susceptible to intergranular corrosion or intragranular corrosion
depending on its metallurgical state, and mainly on the distribution of T1 precipitates; but
segregation of alloying elements has also to be taken into account. The exposure conditions to the aggressive environment are another first order parameter. Alternate immersion-emersion tests can generate an extension of the corrosion to the subgrain boundaries even for a metallurgical state that generates only intragranular corrosion during continuous immersion tests.
Acknowledgment
The Région Midi-Pyrénées financially supported this work. The authors thank Dr J. Delfosse (EADS IW, France) and Dr C. Henon (Constellium, France) for fruitful discussions.
References
[1] R. J. Rioja, J. Liu, Evolution of Al–Li base products for aerospace and space applications, Metall. Mater. Trans. A 43A (2012) 3325-3337.
[2] J.E Kertz, P.I Gouma, R.G. Buchheit, Localized Corrosion Susceptibility of Al-Li-Cu-Mg-Zn Alloy AF/C458 due to Interrupted Quenching from Solutionizing Temperatures, Metall. and Mater. Trans. A 33 (2001) 2561-2573.
[3] N. Jiang, J. F. Li, Z. Q. Zheng, Effect of aging on mechanical properties and localized corrosion behaviors of Al-Cu-Li alloy, Transactions of non ferrous metals society of China 15 (2005) 23-29. [4] B. Decreus, A. Deschamps, F. De Geuser, P. Donnadieu, C. Sigli, M. Weyland, The influence of Cu/Li ratio on precipitation in Al–Cu–Li–x alloys, Acta Mater. 61 (2013) 2207-2218.
[5] R.G. Buchheit, J.P. Moran, G.E. Stoner, Localized corrosion behavior of alloy 2090-the role of microstructure heterogeneity, Corrosion 46 (1990) 610-617.
[6] F. Viejo, A.E. Coy, F.J. Garcia, Z. Liu, P. Skeldon, G.E. Thompson, Relationship between microstructure and corrosion performance of AA2050-T8 aluminium alloy after excimer laser surface melting, Corros. Sci. 52 (2010) 2179-2187.
[7] C. Henon, S. Rouault, Comparison of corrosion performance and mechanisms of Al-Cu alloys with and without Li addition, Proceeding of the 13th International Conference on aluminium alloys, TMS, Pittsburgh, USA, 2012.
[8] V. Proton, J. Alexis, E. Andrieu, J. Delfosse, A. Deschamps, F. De Geuser, M.-C. Lafont, C. Blanc, The influence of artificial ageing on the corrosion behaviour of a 2050 aluminium-copper-lithium alloy, Corros. Sci. 80 (2014) 494-502.
[9] C. Larignon, J. Alexis, E. Andrieu, C. Blanc, G. Odemer, J.-C. Salabura, Corrosion Damages Induced by Cyclic Exposure of 2024 Aluminum Alloy in Chloride-Containing Environments, J. Electrochem. Soc. 58 (2011) C284-C295.
[10] C. Augustin, E. Andrieu, C. Blanc, J. Delfosse, G. Odemer, Empirical Propagation Laws of Intergranular Corrosion Defects Affecting 2024 T351 Alloy in Chloride Solutions, J. Electrochem. Soc. 157 (2010) C428-436.
Aluminium Alloys 2014 - ICAA14
10.4028/www.scientific.net/MSF.794-796
Effect of the Microstructure and Environmental Exposure Conditions on the Corrosion Behaviour of the 2050 Alloy
10.4028/www.scientific.net/MSF.794-796.205
DOI References
[2] J. E Kertz, P. I Gouma, R.G. Buchheit, Localized Corrosion Susceptibility of Al-Li-Cu-Mg-Zn Alloy AF/C458 due to Interrupted Quenching from Solutionizing Temperatures, Metall. and Mater. Trans. A 33 (2001) 2561-2573.
http://dx.doi.org/10.1007/s11661-001-0046-5
[4] B. Decreus, A. Deschamps, F. De Geuser, P. Donnadieu, C. Sigli, M. Weyland, The influence of Cu/Li ratio on precipitation in Al-Cu-Li-x alloys, Acta Mater. 61 (2013) 2207-2218.
http://dx.doi.org/10.1016/j.actamat.2012.12.041
[5] R.G. Buchheit, J.P. Moran, G.E. Stoner, Localized corrosion behavior of alloy 2090-the role of microstructure heterogeneity, Corrosion 46 (1990) 610-617.
http://dx.doi.org/10.5006/1.3585156
[6] F. Viejo, A.E. Coy, F.J. Garcia, Z. Liu, P. Skeldon, G.E. Thompson, Relationship between microstructure and corrosion performance of AA2050-T8 aluminium alloy after excimer laser surface melting, Corros. Sci. 52 (2010) 2179-2187.
http://dx.doi.org/10.1016/j.corsci.2010.03.003
[8] V. Proton, J. Alexis, E. Andrieu, J. Delfosse, A. Deschamps, F. De Geuser, M. -C. Lafont, C. Blanc, The influence of artificial ageing on the corrosion behaviour of a 2050 aluminium-copperlithium alloy, Corros. Sci. 80 (2014) 494-502.