O
pen
A
rchive
T
OULOUSE
A
rchive
O
uverte (
OATAO
)
OATAO is an open access repository that collects the work of Toulouse researchers and
makes it freely available over the web where possible.
This is an author-deposited version published in :
http://oatao.univ-toulouse.fr/
Eprints ID : 12639
Official URL:
http://dx.doi.org/10.1109/CBMI.2013.6576547
To cite this version :
Le Coz, Maxime and Pinquier, Julien and André-Obrecht,
Régine and Mauclair, Julie Audio Indexing Including Frequency Tracking of
Simultaneous Multiple Sources in Speech and Music. (2013) In: 11th International
Workshop on Content-Based Multimedia Indexing (CBMI 2013), 17 June 2013 -
19 June 2013 (Veszprem, Hungary).
Any correspondance concerning this service should be sent to the repository
administrator:
[email protected]
AUDIO INDEXING INCLUDING FREQUENCY TRACKING OF SIMULTANEOUS
MULTIPLE SOURCES IN SPEECH AND MUSIC
M. Le Coz, J. Pinquier, R. Andr´e-Obrecht
IRIT, 118 Route de Narbonne
Toulouse, France
{lecoz, obrecht, pinquier}@irit.fr
J. Mauclair
Universit´e Paris Descartes
Paris, France
[email protected]
ABSTRACT
In this paper, we present a complete system for audio index-ing. This system is based state-of-the-art methods of Speech-Music-Noise segmentation and Monophonic/Polyphonic esti-mation. After those methods we propose an original system of superposed sources detection. This approach is based on the analysis of the evolution of the predominant frequencies.
In order to validate the whole system we used different corpora : Radio broadcasts, studio music and degraded field records. The first results are encouraging and show the poten-tial of our approach which is generic and can be used on both music and speech contents.
1. INTRODUCTION 1.1. Context
Audio signal can be composed of various content and au-dio indexing aims at identifying the different levels of con-tents in order to facilitate the browsing or the understanding. Primary content such as Music, Noises or Speech have been studied for a long time [6], and now their extraction offers good accuracy whether in speech [7] or music [2].
The detection of these primary components is reliable enough to design specific systems analysing the signal by as-suming the knowledge of the primary context. Other levels of description can then be reached by a set of classifiers using the combination of their results. In this paper we focus on the lo-calization of multiple simultaneous harmonic sources which can lead, according to the context, to different interpretations: • In the music context, such sources may correspond to several instruments, to one instrument when playing a chord, to several singers singing on the same octave (uni-son choir) or not (choir).
• In the speech context, each source corresponds to one speaker, so the presence of multiple harmonic sources corresponds to superposed speech. The presence of si-multaneous harmonic sources appears when two speak-ers pronounce simultaneously two voiced phones.
In speech as well as in music, the presence of simultaneous sources would substantially complicate a precise sound anal-ysis. Indeed music and speech transcription performance has greatly decreased in presence of simultaneous sources. While the transcription of monophonic music is almost a closed problem, the analysis of multiple source music or superposed speech is still a complex problem waiting for solutions, even if some methods have been developed, with specialized ap-proach in order to improve the performances. This problem has been taken into account and evaluation campaigns such as the French ANR ETAPE includes the evaluation of the super-posed speech detection task.
The main problem of detecting such contexts is the fact that harmonics of different sources can interact in very com-plex ways. The decorrelation of the sources has been under-took from different points of view by methods of speech or musical domain.
In music domain. using pattern-based techniques, the notes playable by different instruments are modeled and their location in the audio flow are perfomed with Hidden Markov Models [1]. Another approach consists in removing the noise, finding the peaks and, by using energy-decrease patterns, es-timating the number of sources and their played notes [10]. In musical context, the result of a multiple-pitch estimation can be used as itself in order to produce a musical transcrip-tion of the records; an applicatranscrip-tion mainly cited is to use this transcription as a front-end process for a source separation al-gorithm, which is still a very difficult problem with a lot of applications in the music industry.
On speech domain, a first approach (Signol [8] and Li´enard [4] ) is based on comb filtering to greatly enhance the peaks corresponding to the source’ fundamental frequen-cies. But contrary to musical context, the multiple fundamen-tal frequency can hardly be used as itself. Nevertheless, it can be a very important front-end for multiple methods such as speaker identification, speaker characterization or transcrip-tion. By example, most of nowadays transcription algorithms produce unusable results on superposed speech context and therefore choose to skip it. Being able to identify such con-text can therefore be the first step for designing more specific
Fig. 1. Example on the presence on multiple sources on a 10 seconds musical extract. On the second half of this example, we can see different harmonics produces by the singers.
approaches on those areas.
2. CONTEXT
Our ultimate purpose is to defined a complete audio in-dexing system which provides the location of simultaneous multiple harmonic sources, independently of the nature of the audio flow (speech or music). After extracting low-level char-acteristics, we aim at adding more semantic information for sound databases indexing. So we develop a generic method in order to detect and locate simultaneous harmonic sources in whether musical or speech content. It aims at extracting the predominant frequencies frame by frame and tracking them temporally as a production of the same sources. Once the tracking performed, we identify relation patterns between har-monics to identify if multiple harmonic sources are present or not. This work is realized in the context of the French ANR DIADEMS1that aims at developing automatic tools for the
indexation/study of the ethno-musicological archives of the Mus´ee de l’homme. The experiment is performed on a set of real-condition records in order to face the content diversity currently found during the analysis of such corpora.
To localize the multiple harmonic sources we look for the presence of multiple harmonic families in the spectrum. But according to the type of content, the phenomenon has a differ-ent aspect. While it is a very long and abundant evdiffer-ent in mu-sic, the overlapping of multiple harmonic families tends to be very rare and short in speech content, when voiced phonemes are simultaneously produced. So we have developed a generic method to find the phenomena in different contexts by only adapting the parameters to the previously detected situation.
On the Figure 1, the phenomenon is illustrated by an ex-ample on musical extract. On this exex-ample we can see the in-terest of using a tracking to detect the different sources from their evolution instead of a frame-by-frame detection.
1http://www.irit.fr/recherches/SAMOVA/DIADEMS/ Sound Speech Music Noise [5] Speech Music Noise Monophonic/ Poly-phonic [3] Monophonic Polyphonic Multiples sources detection Multiples sources detection Multiples sources detection
Choir Solo Polyphonic confirmation
Superposed speech
Solo speech
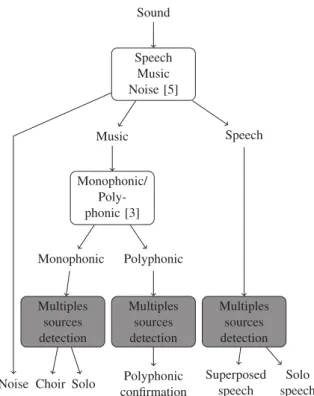
Fig. 2. Integration of our method of simultaneous multiple harmonic source detection in a whole system of audio index-ing.
3. SYSTEM
Our whole system is divided into 6 main modules(as de-picted in the Figure 3).
The first step is a classical process to locate the main com-ponents Speech, and Music. Superposed speech and mu-sic segments are obviously identified as produced by simul-taneous harmonic sources. On music segments, a Mono-phonic/Polyphonic identification is computed in order to pre-cise the musical context. Monophonic segments may be pro-duced by unison choir. Over each extracted segment (Mono-phonic music, Poly(Mono-phonic music, Speech), the multiple har-monic source detection process is applied to confirm or to precise its nature.
3.1. Areas of interest
As said before, our analysis has to be performed on rele-vant areas, i.e. areas containing at least one harmonic source. Therefore, the first step of our system consists in temporally splitting the signal into segments containing either Speech, Noise or Music. This step is performed using the work of Pinquier [5]. During segments identified as music and speech, multiple harmonic sources are necessary present. Only pure
speech and music segments are kept for the next processing and the tunings and methods will change according to the type of content. The other segments are considered as noise (or si-lence).
3.2. Monophonic- Polyphonic
Using the work of Lachambre [3], we perform an estima-tion on whether the whole music segments are monophonic or polyphonic. This step can be considered as a conjoint in-formation more than a real pre-requite for the multiple source localisation as it can be refined by the latter methods. As said previously, choirs of singers can be estimated by monophonic but different singers can be localised by the multiple sources detector.
3.3. Multiple sources detection
On this new step we aims at studying the evolution of the main sources by the analysis of the evolution of the main fre-quencies.
3.3.1. Selection of candidate frequencies
The first step therefore consists in locating those main fre-quencies on a time-frequency representation.
The representation we use is a spectrogram analysis per-formed by a Fast Fourier Transform over each frame. The whole spectrogram analysis is computed for the frequencies up to 3000 Hz. After this limit, most of the phenomena we want to detect (speech or signing harmonics) rarely have enough energy to be distinguished from noise.
On the spectrogram, we will localise all the peaks of high energy, as they can have been produced by one of the sources. On each frame, the greatest peak is extracted: pmax= (fpmax, amplpmax)
Every peak p : (fp, amplp) with amplp > th(fp) is
se-lected as possibly produced by one of the source and will be used in the tracking. The threshold is a piecewise linear func-tion of the frequency defined as follow:
• th(fmin) = r
start× amplpmax
• th(fpmax) = r
max× amplpmax
• th(fmax) = r
end× amplpmax
The threshold varies according to the frequencies in order to take into account the decreasing of the signal over noise ratio with frequencies.
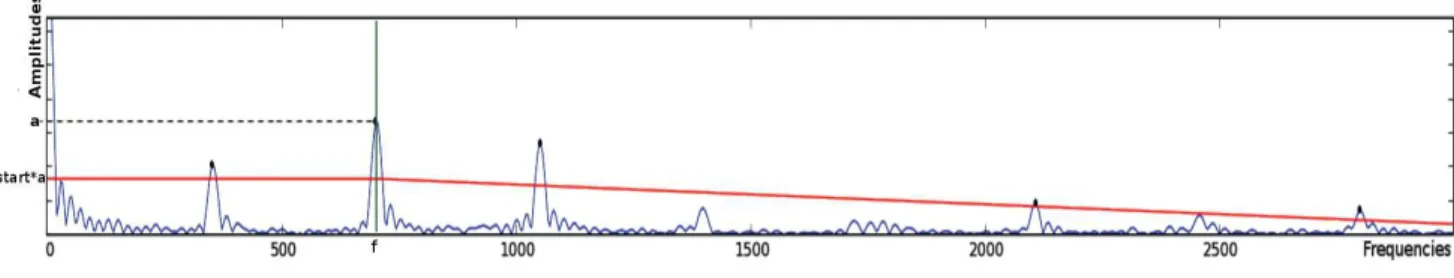
An example of the threshold function over a spectrum is shown in the Figure 3.3.1.
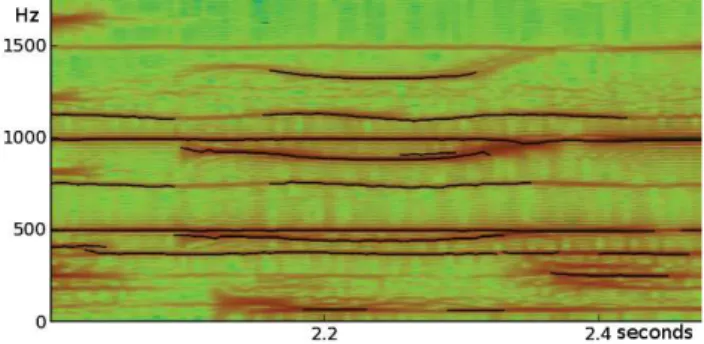
Fig. 4. Sinusoidal segments on a music extract with signings and instrument. The sinusoidal segments are represented as black lines over the spectrogram.
3.3.2. Frequency Tracking
The frequency tracking is based on the method proposed by Taniguchi to extract sinusoidal segments [9]. A sinusoidal segment corresponds to a sequence of frequencies considered linked by the tracking procedure; it is characterized by the time index of its beginning and ending, and the sequence of frequency-amplitude couples considered linked.
The different steps of this method is described in Tani-gushi’s paper. It consists at linking a peak i defined by (fi
t, ampit) on the spectrum of the frame t, to a peak j
de-fined by(ftj, amp j
t) on an adjacent frame t ± 1. The linkage
is true if the following distance di,j is less than a threshold
(dth): di,j = s (f i t − f j t+1 Cf ) 2(amp i t− amp j t+1 Cp ) 2 (1)
If the two peaks are linked, therefore we consider that they are caused by the same source and that the second peak is the evolution in time of the first. With this method, few noise peaks are incidentally linked and create a segment. There-fore to keep sinusoidal segments that are really significant, we only focus on the segments longer than a certain threshold thminLength. An example of the sinusoidal segment
extrac-tion is displayed on the Figure 4. Those significant segments are be passed to the next step to be grouped together. 3.3.3. Segmentation Clustering
The aim of this process is to group together the sinusoidal segments belonging to the same sources. Obviously, if the ra-tio between two frequency peaks , observed at the same time, is an integer, these frequencies correspond to harmonics of the same harmonic source. So we search such couples of fre-quencies, with a temporal stability. To do so we propose a dis-tance based on this ratio, between every couple of sinusoidal segments(s1, s2) with a minimum overlap of thminOverlap
frames. Then a graph is built and each connect component corresponds to a source.
Fig. 3. Threshold function (in red), over a frame spectrum. In green the localisation of the main peak (pmax = (f, a)) is
displayed. The parameters for this function are rstart= 0.5, rmax= 0.5 and rend= 0.1
More precisely :
Let L, the number of frames of a couple (s1, s2) of si-nusoidal segments. The list of the frequencies f l(t,s1) and
f l(t,s2)when t varies from 1 to L, is extracted, with f lt,s1 >
f lt,s2. For every possible window of length thminOverlap
starting at time t0we compute the mean ratio mr(t0,s1,s2)
be-tween the frequencies of the two list of nodes. mr(t0,s1,s2)= mean(
f l(t,s1)
f l(t,s2)) (2) With t∈ t0, ..., t0+ thminOverlap− 1) The proposed
dis-tance dClus is the absolute difference of this ratio with its closest integer. If this value is near 0, the ratio is an integer and the frequencies are the harmonics of the same source.
dClus(t0,s1,s2)= |mr(t0,s1,s2)− round(mr(t0,s1,s2))| (3)
To integrate the temporal control,the global distance be-tween the two sinusoidal segment is the median value of the distances.
dClus(s1,s2)= M edian(dClus(t,s1,s2)) (4)
Again with t∈ t0, ..., t0+ thminOverlap− 1)
We then create a graph where all the nodes are representing a sinusoidal segment. The nodes representing two sinusoidal segments s1 and s2 can be linked together if dClus(s1,s2) <
thclust. If the ratio between the frequencies is close enough of
an integer value, that means that the segments are very likely to be harmonics one with another. Therefore the group of segments linked by transitivity one with another can be con-sidered as being members of the same harmonic family.
To isolate those groups, we extract the connected compo-nents of the graph (Figure 5). On this graph, every connected component is a cluster of sinusoidal segments we consider as the harmonics belonging to the same source.
3.3.4. Cluster Simultaneity and Segmentation
Now that the sources are tracked, we want to identify the ar-eas where multiple sources coexists. We create a function counting the number of clusters according to time.
Fig. 5. Linkage of the different sinusoidal segments. Every connected component of the graph represents a set of sinu-soidal segments produced by a single source.
clusCount(t) =X
i
(cluster(i, t)) (5) where cluster(i, t) is 1 if the ith cluster has a node a time
t and0 otherwise. Contiguous frames with more than one cluster are then regrouped into a segment where superposed sources are likely present.
4. EXPERIMENT
It is very difficult to find a corpus to validate our complete system and test its robustness; this corpus may be composed of speech superposed speech, instrumental music, singers, various types of choir , and so in a balanced way. So we gather several audio records representative of different types of audio content, issued from different corpora to define our experimental corpus.
4.1. Tuning
Experiments have been led using the following tunings : • All the variable of the tracking process are fixed as
de-scribed in the Tanigushi’s paper. • thclusis set to0.05.
• rstarthas been set to0.5 for music and 0.1 for speech.
• rmaxand rendhas been respectively set to0.5 and 0.1.
4.2. Corpus
The files composing the corpus are :
• 2 files from the ETAPE2 evaluation campaign. These
files are 15 minutes long TV broadcast audio record. It contains only 13 event of superposed speech lasting around half a second. This corpus is representative of the difficulty of the superposed speech detection as the events to retrieve are rare and short.
• 2 files containing 3 minutes songs from the European song contest Eurovision. The files contains only music of studio quality and are almost entirely polyphonic. • 2 files provided by the Mus´ee de l’homme containing 30
minutes long ethno-musicological records. Those files are noisy as they have been recorded on field during the 1950’s and recently digitalised. They represent a sample of what the ethno-musicologists want to automatically process in order to indicate the different areas of interest such as choirs, singing, instrumental solos, interviews... The first file starts with and interview part followed by few solos of didgeridoo. The rest of the record comports a singer acompagnished by a didgeridoo.
4.3. Results 4.3.1. Eurovision
On the Eurovision files, the classification into music and polyphony works well despite some errors on mostly percus-sive parts. This behaviour is explainable by the fact that the content is stereotypical western music whose what the sys-tems have been designed to detect. A lot of superposition are detected in the different parts of the files. The mono-phonic/polyphonic rarely find pure monophonic parts. How-ever, as the mixing process tends to reduce the energy of the accompaniment, the superposed parts are clearly more present when two main sources are present (by example two singers or a singer and a lead violin). this behaviour can be ex-ploited to refine the decision of the monophonic/polyphonic module.
4.3.2. ETAPE Corpus
On the ETAPE files, half of the superposed speech events have been correctly detected which is encouraging. Some false alarms are detected in noisy parts as the energy of some 2http://www.afcp-parole.org/etape.html (Files LCP TopQuestions
2011-03-23 213900 and LCP TopQuestions 2011-04-05 213900)
frequencies in the noise match the energy of some harmonics and parasites the tracking.
Most missed superpositions can be explained by the fact that the speech detector appears to be poorly reliable on su-perposed speech. Indeed, this detector is based on the estima-tion of the energy modulaestima-tion around 4 Hz which is related with the syllabic rate. On situation of multiple speakers, this rate car improve up to two times leading therefore the detector to estimate it as non speech.
4.3.3. Ethnomusicology
On the ethno-musicology files, even if the speech/music is very unstable, main parts of speech and music are globally localized. On the first part of the file, containing solos of didgeridoo, only few small parts are labeled as superposed despite the fact that all the music is labeled as Polyphonic. On the second part, a singer adds it’s sing to the didgeridoo music, the music is still labeled as polyphonic but superposed segments become a lot more frequent reaching a rate of al-most two segments by seconds. On this file a smoothing of the superposition detection could lead to a clear segregation between solo and accomplished music and correct the erro-neous decision of the polyphonic detector. On this corpus, informations on the multiple harmonic sources can be hard to reach as the first detection of speech and music has not been design for such context. It is by example strongly influenced by the presence of repetitive precision around the 4Hz fre-quency. But on the two files, when the multiple sources are detected in real polyphonic context.
5. CONCLUSION AND PERSPECTIVES In this paper, we present a complete system of audio in-dexing using different methods to characterise the content of a sound record on different levels. This system has the par-ticularity to require no specific training on the corpora stud-ied. Indeed subsystems do not use a priori knowledge. The novelty and originality of our work is our overlapping source detection based on the analysis of the evolution of the main frequencies of the signal.
The experiment we led produce promising results espe-cially in the fact that it shows good robustness through very different types of audio recordings. This robustness could be use in terms of validation of the previous process such as the polyphony detection.
The improvements could be done on improving the detec-tion of speech and music parts into different types of contexts to provide a more robust base for the later estimations. A cautious elimination of noisy parts would also lead to an im-provement of the results as the tracking would be more accu-rate.
Moreover, as this last step produces the time-frequency lo-calisation of a source, this information could then be used to
characterise the sources and add higher level information of the sources. The frequency ratios between clusters could by example be used in music for identifying the style of choir singing (unison, fifth...) and the timbre information extracted from the amplitude decreasing between harmonics could give clues for the type of instrument used. In speech, the frequency contours can by example be used to direct a source-separation algorithm.
6. REFERENCES
[1] E. Benetos and S. Dixon. Temporally-constrained convolutive probabilistic latent component analysis for multi-pitch detec-tion. In Proceedings of the 10th international conference on Latent Variable Analysis and Signal Separation, LVA/ICA’12, pages 364–371, Berlin, Heidelberg, 2011. Springer-Verlag. [2] T. Hughes and T. Kristjansson. Music models for
music-speech separation. 2012 IEEE International Conference on Acoustics, Speech and Signal Processing (ICASSP), pages 4917–4920, 2012.
[3] H. Lachambre, R. Andre-Obrecht, and J. Pinquier. Distin-guishing monophonies from polyphonies using weibull bivari-ate distributions. IEEE Transactions on Audio, Speech, and Language Processing, 19(6):1837–1842, 2011.
[4] J.-S. Li´enard, F. Signol, and C. Barras. Speech fundamen-tal frequency estimation using the alternate comb. In INTER-SPEECH, pages 2773–2776, 2007.
[5] J. Pinquier, J. L. Rouas, and R. Andre-Obrecht. A fusion study in speech/music classification. In Proc. IEEE Int. Conf. Acous-tics, Speech, and Signal Processing (ICASSP ’03), volume 2, 2003.
[6] E. Scheirer and M. Slaney. Construction and evaluation of a robust multifeature speech/music discriminator. International Conference on Audio, Speech and Signal Processing, page 13311334, 1997.
[7] E. Scheirer and M. Slaney. Single-channel speech-music sep-aration for robust asr with mixture models. IEEE Transactions on Speech, Audio, and Language Processing, pages 725–736, 2013.
[8] F. Signol. Automatic multipitch estimation for monaural speech mixture signals.PhD thesis, LIMSI-CNRS, Universit´e Paris Sud B.P. 133 F-91403 ORSAY CEDEX, 2009.
[9] T. Taniguchi, M. Tohyama, and K. Shirai. Detection of speech and music based on spectral tracking. Speech Commun., 50(7):547–563, July 2008.
[10] C. Yeh, A. Roebel, and X. Rodet. Multiple fundamen-tal frequency estimation and polyphony inference of poly-phonic music signals. Trans. Audio, Speech and Lang. Proc., 18(6):1116–1126, aug 2010.