D
OCUMENT DE
T
RAVAIL
DT/97/13
Monitoring Urban Poverty at the
Bangladesh Bureau of Statistics
Design and Implementation Issues for an
Adaptive 1-2-3 Survey
Monitoring Urban Poverty at The Bangladesh Bureau of Statistics:
Design and Implementation Issues for an Adaptive 1-2-3 Survey
Jean-Luc Dubois1 .
1
Contents
Introduction...3
1. The Economic Background...5
1.1. Poverty in Bangladesh... 6
1.2. Measuring the Level of Poverty... 7
1.3. A Focus on Urban Poverty ... 10
1.4. Poverty is Related to Unemployment... 11
2. The Need for an Appropriate Approach...14
2.1. The Conceptual Framework ... 14
2.2. An Adaptation of the 1-2-3 Survey ... 18
2.3. The Bangladesh Bureau of Statistics... 21
2.4. Implementation Issues ... 23
Conclusion ...29
References ...31
ANNEXES ...35
ANNEX 1. THE SET OF QUESTIONNAIRES ... 36
ANNEX 2. THE OPERATIONAL AGENDA ... 37
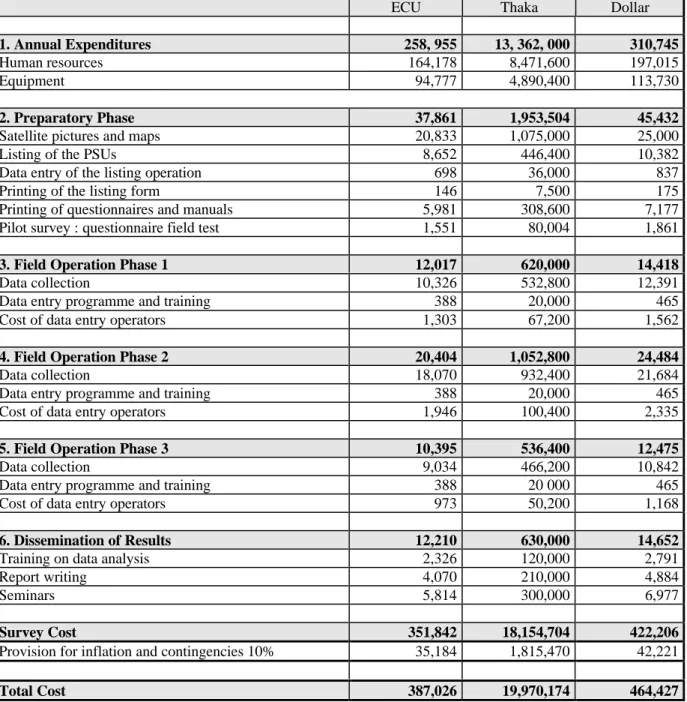
ANNEX 3. THE COST OF SURVEY ... 38
ANNEX 4. DETAILED COST ESTIMATES... 43
ANNEX 5. INTERNATIONAL COMPARISON OF THE 1-2-3 SURVEY COSTS 52 Tables Table 1 Incidence of Poverty: Percentage of Population under the Poverty Line ...8
Table 2Cost of Technical Assistance ...40
Table 3 Equipment Expenditure ...41
Table 4 Expenditures for Training Sessions Seminars...41
Table 5 Transport and Travel Expenditures ...42
Table 6 Expenditures for Stationery and Publications ...42
Introduction
The most recent studies in Bangladesh show a stagnation in rural poverty and an increase in urban poverty and inequality. This has two main reasons. First, the migration from the rural to the urban areas, as a result of the insecurity from the lack of land and the regular river floods, tends to increase the number of the extremely poor. Second, growth benefits more the upper classes, which, as a consequence, worsen increases inequality in the income distribution and keeps a great number of people under the poverty line.
The Bangladesh Bureau of Statistics (BBS) is the government official institution producing regular data on these issues to monitor the poverty situation. It launched a series of statistical operations such as the Household Expenditure Survey (HES), the Labour Force Survey (LFS), Local Level Development Monitoring Survey (LLDMS) and the Health and Demographic Survey (HDS) which provide data on the various dimensions of both the rural and the urban poverty. Even the Agricultural Census, presently under implementation, includes, for the first time, an urban module taking into account the home production activities linked to agriculture. But the most interesting instrument is the Poverty Monitoring Survey (PMS) which provides twice a year representative information of the incidence of poverty1.
The information produced presents some weaknesses. First, there is a permanent bias in favour of the rural areas where poverty is much more frequently studied. The PMS introduced only recently in urban areas the data collection on household expenditures and standards of living. Therefore the existing knowledge on urban poverty, on its origin and its main features, remains quite scarce. Second, most of the samples are either small, as for the PMS, or only focussing on specific categories, like for the LFS. This leads to the risk of insufficient representativity of the urban socio-economic groups mainly concerned by the rise in poverty. This is particularly true, for instance, for the self-employed and their families.
Having in mind to improve this situation in the next few years, the government of Bangladesh expresses to the European Union, through an official request, its desire to benefit from the technical assistance funds, in order to strengthen the urban poverty monitoring capability of the BBS. In September 1995, an identification and pre-appraisal mission went to Dhaka and
1The BBS publications present results from the current statistical operations (through the Monthly and Yearly Statistical
Bulletin, the Agriculture Statistics, the Education Statistics, the Trade and Industry Statistics), the censuses operations (i.e. Agricultural Census 1983/84 and 1997/98, Population census 1991 and 2001, Non-Farm Activities and Disabled Persons 1986), the sample surveys (i.e. HES 1991-92 and 1995-96, PMS 1994 and 1995, LLDMS 1994, LFS 1990-91 and 1995-96, Child Nutrition Survey 1992, Health and Demographic Surveys 1993-94 and 1997-98) and the National Accounts.
suggested to finance a project that would aim, through a set of objectives2, at reinforcing the BBS monitoring role.
Two directions for action were suggested. First, to ensure the consistency of all concepts and methodologies related to poverty which are used in the current BBS operations such as the HES, the PMS and the LFS among others. Second, to adapt to the peculiar needs of the
Bangladesh an innovative instrument, a three phases survey named the 1-2-3 Survey3, to
gather information on employment and informal enterprises issues in urban areas. This should be considered as a pilot experiment aiming at collecting information, in a few selected sites, on a few topics insufficiently covered by the present BBS operations. It would also be an opportunity to improve the data processing and reduce the delays in the production of information.
A second mission went to Dhaka in April and May 1997, with these objectives in mind, to appraise a project entitled "Technical Assistance to the BBS". A series of meetings were held with the directors of the seven BBS wings4 and of some specific projects5, and the various national and international users of the BBS data. The review of the BBS needs, the discussion about the related administrative and technical consequences, and the visits to the regional and Thana offices lead to a series of proposals to strengthen the BBS capacity to monitor poverty. Among them came the proposal of implementing a survey equivalent to the 1-2-3 survey in the four cities of Dhaka, Chittagong, Tangail and Rangpur.
This survey, as part of the technical assistance project, aims at improving the data collection in the urban areas and the overall production of poverty information. More precisely, it aims at providing representative information on the small and cottage industries in the urban areas and at facilitating their integration into the national accounts system presently under revision. Through the various steps requested for its implementation, this survey helps the BBS to rethink some of its internal data production procedures, such as the relevance of the master sample frame, the decentralisation of the data processing and analysis operations, and the
2
The three key objectives of this project are: (i) reinforcing the role of BBS in poverty monitoring ; (ii) Improving the co-ordination between agencies dealing with poverty issues, and (iii) strengthening the monitoring of urban poverty.
3
Initiated through the ORSTOM (French Scientific Research Institute for Development in Co-operation) research on the informal sector in Mexico, the 1-2-3 Survey was successfully implemented in Antananarivo, Malagasy Republic (1995) and in Yaoundé, Cameroon (1993).
4
(i) Population & Demographic Survey Wing ; (ii) Research, Training & Sample Survey Wing ; (iii) Industry, Trade, Labour Statistics & National Income Wing ; (iv) Agriculture Statistics Wing ; (v) Industry Statistics Wing ; (vi) Computer Data Processing & Statistical Cartography Wing ; (vii) Reproduction, Documentation & Publication Wing.
5
(i) Population Census and Housing 2001 ; (ii) Health and Demographic Project 1993-98 ; (iii) Regular and Continuous Monitoring of Poverty ; (iv) Nutrition Project ; (v) Strengthening the Data Entry System for the Household Expenditure Survey ; (vi) Agricultural Census ; (vii) Use of Agricultural Inputs for the Main Crops ; (viii) National Data Bank.
setting up of an in-depth economic analysis team able to produce official analysis on poverty issues using the data of the various BBS or external surveys,.
The Research Training and Sample Wing is the BBS' wing directly interested by the implementation of such a pilot survey. Through a series of joint working sessions with its staff, at headquarters and in the regional field offices, a comprehensive conceptual framework - linked to the overarching objective of strengthening the BBS capability to monitor urban poverty - was generated as guidelines for the survey design. It focuses, as its objective, on the study of the relation between employment, poverty and the creation of small and cottage industries, either in the formal or the informal sector. Answering to this objective implies to adapt the standard 1-2-3 Survey to the Bangladesh socio-economic environment by changing its structure and various methodologies. This has consequences on the detailed assessment of the costs and on the implementation agenda.
This report presents all issues pertaining to the design and the implementation of this new type of 1-2-3 Survey. The innovative approach required to modify its structure, through a new sequencing of the phases, to draw the questionnaires (including aspects of social capital and subjective poverty), to select the sample (small and cottage industries instead of informal sector), etc. is constantly underlined.
1. The Economic Background
Poverty alleviation is the key moto of the Bangladesh development strategy. The First Five Year Development Plan, published in 1973 just after independence, already focused on poverty reduction and set it as a top priority for the economic policy. But implementing appropriate poverty reduction policies require a good knowledge of the effective level of poverty, it dissemination among the urban and rural categories, and the mechanisms that lead and maintain the households into poverty. These are the issues to be dealt with in the next pages.
1.1. Poverty in Bangladesh
With a per capita GNP of $230 in 19946, Bangladesh still remains among the poorest low-income countries. In 1992, 47.4% of the population was living below the poverty line7. The value of its Human Development Index was 0.368 in 1994, which brings its at the rank 144th, ahead of 31 other countries8. This diagnosis is confirmed by the high levels of illiteracy rate (51% of the population in 1995), infant mortality (75%o) and child malnutrition (31% stunting and 7% wasting) 9.
While considerable progress was made in macroeconomics management since 1971, the year of the Independence, Bangladesh still continues to lag behind other Asian countries. Between 1975, the first year in which the economy returned to a degree of normalcy after the war for Independence, and 1995, the GDP annual growth rate was 4.3%10 on average. In 1996, it was 5.3% due to the good harvests and an equivalent rate is expected for 1997. In the meantime, the population growth rate, which reached 2.7% till the beginning of the 80s, decreased regularly to 2% in the 90s. This shows the emergence of a demographic transition, the fertility rate decreasing from 7 children per woman in 1970 to 3.4 en 1995. As a result, the average size of the household, both in urban and rural areas became 5.3 in 1995.
Consequently, the annual growth rate in the per capita GDP increased from 1.5% at the end of the 70s to 2.2% in the 90s. Although modest by the standards of the other Asian developing countries, these rates are far greater than the former annual growth rate of 0.7% that the country experienced during the 20 years prior to Independence.
A number of natural catastrophic events, like the famines, are now better mastered. But the numerous population, with high density11 on an exiguous area (147.570 sq km), is regularly threatened, during the May to October monsoon, by storms and floods from the Ganges and the Brahmaputra.
6
Ref: Bangladesh. Annual Economic Update : Recent Economic Developments and Medium-Term Reform Agenda, July 1996, The World Bank, Washington, 56 p.
7
Ref: (i) Report on the Household Expenditure Survey 1991-92, November 1995, 290 p.; (ii) Summary Report of Household Expenditure Survey 1991-92, February 1995, 22 p. ; Bangladesh Bureau of Statistics, Dhaka.
8
Ref: The Human Development Report 1997 : Poverty and Human Development, 1997, UNDP, Oxford University Press, 250 p.
9
Ref: Achieving the Mid Decade Goals for Children in Bangladesh,1996, BBS and UNICEF, Dhaka, 68 p.
10
The rate of growth was stronger during 1975-80 (4.2%) and 1990-95 (4.6%) than between 1980-90 (3.4%).
11
The decennial Population Censuses show that population increases from 28.9 million in 1901 to 41.9 in 1951, from 71.5 million in 1974 to 106.3 in 1991. It is estimated at 126.2 millions en 1997 with a density of 860 h/km2.
The per capita GDP still remains at a low level, i.e. $240 in 1995. However, expressed in power purchasing parity, which shows the households' capacity to satisfy their own needs at current local prices, the per capita GDP is 1.380 $ in 1994, bringing Bangladesh at the equivalent level to Côte d’Ivoire (with per capita GDP of $660 and $1.580 in power purchasing parity)12. The difference between these countries' estimates shows that imports are extremely expensive in Bangladesh, compared to the locally produced goods such as garment, food, housing, transport, etc. This is different for the African economies, especially those belonging to the CFA Franc zone like Côte d'Ivoire. To some extent, this explains the difficulty that they encounter in promoting their own local production.
One may notice, however, the improvement in basic social indicators during the last two decades. Between 1991 and 1995, for instance, the infant mortality rate decreases from 92%o to 75%o, life expectancy increases from 56.1 years to 58.3, the illiteracy rate decreases from 64.7% to 51.3%, and the gross enrolment rate for the 5-24 from 42.9% to 48.8%.
1.2. Measuring the Level of Poverty
To measure the level of poverty and to monitor its evolution, the BBS conducted a series of surveys. Household expenditure surveys (HES) were carried out regularly since 1973-7413, the result of the last one - the 10th round in 1995-96 - are being printed. To complement this periodic operation, a Poverty Monitoring Survey (PMS) was set-up in 1994 to collect information twice a year14.
Other institutions, like UNICEF for the children and Helen Keller International for the poor, also conduct surveys in relation with the BBS. However, their samples, selected through purposive sampling techniques in poor villages and urban slums, are not representative at the national level. They give, however, a good description of the poverty situations for specific groups of people, but the comparison of their information with those of the BBS remains difficult.
Research centres, such as the Bangladesh Institute of Development Studies (BIDS) or the Centre of Urban Studies (CUS) at the Dhaka University, also carry out, on foreign funds,
12
Ref: The World Bank Atlas 1997, The World Bank, Washington, 48 p.
13 Ten annual HES were conducted in 1973-74 (with 11.773 households), 1976-77 (11.520), 1977-78 (28.000 rural
households), 1978-79 (17.750), 1981 (9.750), 1983-84 (3.840), 1985-86 (3.840), 1988-89 (5.760), 1991-92 (5.760), 1995-96 (7.440 households).
14
Implemented in 1994 the PMS conducted three rounds October 1994, April 1995 and December 1995. Only the last one collectd information on both rural and urban areas.
surveys and studies at the national level using their own methodology. This leads to confusion when faced with various results based on different poverty lines. On the other hand, it contributes to emphasise the need to strengthen the BBS in order to make it the only institution able to answer, quickly and with reliable data, to any request on the poverty situation at the national level.
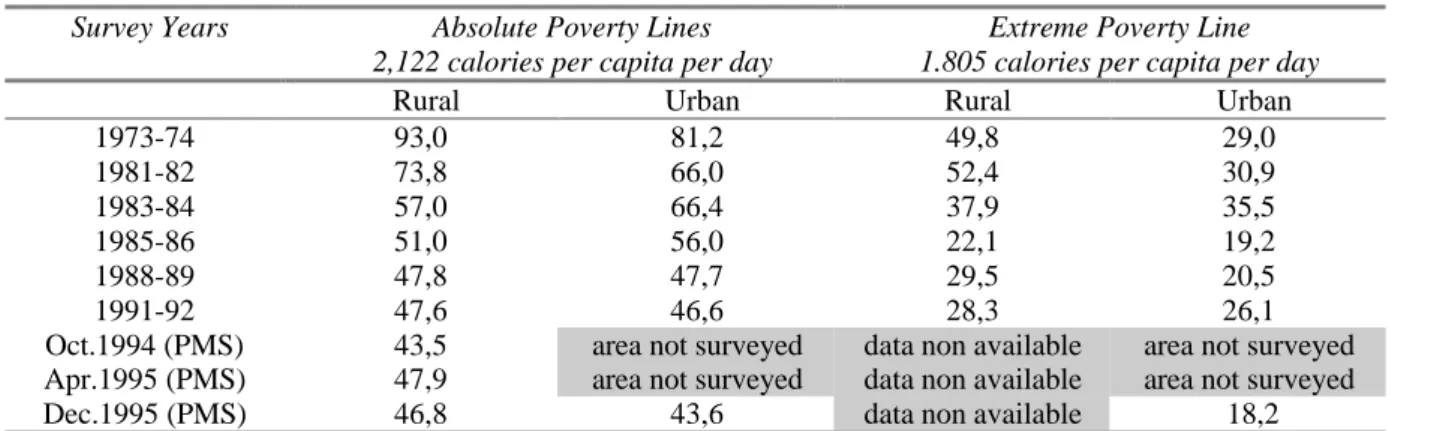
The measurement of poverty is presently done through an absolute poverty line based on food-energy intake which relates the per capita per day calorie intakes, based on food consumption, to the total expenditures, food and non-food included. Two absolute poverty lines are estimated: the first one, for the urban areas, is based on a cut-off point of 2,112 per capita per day calories; the second, for the rural areas, has a cut-off point of 2,122 calories. A hard core poverty line is also set up at 1,805 per capita per day calories to estimate the number of the extremely poor. Therefore, three categories of households are considered for the analysis: the extremely poor, the poor and the non poor. In 1995, the PMS estimates, in
urban areas, the incidence of poverty at 43.6% and of extreme poverty at 18.2%15. The
correlation to the household expenditures, food and non-food included, gives Thaka 710 (or $17) for the absolute poverty line and Thaka 432 (or $10) for the hard core poverty line. These poverty lines are particularly useful to compare the poverty and the extreme poverty incidences between the urban and the rural areas for various periods of time, as shown in the following table.
Table 1 Incidence of Poverty: Percentage of Population under the Poverty Line
Survey Years Absolute Poverty Lines 2,122 calories per capita per day
Extreme Poverty Line 1.805 calories per capita per day
Rural Urban Rural Urban
1973-74 93,0 81,2 49,8 29,0 1981-82 73,8 66,0 52,4 30,9 1983-84 57,0 66,4 37,9 35,5 1985-86 51,0 56,0 22,1 19,2 1988-89 47,8 47,7 29,5 20,5 1991-92 47,6 46,6 28,3 26,1
Oct.1994 (PMS) 43,5 area not surveyed data non available area not surveyed Apr.1995 (PMS) 47,9 area not surveyed data non available area not surveyed Dec.1995 (PMS) 46,8 43,6 data non available 18,2 Source : Summary Report of Household Expenditure Survey 1991-92, February 1995. Bangladesh Bureau of Statistics, Dhaka, 22p.
15
Ref: Poverty Monitoring Survey in the Urban Areas December 1995 : Summary Results, 1997, Md. Delwar Hossain, Communication at the CIRDAP-BBS National Seminar on Poverty Monitoring 30 April 1997, Dhaka, 13 p.
This table which uses the data from all the HES and PMS rounds between 1973-74 and 1995 shows the decreasing trend for poverty in the long run; an equivalent tendency appearing for the extreme poverty.
Other studies disagree with these conclusions16. They indicate that the decline in poverty is not proved since there is no regular decrease over the whole period, since the measurement errors are able to explain these fluctuations17. In fact, the decline is obvious for the period between 1973-74 and 1985-86. After these dates the phenomenon is less clear especially for the extreme poverty. Part of this decline in rural areas may be explained by the migration of the poorest households toward the urban areas where they contribute, on the other hand, to the increase of the extreme poverty.
In the mean time changes in the urban income distribution occurs. The increase in the Gini ratio from 0.37 in 1985-86 to 0.40 in 1991-92 at a time where urban areas benefited the most from the last years growth demonstrates a failure in the redistribution process of income. This situation tends to slow down the long term decline of poverty.
Another approach, more qualitative, uses indicators on the standards of living such as the type of dwelling, the consumption patterns, the access to water and energy, the access to health and education services, employment opportunities, assets, social relationships, etc. The Local Level Development Monitoring Survey focuses the most on this basic needs approach of poverty18, although nearly all other national surveys collect information on some of these topics. The corresponding indicators, estimated for the various socio-economic groups, are
usually presented through poverty profiles19 which allows a comparison between the
differences in standards of living of various categories. For instance, the PMS shows, in its December 1995 results, that the poorest people ate mainly rice with a little fish, lived in houses with no sanitary equipment and straw or reeds roofs, drank water from public wells, etc. It also tells that the poorest households' heads in urban areas are labourers working in small production units (carpenters, potters, weavers, blacksmiths, hawkers, etc.) or in trade
16
A recent survey from the BIDS, using an other poverty line suggests modest progress in rural poverty reduction. Poverty would have declined from 57.5 % in 1987 to 51.7% in 1994 and extreme poverty from 25.8% to 22.5 %. Ref : (i) " Rural Poverty in Bangladesh : Trends and Determinants", 1992, M. Hossain and B. Sen, Asian Development Review n°10 ; (ii) " Monitoring Adjustment and Urban Poverty in Bangladesh : Issues, Dimensions, Tendencies", 1993, B. Sen and Q.T. Islam, in
Monitoring Adjustment and Urban Poverty in Bangladesh, Dhaka. 17
For instance a survey, financed by the Asian Development Bank and conducted by the CUS on a sample of 3,000 urban households at the end of 1995, shows that 61.3% of urban households are poor and 40.2% extremely poor.
18
Ref: Analysis of Poverty on Basic Needs Dimensions, Vol.1, December 1995, Bangladesh Bureau of Statistics, Dhaka, 123 p.
and transport services such as taxi-scooter drivers, rickshaw-pullers, push-car, van drivers, etc..
1.3. A Focus on Urban Poverty
Concerning the urban future, the CUS provides rough estimates of the poverty incidence for the years 2000 and 2010. They give 45% and 40%, respectively, for the absolute poverty, and 25% and 20% for the extreme poverty. This shows a decrease in relative terms. However, since the urban population may increase from 37.3 million to 56.8 million between these dates, the number of poor will shift from 16.8 to 22.7 million, and the number of extremely poor from 9 to 10.8 millions20. Therefore, in the future, the decrease of urban poverty in relatives terms may be associated to an increase in absolute terms.
The tendency to urbanisation is, in Bangladesh, a long term trend. In 1991, the Population Census gave 22.5 million in urban areas out of 111.5 million for the whole country. For 1995, it is estimated at 27.6 million out of 122 million. Therefore, the share of urban population shifts from 5% in 1961, to 20% in 1991 and 23% in 1995. Recent forecasts estimate this share at 30% for 2010. This implies that the two main cities, Chittagong and Dhaka, will grow from 6.2 and 7.6 million in 1995, to between 12 and 15 million in 2010.
The causes and processes generating the urban poverty, moderate or extreme, and the rise in the income inequality have not been yet systematically studied and are much less understood than for the rural poverty. Two main reasons explain the increase in urban poverty. The first one relates to the migration from the rural areas. It concerns mostly the landless and the assetless households who cannot earn a living and the farmers whose dwellings are regularly threatened by the floods. Due to their lack of qualification, these migrants have difficulties to find employment in a new and hostile environment and contribute to the increase of the urban extreme poverty. The second one relates to the inadequate redistribution of the urban growth benefits to the poor, due to the lack of job opportunities and the insufficient coverage of the existing social safety nets implemented with the help of the international community.
Little information presently exists on these two issues. Therefore, there is a need for in-depth investigation on the situation and the causes of the urban poverty, and on its link with the income distribution and the migration issues. The 1995-96 HES and the PMS have already
these objectives in mind, but their samples are relatively small for a detailed analysis of what is presently happening in the urban areas.
1.4. Poverty is Related to Unemployment
In urban areas, poverty is mainly related to the issue of finding a job. This is not an easy matter since the rural migrants looking for employment opportunities are competing with the new entrants on the labour market resulting from the natural growth of the urban population. Consequently, the rate of unemployment and underemployment remains high. In the meantime, the opportunities in the public service and in the medium and large companies, which provide stable and well-paid jobs, are scarce.
The 1995-9621 LFS22 shows that the working age population - 10 years and over, i.e. the labour force age population - is 20.1 million in urban areas, and the economically active population, which does not include housewives and students, disabled and retired persons, etc., is 10.2 million. Since the public service, the state-owned enterprises, the industrial private sector do not create enough opportunities to absorb the labour force annual increase, the rate of unemployment and underemployment remains at respectively 5% and 20%. This is even the case for the educated youths among which 8% are unemployed.
Data reveals that the average number of economically active persons per household stands around 2, with a distribution between men and women of 1.45 and 0.55 respectively. Therefore, in half of the households, the spouse is only devoted to the house activities and the household 's head is assisted by an other man23. Out of these 2 persons only 0.6 receive wages or are salaried.
In this context, self-employment and cottage industries remain the only solution to generate the minimum income required to survive. In 1995, 36.7% of urban people aged 15 and over where working in such a way mainly for petty trade, transportation and services.
Self-employment, by definition, concerns the individuals who work for their own household non-farm enterprise for profit or family gain, often without specific location, selling products
20
This is the case for countries with a large young population base. India, for instance, was 353 million in 1947, out of which 75% under the poverty line, i.e. 265 million. In 1995, the population is 950 million with 30% under the poverty line, i.e. 285 million. The decrease is important in relative terms but there is an absolute increase.
21
Ref: Report on the Labour Force Survey in Bangladesh 1995-96, December 1996, Bangladesh Bureau of Statistics, Reproduction Documentation & Publication Wing, Secretariat, Dhaka, 195 p.
22
Seven LFS were conducted in 1983-84, 1984-85, 1985-86 and 1987-88 on 6.000 households, in 1989 and 1990-91 on 9.000 households, en 1995-96 on 15.000 households.
through petty trade activities or services such as the rickshaw drivers, the push-carts, the shoe cleaners, the sugar cane juice seller, the public writers, etc. Self-employment is usually considered as part of the cottage industries, but for analytical reasons in relation with the poverty situation of a household, it is necessary to make a distinction between the two concepts. A cottage industry is a unit, engaged either in manufacturing or servicing, whose investment does not exceed Tk 500,000, and is carried on by an individual alone or with the help of family members working whole time or part time. The cottage industries are usually run within the household, whereas small industries are established outside the household. A small industry is an industrial undertaking engaged either in manufacturing process or service activity, within a total investment between Tk 500,000 and Tk 30,000,000.
The number of cottage industries and small enterprises increased strongly during the past decade. Statistics from the Bangladesh Small and Cottage Industries Corporation shows that the number of cottage industries increases from 321,743 units in 1980 to 405,476 in 1991. Tailoring industries are the most frequent. Next come the bamboo and cane products, the salt producing units, rice husking, pottery, wood products, mat/reeds, blacksmiths and goldsmiths. Garments and auto repair allow the most important profits. In the meantime, the number of small industries increased from 24,005 to 38,294 units. The manufacturing of food and allied products emerges as the main activity in the country. Rice mills and biscuit bakery figure also in large numbers, followed by textile, wearing apparel and leather industry24. However, reliable information on the importance of self-employed activities is still missing. The BSCIC includes the corresponding statistics into those of the cottage industries and the BBS through the Labour Force Survey does not collect representative information on this topic.
On the analytical side, the link, between the level of urban poverty and the development of self-employment and cottage industries needs to be studied. Since both of them, and particularly self-employment, are often the ultimate solution for the poorest urban segments of the population to escape from poverty. Unfortunately most of these jobs are unstable and brings very low revenue. For instance, the PMS shows, in the December 1995 round, that the poverty incidence was higher in the urban households whose heads were labourers in the petty trade group including handicraft production and transport.
23
This information is useful to estimate the length of interview in a household for the first phase devoted to employment and individual activities.
24
The Bangladesh Small and Cottage Industries Corporation (BSCIC) conducted country wide surveys in 1961, 1980, 1987-90 and 1994 and produced regular reports on the situation.
In this context, it is difficult for them to find ways of improving the productivity in order to increase their revenues. There is a risk that maintaining such activities places them in a permanent survival strategy that brings the whole household into a poverty trap. This situation raises several questions concerning the future of these activities. Are they only part of a short term survival strategy or will they favour the emergence of new opportunities in the long run? In other words, are self-employment and cottages industries a first step necessary to promote qualified manpower and small enterprises, that would later generate jobs and added value ? Answering to these questions requires, first, to examine what the reasons for generating self-employment and cottage industries activities; second, to study the chances of having these activities transformed into small and middle size enterprises; and third, to review the existing financial and human constraints that may block such a long term process. These studies could also underline a series of specific life patterns in the employment opportunities and the income-generating activities of the households. For instance, investigating a sample of small and cottage industries would check if really a "middle is missing " in the range of existing enterprises and if all activities have equal chances to develop in the future25.
Among the small and cottage industries, a part is considered as belonging to a so-called "informal sector" since they do not follow the official management rules concerning the trade registration, the payment of taxes, the recruitment of personnel, etc. They are part of a kind of "shadow economy" which produces goods and services, employs thousands of people and generates part of the national added value without being considered in the official data. But since the informal sector is not recognised as such, which is partly due to the difficulty in defining it precisely26, its contribution to the whole economy is not yet integrated in the current value of the GDP.
For this reason, a better knowledge of the informal sector's contribution to the GDP, through the revision of the national accounts, gives the opportunity to consider the creation of small and cottage industries in the design of the public policies which aim at poverty reduction in the urban areas.
25
Ref: Etude des trajectoires de microentreprises dans les pays en développement : aspects théoriques, méthodologiques et premiers résultats d’enquêtes sur échantillon constant, 1997, Sarah Marniesse, DIAL, Paris, 57 p.
26 Ref:"Pour une nouvelle définition du secteur informel", Morrisson Christian et Mead Donald, 1996, Revue d'économie du développement
2. The Need for an Appropriate Approach
Keeping in mind the overarching objective of poverty alleviation, focusing on the issue of poverty and unemployment in urban areas, and on the development of small and cottage industries - whether they belong to the "informal sector" or not - there is a need to understand how can all these issues be related together and how people can at the same time escape from poverty and participate in the development of an industrial network. The corresponding rationale is part of the substance of a conceptual framework.
It requires also the use of an appropriate instrument able to collect information on poverty, employment and enterprises for the corresponding empirical analysis. A particular survey, the 1-2-3 survey, which has already proved, through series of analysis27, to be able to understand in urban areas the relation between employment, the informal enterprises and the consumption of products from the informal sector can be used as a basis for the design of a survey adequate to the Bangladesh needs and socio-economic environment.
The 1-2-3 Survey has the advantage of being easier to manage than the usual household expenditure related surveys, like those of the National Household Survey Capability Program (NHSCP) of the United Nations and Living Standard Measurement Study (LSMS) of the World Bank, since it uses three phases in a sequence, each of them focusing on a specific topic. However, its design imposes, first, to refer to the guidelines provided by the conceptual framework and to innovate through the various implementation steps such as the development of the questionnaire, the field operations, the data management, and so on.
2.1. The Conceptual Framework
The conceptual framework aims at defining, through an appropriate rationale, the needs for policy relevant information and at linking them to the statistical objectives of the survey. It therefore implies a series of choices and decisions concerning the survey structure and the related methodologies.
27
Ref : Conditions d'activité de la population de Yaoundé : principaux résultats, enquête 1-2-3 phase 1, Juin 1993, 17 p. ; Le
secteur informel à Yaoundé : principaux résultats, enquête 1-2-3 phase 2, novembre 1993, 29 p. ; Consommation et conditions de vie des ménages à Yaoundé : principaux résultats, enquête 1-2-3 phase 3, décembre 1993, 25 p. ; DIAL-DSCN,
Paris-Yaoundé.
L'emploi, le chômage et les conditions d'activité dans l'agglomération d'Antananarivo, Enquête 1-2-3 phase 1, juin 1995, 31
p. ; Le secteur informel dans l'agglomération d'Antananarivo, Performances, Insertion, Perspectives, Enquête 1-2-3 phase 2, 49 p. ; La consommation et le rôle du secteur informel dans la satisfaction des besoins des ménages dans l'agglomération
The Poverty Reduction Objective
The Bangladesh Government launched in the early 1990s a comprehensive economic reform programme aimed at opening up the country and establishing a liberalised, market-based, and private sector-driven economy with substantial support from the international community. This implies reforming the public service, privatising the state-owned enterprises, improving agriculture productivity and promoting a dynamic private sector28. The objective is to remove bottlenecks through an appropriate fiscal legislation and a more efficient banking system, in order to create an environment favourable to the private sector development. And consequently attract international private investors. The recent dynamism shown by such sectors as the garment, the frozen food, the fisheries and leather industries is a testimony of what could be done.
However, while it is recognised that the development of the private sector will generate employment opportunities, little is said on the mechanisms that could be used to integrate the poorest segment of the population into the labour market and to let them participate in and benefit from the growth. This is still an issue that needs to be addressed to bring new grounds to the present national poverty alleviation strategy. This latter emphasises three direction for action:
(i) the generation of a labour-intensive economic growth based on the job creation in the micro and small-scale enterprises, with credit facilities, technical assistance and training to increase productivity;
(ii) the development of human resources through food security and easy access to health and education; and
(iii) the design of safety nets for the poorest, and the most vulnerable, through food for work, small credit and public works.
The first point of this strategy leads to the design of policies oriented toward the small and cottage industries since they present a lot of advantages in terms of employment and income. They create immediate gainful opportunities with relatively less investment per unit of employment (and with a short gestation period) than the big companies. They answer to substantial parts of the increasing demand for consumer goods at low prices. They exploit skills which are often unused or under-utilised. Finally, they contribute directly to the struggle against poverty, partly by removing the inequality of the income distribution.
For these reasons, a greater importance should be given to development strategies for the small and cottage industries sector. Moreover, it is also worth noting that a country considered as poor according to his GDP per capita, but having a comprehensive network of small and cottage industries, will be better ranked in terms of power purchasing parity, due to its capacity of satisfying the local demand at low production cost.
However, a distinction has to be madee between those, unemployed or underemployed, who conduct survival strategies, and those having a wider vision of their role in the labour market due to their large human and social capital. In the former case, policies focus on improving the basic income by generating new employment opportunities. In the later case, they provide incentive to reorient the self-employed and cottage industries entrepreneurs towards the development of small export industries.
Since part of these industries belongs to the informal sector and therefore escapes to any measurement, their importance is therefore underestimated. This has several serious consequences. First, the GDP and its growth rate are regularly underestimated. Second, the social issue of employment is not treated correctly. Third, scarce funds are allocated to enhance the development of the small and cottage industries. Few actions favour the integration of the informal sector into the regular industrial sector.
Through appropriate policies, it is possible to keep the innovative capacities of the informal sector and its ability to integrate newcomers on the labour market, and to devise, according to their needs, flexible mechanisms - such as the creation of self-employed networks, production co-operatives, enterprises unions, production chains, etc. - that would promote its development and transform itself, through growth and duration, into formal industries and services.
Therefore, the following key issues need to be addressed when designing poverty alleviation policies: (i) the promotion of self-employment and the creation of cottage industries as a way to escape from poverty, (ii) the capacity of households to develop their own businesses from self-employment to small industries, and (iii) the effective contribution of small and cottage industries to the National Income29. In more general terms, it implies to assess the link between unemployment, poverty, and micro-enterprises, informal or not, in urban areas. Most
28
Ref: Bangladesh. Annual Economic Update : Recent Economic Developments and Medium-Term Reform Agenda, July 1996, The World Bank, Washington, 56 p.
29
This is a contribution to the BBS project "Strengthening the National Accounts" which is partly financed by the Asian Development Bank.
of the data collected through the regular households surveys have scarcely been designed or processed with that objective in mind.
The Need for Relevant Information
The Bangladesh Small and Cottage Industry Corporation (BSCIC) is the official body which monitors the development of self-employment, cottage industries and small enterprises. It produces statistics on the types of enterprises, their activities and the number of people employed. However, the numbers of the self-employed and, to a certain extent, of the cottage industries appear underestimated and no disaggregation is made between those belonging to the informal sector and the others. Furthermore, it is not possible to relate the employment issues and the development of the small and cottage industries to the poverty issues.
On the other hand, the BBS, through its various operations collects information on employment and poverty, but the link with the small and cottages enterprises is not easy to establish because either the adequate data are not collected, or the sample is too small for specific analysis in urban areas (e.g. HES, LFS and PMS).
There is, consequently, an opportunity to design and implement an appropriate survey that could fill this gap and be tested, as a pilot experiment, on a few urban areas where self-employment and cottage industries are predominant. It should be an innovative tool that complement, for a short period of time, the existing surveys in order to test new methodologies and examine how they could be further integrated in the overall information system. This justifies the decision to give to the BBS the means of promoting a new operation, and, by this way, improve the production of timely reliable data.
In this context, the 1-2-3 Survey is able to bring a possible answer since its objective is to collect data on urban areas where small businesses are spreading over, with the objectives of studying the distribution of employment, the distribution of income and the emergence of self-employment and cottage industries. Focusing on a sub-sample of entrepreneurs, it collects data on their businesses thus providing information for the system of national accounts (such as estimates of production, inputs, added value, investment, etc.) and for the policy makers (the constraints to job creation, credit, and the capacity for development of small industries, etc.).
However, the survey should be perceived as a "light" or small scale survey, a complementary tool to what is existing. It creates a "zoom effect" on a particular topic : the issue of self-employment and cottage industries, and on a particular relation : the link between the household's fight against poverty and its ability to generate income through micro-enterprises.
Through this data, it will be possible to study the life pattern of a sample of cottage industries and to conceive various policy interventions. For instance, the access to small credit for the self-employed and the cottage industries, the access to the information on market opportunities for the low-paid labourers, the organisation of training sessions, etc., in order to facilitate the switching from self-employment to cottage industries, and then to small enterprises. This is one of the best ways to fight against unemployment in urban areas and therefore to alleviate poverty.
2.2. An Adaptation of the 1-2-3 Survey
The standard 1-2-3 Survey has not the measurement of poverty as a priority objective. It aims at understanding employment issues, at relating them to the informal sector and at measuring the consumption of the informal sector's products. But this survey has a very interesting characteristic: it relates information on enterprises to those in employment through the selection of individual entrepreneurs. Therefore, by adding a link to poverty through an appropriate module and by focussing on the small and cottage industries instead of the informal sector alone, it is possible to satisfy the information needs of the Bangladesh policies' design.
Three features characterise a 1-2-3 Survey: it is a light household survey, it is conducted through a sequence of three phases related one to the other by the sample design, and (iii) it focuses on the urban areas. The Bangladesh survey keeps these characteristics, even though important changes in structure and methodologies are made.
A Light Household Survey
Even if it gathers information on enterprises, the 1-2-3 Survey is a household survey. It is through a household sample that information on employment and poverty is collected and through a sub-sample of household members entrepreneurs that the information on enterprises is obtained.
The size of the household samples varies from one town to the other according to its size and to the range of its activities: for instance, 5,000 households in Dhaka, 3,000 households in Chittagong, 2,000 in Tangail and 2,000 in Rangpur. These sample sizes are compromises between the search for representative samples, for adequacy to the socio-economic environment and for easy management of the survey teams.
To make the survey easier to manage for data collection and to control for data quality, it was divided into three complementary phases. Therefore short questionnaires could be designed, thus decreasing the length of each interview which is kept at about one hour and a half including transportation.
A Three-Phase Survey
To satisfy the objective of collecting data on employment, poverty and small and cottage industries without increasing the size of the survey and the amount of information to be processed, the Bangladesh survey is broken down into three sequential phases, each of them focusing on a specific topic. This is the main difference from the standard 1-2-3 Survey. The first phase on "Employment" focuses on the activity of the household members to estimate the rates of activity and unemployment at the national level, the characteristics of the working population (employees vs. entrepreneurs, wage earners vs. unpaid family helpers, etc.) and its distribution within the activity sectors (public vs. private, small and cottage vs. medium and large industries). A filter is created, while processing the data, to identify the household members who are entrepreneurs of small and cottage industries, including the self-employed, and are to be investigated during the third phase. This filter is used during the third phase to classify all enterprises according to their size, and through relevant criteria such as the number of registration, to distinguish those belonging to the informal sector.
The second phase on "Poverty" has the objective of measuring the standards of living. It collects information on the expenditures and the satisfaction of basic needs (health, education, housing, etc.) on the same sample of households than the first phase. It has to be carried out just after the employment one to bound the recall period for the household expenditures. Therefore the recall period boundaries correspond to the dates of the first and the second phase interviews. During the economic analysis, reference to the usual BBS poverty lines based on the per capita consumption distribution, will help define the poverty classes. This information is crossed with the one of the previous phases to relate unemployment to poverty and employment to the level of living.
The third phase on "Cottage industries" concentrates on the sub-sample of entrepreneurs, self-employed, heads of cottage and small industries selected at the end of the first phase. It collects data on the management and the functioning of their businesses (manpower structure, capital and investment, relations to the various markets, added value and capacity to generate income, main development constraints and perspectives). This information is crossed with the one of the previous phases to relate to both unemployment and poverty. Through an
appropriate definition of the informal sector its contribution to the economy could be estimated by referring to the National Accounts.
This survey differs from the standard 1-2-3 Survey for several reasons. First, it focuses on the small and cottages enterprises as a whole instead of considering only the informal sector. Second, it considers the issue of poverty as a priority which leads to the collection of information on all the household expenditures instead of the consumption of informal products on a sub-sample of households. Third, it links the poverty issue to the creation of enterprise as a way to escape from unemployment, therefore imposing the poverty phase to rank second.
Therefore the enterprises are disaggregated by type (i.e. self-employment, cottage industries, small industries, medium and large enterprises) and size (with 10 persons and over as the threshold between cottage and small enterprises) instead of being selected through informality criteria. However, it is easily possible to assess to which extent, these enterprises belong to the informal sector by testing a few criteria such as having a trade registration number, written accounts, a social security number, etc., once agreed upon the set of criteria. Using the data collected during the third phase other analysis can be conducted such as the estimation of the likehood to leave the informal sector when the size or the duration of activity increase.
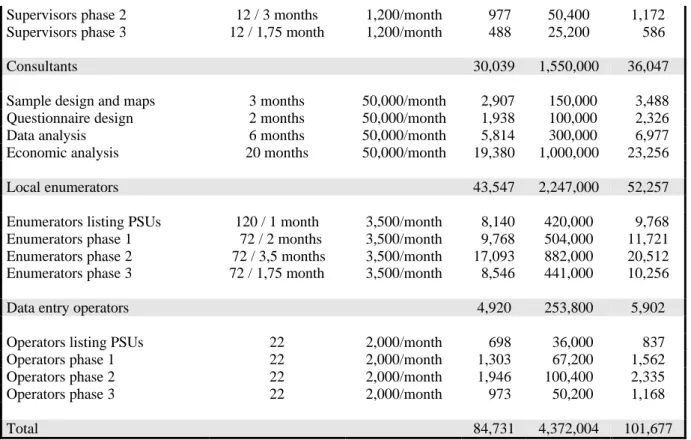
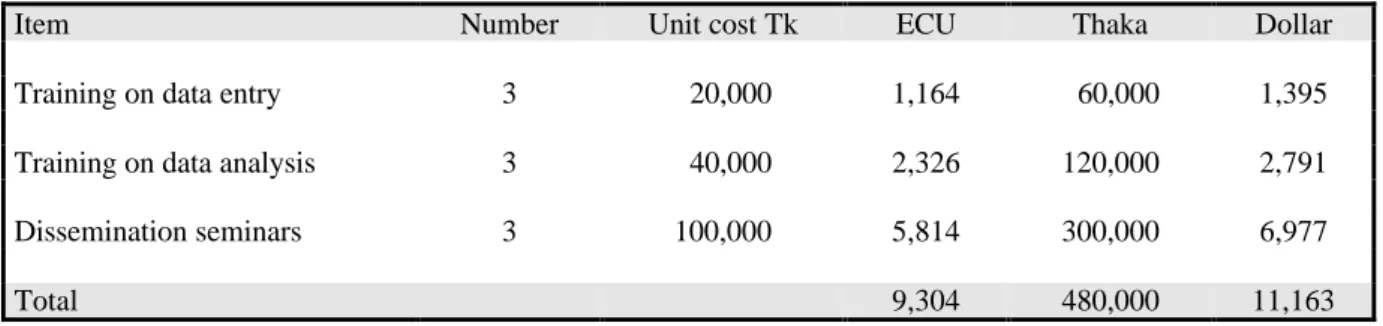
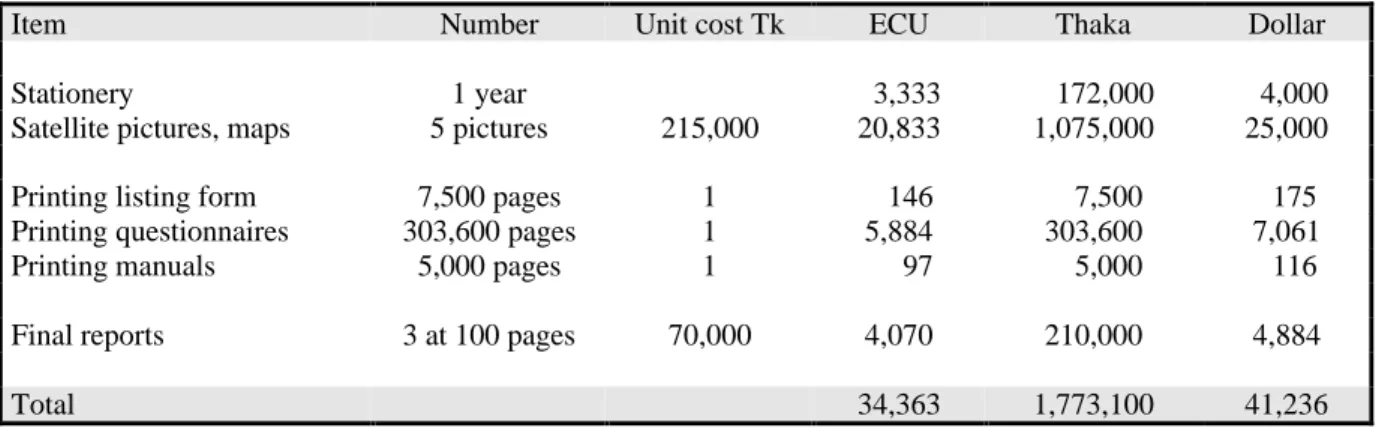
A detailed agenda presents the various phases of the survey and the corresponding implementation steps over a one year period (see annex 2). It covers and explains the costs related to the personnel, equipment, transportation, printing and data processing as well as for the technical assistance, and the training and seminar organisation (see annex 3 and 4).
An Urban Survey
The 1-2-3 Survey was originally conceived for the urban areas were most of the informal activities are, in relation to unemployment and underemployment. Therefore its adaptation answers automatically to the objective of urban poverty monitoring, by focusing on the urban areas where the incidence of poverty is rapidly increasing and where the self-employed and cottage industries thrive.
Following the advice of the BBS senior officials four towns were selected. Dhaka and Chittagong, were chosen among the four metropolitan cities and Tangail and Rangpur among the fourteen secondary cities for the following reasons.
Dhaka, with a population of 6,163,000 in 1991 and an estimated 7,631,000 in 1995, is the main city and the capital of Bangladesh. It stands out in all respects : the highest population
increase (24%) over the 1991/95 period, a high incidence of poverty (55%30), and 18,654 cottage industries and 5,119 small industries in 1991.
Chittagong is the second largest city and an important harbour. With a population 5,744,000 in 1991 and an estimated 6,194,000 in 1995, the increase in population was 8% over this period. The poverty incidence is about 68%, with 21,558 cottage and 4,292 small industries in 1991.
Tangail is one of the fourteen secondary cities. It was chosen due to its present position as a trade centre between Dhaka, the right bank of the Jamuna River and India. The new bridge over the Jamuna River, presently under construction, will help increase economic exchanges between the two sides of the river, thus leading to changes in the standards of living of the population. Its population was 3,108,000 in 1991 and is estimated at 3,318,000 in 1995, showing a total increase of 7% over the period. The number of cottage industries was 6,324 and of small industries 730 in 1991. The poverty incidence is presently estimated at about 55%.
Rangpur is an other secondary city. Situated in the North East of Bangladesh, it was selected because of its position not far away from the Indian border, through which basic inputs for cottage and small enterprises are crossing. Its population was 2,269,000 in 1991 and is estimated at 2,436,000 in 1995, corresponding to an increase of 7% over the period. The number of cottage industries was 5,197 and of small industries 430 in 1991. The poverty incidence is presently estimated at about 55%.
2.3. The Bangladesh Bureau of Statistics
In the field of poverty measurement much is done either by the BBS or by other institutions. A series of relevant studies was published and permanent data collection operations are being conducted.
For the BBS, this includes nation-wide operations such as the HES, the PMS, the LBS and the future Agricultural Census, all of them being able to link, to a certain extent, the issues of employment with those of poverty. For the other institutions, the focus is mainly on rural areas (for instance, the Analysis of Poverty Trends Project of the BIDS, the Nutritional Surveillance Project of Helen Keller International, Goal Monitoring Survey of UNICEF and
30
According to the Study of Urban Poverty in Bangladesh, Final Report, Asian Development Bank, May 1996, which is based on a poverty line of Tk 3,500, corresponding to a minimum calorie intake of 2,112 Kcal. However, this poverty line
BBS, etc.) and on basic needs : malnutrition and food security, access to health and education. Little information is now being collected on urban areas on income and activities (e.g. Helen Keller International).
Most of these samples are either rather small (e.g. HES, PMS and LLDMS) or not representative since they focus on specific areas (e.g. Helen Keller International, UNICEF and BIDS) or combine random and purposive sampling techniques like the LFS. All of them do not consider unemployment as the focus point and the key factor leading to poverty.
The 1-2-3 Survey brings new insights and the BBS plays a key role in its development and implementation through its Research, Training and Survey Wing. The results produced complement, particularly for urban areas, the data on poverty already collected by the HES, the PMS and the LFS.
The regional and thana officers are the BBS staff in charge of supervising the field operations in the four towns. Computer equipment and technical assistance are provided to their teams. Close collaboration with the other wings and several projects of the BBS insure the efficiency for both the production of the data and their dissemination. These include, for instance, the Computer and Data Processing Wing for data treatment, the Industry Trade Labour Statistics and National Income Wing for updating the National Accounts, the Reproduction Documentation Publication Wing for the dissemination of the results through reports and seminars, etc.
Besides the objective of producing timely reliable information on the link between unemployment, poverty and cottage industries, the 1-2-3 Survey also contributes to the strengthening of the BBS capacity for data collection and analysis. This is done by proposing innovative approaches in sample design and data processing, and organising training sessions at each phase of the survey to explain its objectives, the methodology used and expected analysis. The technical experts involved in any of the various phases of the survey will have to devote an important part of their time for the training of the BBS' staff through on-the-job training activities of as well as for in-office training sessions.
The BBS is the first beneficiary of this operation. First, the implementation of the 1-2-3 Survey complements the already existing operations through its "zoom effect" on some urban areas by focusing on employment, poverty and cottage industries. All methodologies developed are consistent with the current concepts and techniques used by the BBS for
sample design, poverty definition, self-employment, cottage industries, national accounts, etc., in its current surveys such as HES, PMS, LFS.
Second, the survey, as a pilot experiment, brings and tests innovative approaches in the survey methodology that could help the BBS in its permanent effort to increase efficiency in the production of reliable data. Two examples are the use of satellite remote sensing pictures for stratified sampling procedures and the decentralisation of data processing and analysis at the regional level.
Besides the BBS itself, all users of its data will benefit from the production of new and more precise information highlighting the link between poverty, employment and cottages industries in the urban areas. These include the planning Departments and Divisions in the public service, the University and its research centres, private and public research institutes and all donors, bilateral and multilateral, involved in the design of economic policies and in the implementation of development projects.
The survey is a pilot experiment which will last one year on the four towns of Dhaka, Chittagong, Tangail and Rangpur. Even if it brings new information on the joint issues of unemployment, poverty and cottage industries, it can not really monitor these issues on a long-term basis due to its short duration.
At the end of the project, an evaluation mission, including a specific evaluation of the 1-2-3 Survey, will debate the further steps. Its assessment will be based on the quality of the output - publications and seminars - and on the cost effectiveness of the data produced, as estimated by discussion with the various users. If the evaluation proves to be positive, the project should be pursued. Several alternatives related to the key objective of urban poverty monitoring have to be examined: either to extend the survey to a sample of towns representative of all urban areas in order to get representative results at the national level, or to conducted it again on the same sample in order to constitute a panel for the analysis of the enterprises behaviour. In both cases, the 1-2-3 Survey will have to be closely related to the PMS.
The European Union, which wants to play a key role in poverty monitoring, could confirm its interest in this topic by giving to the BBS the means to transform this pilot experiment into a regular poverty monitoring system on urban areas.
2.4. Implementation Issues
As for any survey, a series of steps is required to implement the 1-2-3 Survey. These includes the selection of the sample, the development of questionnaires, the planning of field
operations, the data processing, and the writing of the reports presenting the final results. A few issues pertain to each of these steps.
The Sample Design
Since, the 1-2-3 Survey is a household survey, a representative sample of households is selected in each town during the preparatory phase. This sample is used during both the first and the second phase to apply respectively the employment and the poverty questionnaires. For the third phase, a specific sub-sample of entrepreneurs, members of the previous households, is extracted from the household sample.
There is presently in Bangladesh no updated household sampling frame, since the last population census was conducted in 1991 and the current master sample (i.e. the Integrated Multi-Purpose Sample) did not take into account the recent sprawling of the urban areas. Therefore, the use of a two stages procedure for sampling remains the best way to select a representative sample of households.
Using a Probability Proportional to Size (PPS) procedure, a stratified sample of PSUs (Primary Sample Unit) is selected from the set of existing urban PSUs which covers all the municipality areas. The areas population density and the types of housing, which proxies the distinction between slums and residential areas, are the best stratification criteria. The listing (i.e. a small census) of all the households within each selected PSU constitutes an exhaustive sampling frame out of which a stratified sample is drawn through systematic sampling procedure. For the stratification, households are ordered, after the listing and before the selection, according to the activity of their head using the relevant variable gathered during the listing operation.
Cluster sampling of the households is not required since the distances between two of them in the urban areas is easily covered by the traditional means of transportation such as rickshaws or baby-scooters. A cluster effect appears at the first stage due to the PSUs selection. But stratification procedures at both the first stage - for the PSUs and based on the population density or the type of housing - and at the second stage - for the households and based on the head’s activity - will compensate the cluster sampling error.
The constitution of a sampling frame of PSUs requires a clear knowledge of the municipality borders and of the number of PSUs within these borders. The PSUs remain related to the census enumeration areas and the administrative mahallahs. Since the municipalities are regularly evolving in density, it may be necessary to look for recent aeroplane or satellite pictures (using, for instance, remote sensing from the SPOT and LANDSAT satellites) to
update the present maps and decide what are the enumeration areas and administrative mahallahs to consider.
Consequently, five operations are carried out to select the household sample of the first and the second phase: (i) the mapping of the municipality area and its stratification according to the population density and housing criteria, (ii) an update of the PSUs sampling frame following these criteria, (iii) the selection of PSUs through a stratified sampling proportional to the size, (iv) the listing of the households within each PSU selected, and (v) a stratified systematic sampling of the households through this list.
For the third phase, the largest definition of the activities and the type of entrepreneurs is considered to obtain a correct sub-sample of households’ members who are petty entrepreneurs. It includes the self-employed and the cottage industries with a size less than 10. However it may interesting for analytical purposes to consider the small enterprises which have developed between the first and the third phase, even if their size is higher.
The sample sizes are 5,000 households for Dhaka, 3,000 for Chittagong, 2,000 for Tangail and 2,000 for Rangpur are optimal. They are big enough to give good estimates of the available activities and of the income distribution, and to minimise the non-sampling errors, particularly those related to the management of large survey teams. Considering that the average size of a PSU is 250 households, out of which 20 are selected for interview, the number of PSUs required is 250 in Dhaka, 150 in Chittagong, 100 in Tangail and 100 in Rangpur. This allows a coverage wide enough in the present municipality areas.
In Tangail and Rangpur, since small enterprises are in insufficient numbers, it is difficult to have a representative sample of all activities. However, this category should still be considered for analytical purposes, i.e. to examine its specificity and to link its development with the cottage industries.
The Development of the Questionnaire
The whole household Dossier is composed of 36 questionnaires and divided in four parts (see annex 1). The first part includes information on the location and the team survey, on the set of questionnaires and the listing form. The listing form is used during the preparatory phase to list all households belonging to the PSUs selected and collect some basic information on them in order to constitute a sampling frame. This information concerns the serial number, the dwelling’s address, the name of the household’s head, the household’s size (male, female, total) and the main occupation of the head. It is be used to stratify the sample and to check that the household is still in the same location at each phase.
The three other parts refer to each of the field phases. Specific questionnaires are designed according to the main topic. For the first phase, focusing on employment issues, questionnaires 4 to 16 collect information on the household’s members, on their main occupation, secondary activity, unemployment, job history, etc..
For the second phase, focusing on poverty 17 to 27, questionnaires collect information on consumption including expenditures on goods and services, amenities, consumption of own production, gifts in kind, durable goods, etc., on the satisfaction of their basic needs like access to health and education and on their own perception of poverty.
The third phase, on small and cottage industries, collects information through questionnaires 28 to 36 on the self-employed entrepreneurs, the cottage businesses and the small enterprises, using the sub-sample of entrepreneurs selected after the first phase. Information relates to the location of the activity, the main characteristics of the unit, labour force, production, inputs and labour costs, customers and providers, equipment and investment, constraints and prospects.
These questionnaires are provided in a standard model (on paper and diskette) in order to facilitate their adaptation to the concepts and definitions currently in use in Bangladesh. Therefore, they require an in-depth review by the management team, for their content, format and structure, during the preparatory phase to ensure their relevance to the Bangladesh socio-economic context.
Once the final draft questionnaire is ready, a training session is organised in Dhaka for all the BBS staff involved in the supervision of the field operations (i.e. management team and headquarters staff, regional and thana officers for the four survey teams). It focuses on two points : the presentation of the objectives of the survey and of the three-phase questionnaires, and a field test to assess the relevance of the questionnaires and check the efficiency of the supervisors staff. A sample of 72 households randomly selected in Dhaka is quite enough to administer the field test. Following it, a revision of the questionnaire is organised to produce the printed final version.
Copies of the printed questionnaires are sent to the regional offices in numbers corresponding to the size of each sample. However, the pace of their production is related to the sequence of the three phases. While 12,000 copies for the first and for the second phases can be quickly printed, the number of questionnaires required for the third phase can only be available after the first phase analysis, to know the size of the entrepreneurs' sample to be surveyed.
A manual for the enumerators presents the basic concepts and definitions used, the structure of the questionnaire to ensure a clear understanding of the questionnaires. It also explains the survey objectives and the field procedures .
At the beginning of each phase, once the corresponding questionnaires are printed, a training session is organised by the BBS regional supervisors for the local enumerators recruited for the field operations. They learn how to use the questionnaires to collect data, to find answer to their questions in the manual, and to proceed within their team.
Conducting the Field Operations
At headquarters a survey management team is set composed of BBS staff and experts. It includes the project director, the survey manager, the data manager and the four regional field managers from BBS. Some national consultants, either the residential technical assistant or the experts coming on short missions assist the management team on technical issues.
In each town a survey team is under the responsibility of the regional field manager, with supervisors belonging to the BBS and enumerators recruited locally. According to the size of the sample there is 1 field manager, 5 supervisors and 30 enumerators in Dhaka; 1 field manager, 3 supervisors and 18 enumerators in Chittagong; 1 field manager, 2 supervisors and 12 enumerators in Tangail and the same in Rangpur.
The survey agenda is based on the sequencing of the various phases. The preparatory phase which includes the listing operation last about 2 months. Each of the three other phases requires also approximately two months of data collection. The second phase lasts longer, due to the great number of questionnaires on expenditures and basic needs. The duration of the third phase depends on the number of entrepreneurs selected at the end of the first phase, but should last less than any of the other phases.
To ensure the quality of the data collected, control visits are scheduled in the field for the supervisors, regional officers and members of the management team. In each town, the daily control of the enumerators’ work is done by the supervisors, random visits by the field managers complement them. Periodic visits from the headquarters' staff supplement the control agenda.
The Data Management
A data manager, at headquarters, is in charge of all data processing operations. First, he is responsible for preparing the data entry programme using the IMPS package (as a possibility among others) available at the BBS. He writes the data entry manual for the operators presenting all operations and issues related to the three phases of the survey, i.e. the structure of the data entry programme, the data entry procedures, the consistency checks, and the way
to deal with the errors detected by the programme. This manual is the base for training sessions organised in the four towns at the beginning of each phase.
Second, his main job is to supervise the 22 data entry operators' work. Since the data entry operation is decentralised in the field, teams of data entry operators are constituted in each regional office. In Dhaka, the data entry team consists of 8 data operators, working on alternate time schedules, with 2 computers and 1 printer. In Chittagong, 6 operators also work on alternate time schedules, with 2 computers and 1 printer. In Tangail and in Rangpur, 4 operators work in the same way on 1 computer and 1 printer. To ensure a speedy data processing, the computers already provided by the Asian Development Bank during the last HES survey round are required besides those bought on the project itself.
It is innovative, and extremely motivating for the BBS staff of each town to have their, field managers able to produce the basic tables and indicators, since it updates instantly information on the issue of employment, cottage industries and poverty for the urban areas under their responsibility. This decentralisation of the data analysis requires the organisation of specific training sessions, by the data manager and experts in data analysis, on how to use the appropriate software to produce tables and indicators.
Consequently, four key operations are required to ensure a decentralised data processing at the regional level : (i) training of the operators on the data entry programme, (ii) data entry of the questionnaires and consistency checking, (iii) training of the field managers for data analysis on an appropriate software, and (iv) production of basic tables and indicators.
Complementary tables resulting from more complex procedures and in-depth analysis on specific topics are done in Dhaka at the BBS headquarters.
Expected Output and Dissemination
Several types of outputs are scheduled over the duration of the 1-2-3 Survey.
First, reports are produced at the end of each phase presenting the key results and corresponding analyses. Therefore reports on employment, on poverty, and on the small and cottage industries should be available at the end of the project. Their production is made by the staff assigned to the survey economic analysis, among which national consultants and experts specialised in economic analysis. This includes a series of indicators on the rates of activity and employment, the number of poor, the ratio of entrepreneurs in the population, the importance of the informal sector, etc.
Some sophisticated analysis on specific topics may require to combine data from various surveys sources such as HES, PMS, LFS, etc. The distribution of the occupations among the population, the distribution of the households' income, the relationships between employment