HAL Id: tel-02939539
https://pastel.archives-ouvertes.fr/tel-02939539
Submitted on 15 Sep 2020
HAL is a multi-disciplinary open access
archive for the deposit and dissemination of sci-entific research documents, whether they are pub-lished or not. The documents may come from teaching and research institutions in France or abroad, or from public or private research centers.
L’archive ouverte pluridisciplinaire HAL, est destinée au dépôt et à la diffusion de documents scientifiques de niveau recherche, publiés ou non, émanant des établissements d’enseignement et de recherche français ou étrangers, des laboratoires publics ou privés.
A framework for evaluating forest ecological
vulnerability in tropical deforestation fronts from the
assessment of forest degradation in a landscape
approach : Case studies from Brazil and Vietnam
Clement Bourgoin
To cite this version:
Clement Bourgoin. A framework for evaluating forest ecological vulnerability in tropical deforestation fronts from the assessment of forest degradation in a landscape approach : Case studies from Brazil and Vietnam. Geography. Institut agronomique, vétérinaire et forestier de France, 2019. English. �NNT : 2019IAVF0027�. �tel-02939539�
NNT : 2019IAVF0027
T
HESE DE
D
OCTORAT
préparée à
l’Institut des sciences et industries du vivant et de l’environnement (AgroParisTech)
pour obtenir le grade deDocteur de l’Institut agronomique vétérinaire et forestier de France
Spécialité : Géographie
École doctorale n°581
Agriculture, alimentation, biologie, environnement et santé (ABIES)
par
Clément BOURGOIN
A framework for evaluating forest ecological vulnerability in tropical
deforestation fronts from the assessment of forest degradation in a landscape
approach: Case studies from Brazil and Vietnam
Directeur de thèse : Valéry GOND Co-directeur de la thèse : Lilian BLANC
Thèse présentée et soutenue à Montpellier, le 18.12.2019 : Composition du jury :
Mme Sandra LUQUE, Directeur de Recherche, IRSTEA Montpellier Présidente
M. Frédéric GOSSELIN, ICPEF (HDR), IRSTEA Nogent-sur-Vernisson Rapporteur
M. Frédéric ACHARD, Chercheur, JRC Italie Rapporteur
Mme Aurélie SHAPIRO, Chercheur, WWF Berlin Examinatrice
M. Maxime REJOU-MECHAIN, Chargé de Recherche, IRD Montpellier Examinateur
Mme Laurence MOY, Professeur des Universités, Université de Rennes-2 Rennes Examinatrice
M. Yves LAUMONIER, Chercheur, CIRAD Indonésie Examinateur
M. Valéry GOND, Chercheur, CIRAD Montpellier Directeur de thèse
CIRAD UPR 105 – Forets et Sociétés Campus international de Baillarguet
2
A framework for evaluating forest ecological vulnerability
in tropical deforestation fronts from the assessment of
forest degradation in a landscape approach:
Case studies from Brazil and Vietnam
Clément Bourgoin
Supervised by Valéry Gond, Lilian Blanc, Louis Reymondin, Peter Läderach and Johan Oszwald
A thesis presented for the degree of Doctor at
AgroParisTech
4
Content
CHAPTER 1 - GENERAL INTRODUCTION ... 20
1.1BACKGROUND ... 22
1.2KEY CONCEPTS LINKING FOREST DEGRADATION WITH BROADER LANDSCAPE DYNAMICS TO ASSESS FOREST VULNERABILITY ... 26
1.2.1 Forest degradation... 26
1.2.2 Landscape approach of land use and land cover change dynamics to analyze forest degradation .... 29
1.2.3 Ecological vulnerability of degraded forests to agricultural expansion ... 34
1.3LITTERATURE REVIEW OF FOREST DEGRADATION AND LANDSCAPE APPROACH TOWARDS THE ASSESSMENT OF FOREST ECOLOGICAL VULNERABILITY ... 36
1.3.1 Characterizing structures resulting from forest degradation using remote sensing ... 36
1.3.2 Land use characterization and landscape temporal dynamics for vulnerability assessment... 41
1.4RESEARCH QUESTIONS AND OBJECTIVES ... 43
1.5STUDY SITES: HUMAN-DOMINATED TROPICAL LANDSCAPES IN DEFORESTATION FRONTS ... 45
1.5.1 Paragominas municipality, state of Pará, Brazilian Amazon ... 46
1.5.2 Di Linh district, Lam Dong province, Central Highlands of Vietnam ... 49
1.6THESIS STRUCTURE ... 54
CHAPTER 2 - THE POTENTIAL OF MULTISOURCE REMOTE SENSING FOR MAPPING THE BIOMASS OF A DEGRADED AMAZONIAN FOREST ... 56
2.1INTRODUCTION ... 59
2.2MATERIALS AND METHODS ... 61
2.2.1 Study Area ... 61
2.2.2 In Situ AGB Collection ... 62
2.2.3 Remote Sensing Multisource Data: Image Acquisition, Pre-Processing and Biophysical Indicators Variables Extraction... 63
2.2.4 Random Forest Regression Model ... 65
2.2.5 Geostatistical Analysis of Random Forest Model Residuals ... 67
2.2.6 Comparison with Avitabile et al. AGB Dataset... 67
2.2.7 Comparison with Degraded Forest Typology ... 68
2.2.8 Computational Aspects ... 68
2.3RESULTS ... 69
2.3.1 Model and Indicator Performance ... 69
2.3.2 Geostatistical Analysis of Random Forest Model Residuals ... 70
2.3.3 Above Ground Biomass Map ... 71
2.3.4 Comparison with Avitabile Pantropical Biomass Map ... 72
2.3.5 Comparison with Degraded Forest Typology ... 74
2.4DISCUSSION... 76
2.4.1 Model Performance Analysis ... 76
2.4.2 AGB Spatial Distribution in the Municipality ... 79
2.4.3 Characterization of Degraded Forests ... 79
2.4.4 How Can These Data Be Useful for Forest Management at the Regional Scale? ... 80
2.5CONCLUSION ... 81
CHAPTER 3 - UAV-BASED CANOPY TEXTURES ASSESS CHANGES IN FOREST STRUCTURE FROM LONG-TERM DEGRADATION ... 82
3.1INTRODUCTION ... 85
3.2MATERIALS AND METHODS ... 87
3.2.1 Study area ... 87
3.2.2 Data collection ... 88
5
3.3RESULTS ... 94
3.3.1 Forest canopy texture metrics from grey level UAV images at 1 ha scale ... 94
3.3.2 Relationships between canopy textures and forest structure parameters at 1 ha scale ... 95
3.3.3 Potential of canopy texture metrics to discriminate degradation history and the resulting changes in forest structures at the plot scale ... 96
3.4DISCUSSION... 99
3.4.1 Potential of canopy texture metrics to assess degraded canopy structures ... 99
3.4.2 Long-term forest degradation consequences on structure explained using current canopy textures100 3.4.3 UAV technology: from data acquisition to limitations and perspectives ... 101
3.5CONCLUSION OF CHAPTER 3 ... 102
3.6PERSPECTIVES ... 102
3.6.1 Multi-scale analysis of canopy structures of a tropical forest degradation gradient, from UAV to satellite VHSR ... 102
3.6.2 Reconstructing forest degradation history from Landsat time series... 107
CHAPTER 4 - PRIMARY FOREST DEGRADATION IN THE AMAZON: A LANDSCAPE APPROACH TO IDENTIFY THE MAIN DRIVERS ... 112
4.1INTRODUCTION ... 115
4.2MATERIALS AND METHODS ... 116
4.2.1 Framing the degradation of primary forest in a landscape approach ... 116
4.2.2 Study site ... 118
4.2.3 Data collection and methodology ... 119
4.3RESULTS ... 126
4.3.1 Land use/land cover classification of forest-agriculture mosaics... 126
4.3.2 Identification of the drivers of primary forest degradation ... 127
4.3.3 Mapping the drivers of primary forest degradation ... 129
4.4DISCUSSION... 131
4.4.1 Cascades of indirect and direct drivers of forest degradation in human-modified landscapes ... 131
4.4.2 Limitations and future outlook ... 132
4.4.3 Potential of characterizing and mapping forest degradation drivers for land use planning and targeted conservation actions ... 134
4.5 CONCLUSION ... 135
4.6 PERSPECTIVES OF FOREST POTENTIAL IMPACT ASSESSMENT ... 135
CHAPTER 5 - ASSESSING THE ECOLOGICAL VULNERABILITY OF FOREST LANDSCAPE TO AGRICULTURAL FRONTIER EXPANSION IN THE CENTRAL HIGHLANDS OF VIETNAM ... 140
5.1INTRODUCTION ... 143
5.2MATERIALS AND METHODS ... 145
5.2.1 Study area ... 145
5.2.2 Conceptual framework for assessing forest vulnerability ... 145
5.3RESULTS ... 152
5.3.1 Mapping LULC in 2018 ... 152
5.3.2 Defining landscape mosaics from LULC classification ... 153
5.3.2 Mapping historical land cover using the Landsat 1973-2018 archive ... 155
5.3.4 Deriving classes of landscape trajectories ... 157
5.3.5 Assessment of forest ecological vulnerability ... 159
5.4DISCUSSION... 161
5.4.1 Potential of vulnerability assessment for land use planning and targeted conservation actions ... 161
5.4.2 Methodological robustness and future outlook ... 162
5.4.3 Landscape approaches that incorporate both spatial and temporal information are keys to characterizing complex agricultural frontiers ... 164
6
CHAPTER 6 – SYNTHESIS, DISCUSSION, AND CONCLUSIONS ... 168
6.1SUMMARY OF THE FINDINGS ... 170
6.2GENERAL DISCUSSION ... 172
6.2.1 Promising methods to characterize forest structures from degradation... 172
6.2.2 Landscape approach to analyze dynamics of land use and cover changes ... 173
6.2.3 Vulnerability assessment to guide forest management and empower decision makers ... 175
6.3FUTURE PERSPECTIVES... 177
6.3.1 Scaling-up forest ecological vulnerability assessment from localized sites to regions ... 177
6.3.2 Potential addition of indicators and approaches to enhance forest ecological vulnerability assessment ... 179
MENTIONS AND NOTES TO THE READER ... 182
REFERENCES ... 186
7
List of Figures
FIGURE 1.1(A)TREE COVER,(B) FOREST LOSS,(C) FOREST GAIN AND (D) COLOR COMPOSITE OF TREE COVER IN GREEN, FOREST LOSS IN RED, FOREST GAIN IN BLUE AND FOREST LOSS AND GAIN IN MAGENTA, FROM HANSEN ET AL.(2013) ... 23 FIGURE 1.2GEOGRAPHY OF CARBON DENSITY CHANGE (GAINS, LOSSES AND NO CHANGE) FROM 2003 TO 2014, FROM BACCINI ET AL.
(2017) ... 23 FIGURE 1.3THE FUTURE OF TROPICAL FORESTS ARE DETERMINED BY THE SEVERITY AND DURATION OF THE ANTHROPOCENE
BOTTLENECK INFLUENCED BY THE CURRENT FOREST STATE, ONGOING PRESSURES AND MANAGEMENT RESPONSES, FROM (MALHI ET AL.2014) ... 24 FIGURE 1.4ADOPTED FRAMEWORK OF SIMPLIFIED DEGRADATION AND RECOVERY TRAJECTORIES AT THE FOREST STAND SCALE WHERE
AN ACCUMULATION OF DIFFERENT DIRECT DRIVERS (DISTURBANCES) SUCH AS LOGGING AND FIRE TRIGGER A RAPID CHANGE IN THE FOREST STRUCTURE AND FUNCTION.DASHED LINES REPRESENTS VARIOUS DEGRADATION AND RECOVERY CONDITIONS DEPENDING ON THE RESPECTIVE DISTURBANCE TYPE AND INTENSITY AND ENVIRONMENT/ECOLOGICAL CONDITIONS.THE TIME BETWEEN THE STAGES A TO F CAN ALSO VARY DEPENDING A MULTITUDE OF FACTORS.THE CASCADE OF INDIRECT DRIVERS OPERATING AT THE LANDSCAPE AND REGIONAL SCALE ARE NOT SHOWN IN DETAIL HERE. ... 29
FIGURE 1.5MULTI-SCALE FOREST SOCIAL-ECOLOGICAL SYSTEM WHERE LAND DYNAMICS ARE AT THE INTERSECTION BETWEEN HUMAN AND FOREST ECOLOGICAL SUBSYSTEMS AND UNDER THE INFLUENCE OF A CASCADE OF GLOBAL AND LOCAL DRIVERS, ADAPTED FROM TURNER ET AL.(2007),VIRAPONGSE ET AL.(2016) AND GARDNER ET AL.(2013). ... 30 FIGURE 1.6TWO COMPONENTS OF SPATIAL HETEROGENEITY: COMPOSITION AND CONFIGURATION (PARAGOMINAS LANDSCAPES,
SEPTEMBER 2017) ... 32 FIGURE 1.7 THE A,B,C PHOTOS REPRESENT AN INCREASING DEGREE OF FRAGMENTATION OF FOREST LANDSCAPE (PARAGOMINAS
LANDSCAPES,SEPTEMBER 2017) ... 33
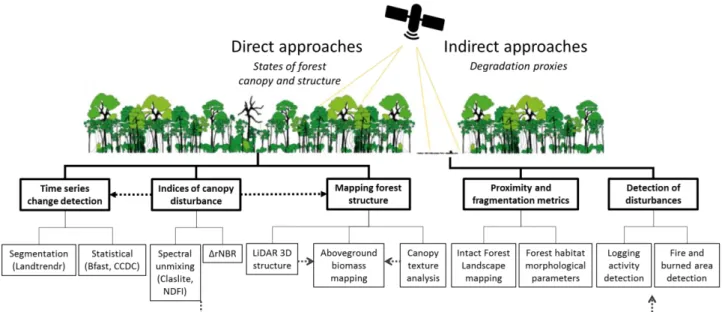
FIGURE 1.8CONCEPTUAL FRAMEWORK OF FOREST ECOLOGICAL VULNERABILITY AS THE COMBINATION OF EXPOSURE (EXOGENOUS), SENSITIVITY AND ADAPTIVE CAPACITY (ENDOGENOUS), MODIFIED FROM GALLOPÍN (2006) AND THIAULT ET AL.(2018). VULNERABILITY ASSESSMENT HAS A DIRECT LINK WITH DECISION-MAKING AND MANAGEMENT TO REDUCE EXPOSURE RISKS AND ENHANCE ADAPTIVE CAPACITY... 35 FIGURE 1.9DIRECT AND INDIRECT APPROACHES TO CHARACTERIZE FOREST DEGRADATION/DEGRADED FOREST USING REMOTE SENSING
AND NON EXHAUSTIVE LIST OF RELATED METHODS ... 36
FIGURE 1.10EXAMPLE OF THE TRAJECTORY OF THE NORMALIZED DIFFERENCE MOISTURE INDEX (NDMI) EXTRACTED FROM SURFACE REFLECTANCE LANDSAT DATA (FROM 1985 TO 2018) OVER A LOGGED FOREST IN 2005 IN PARAGOMINAS MUNICIPALITY.
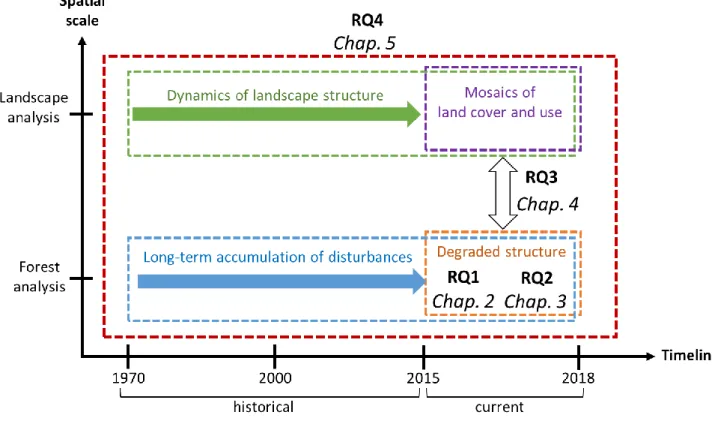
LIMITATIONS OF TIME SERIES CHANGE DETECTION APPROACH FOR THIS CASE ARE: THE DETECTION OF DEGRADATION TREND IS MIXED WITH NOISE AND NATURAL VEGETATION VARIATION, LARGE GAPS IN THE TIME SERIES (BEFORE 2000) PREVENT THE ALGORITHM TO TRAIN OVER HISTORICAL PERIOD (PRE-DISTURBANCE) AND THE SCALE OF THE DEGRADATION IS TOO SMALL TO BE DETECTED USING REMOTE SENSING TIME SERIES. ... 39 FIGURE 1.11OVERVIEW OF THE THESIS STRUCTURE WITH THE SUB-RESEARCH QUESTIONS AND RESPECTIVE CHAPTERS LOCATED
ACCORDING FOREST AND LANDSCAPE SCALES OF ANALYSIS AND CURRENT AND HISTORICAL TIMELINES ... 44
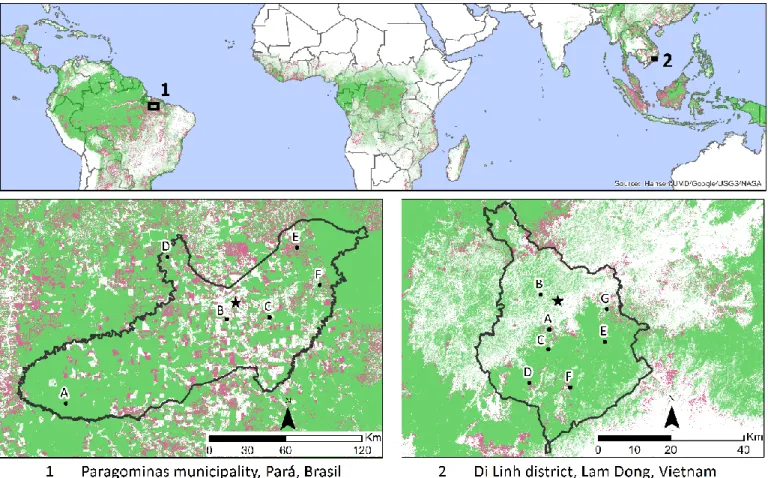
FIGURE 1.12STUDY SITES LOCATED IN HUMAN-DOMINATED TROPICAL LANDSCAPES OF DEFORESTATION FRONTS.GREEN SHOWS TREE COVER IN 2000 AND PINK FOREST COVER LOSS FROM 2000 TO 2014, SOURCE:(HANSEN ET AL.2010).LANDSCAPE MOSAICS NUMBERED BY LETTERS ARE PRESENTED IN FIGURES 1.15 AND 14.THE STAR REPRESENTS THE LOCATION OF THE MAIN CITY. .. 45
FIGURE 1.13ANNUAL DEFORESTATION INDEX IN PARAGOMINAS AND THE LEGAL AMAZON SINCE 2001(2001: BASE 100).SOURCE:
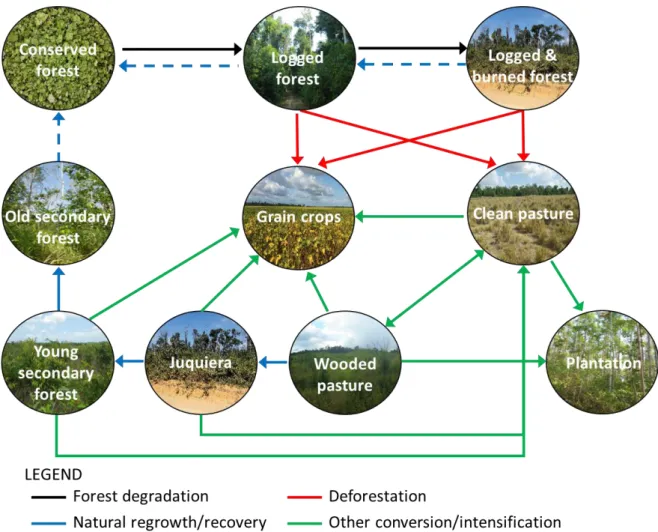
ADAPTED FROM PRODES DATA. ... 47 FIGURE 1.14SYSTEMIC MODEL OF LANDSCAPE ELEMENTS DYNAMICS IN PARAGOMINAS IN 2018(NON-EXHAUSTIVE).DASHED
ARROWS REFLECT LESS PROBABLE DYNAMICS. ... 48 FIGURE 1.15DIVERSITY OF LANDSCAPE MOSAICS AND LAND USES IN PARAGOMINAS MUNICIPALITY (2017).SEE FIGURE 1.12 FOR THE
LOCATION OF LANDSCAPE MOSAICS WITHIN THE MUNICIPALITY... 49
FIGURE 1.16AREA (HA) OF PERENNIAL CROPS IN LAM DONG PROVINCE, FROM 1990–2010(SOURCE:LAND USE, FOREST COVER CHANGE AND HISTORICAL GHG EMISSION (USAIDLEAF),LAM DONG PROVINCE,2013) ... 51
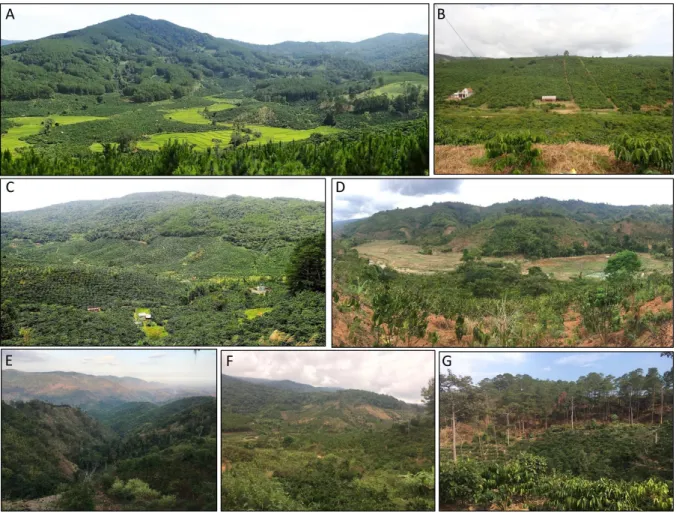
FIGURE 1.17SYSTEMIC MODEL OF LANDSCAPE ELEMENTS DYNAMICS IN DI LINH IN 2018(NON-EXHAUSTIVE).DASHED ARROWS REFLECT LESS PROBABLE DYNAMICS. ... 52 FIGURE 1.18DIVERSITY OF LANDSCAPE MOSAICS AND LAND USES IN DI LINH DISTRICT (2018).SEE FIGURE 1.12 FOR THE LOCATION OF LANDSCAPE MOSAICS WITHIN THE DISTRICT. ... 53
8
FIGURE 2.1MAP OF PARAGOMINAS MUNICIPALITY IN THE NORTHEASTERN PART OF THE STATE OF PARA WITH THE LOCATION OF THE BIOMASS-COLLECTED PLOTS, THE DEGRADED FOREST TYPOLOGY AND THE MAIN ZONING AREAS (EXTRACTED FROM (HANSEN ET AL.2010)). ... 62 FIGURE 2.2WORKFLOW OF THE EVALUATION OF THE INDICATORS PERFORMANCE IN AGB MODELLING AND MAPPING. ... 66 FIGURE 2.3EXPLAINED INDICATOR PERFORMANCE (PERCENTAGE OF INCMSE) OF THE RANDOM FOREST MODEL. ... 70 FIGURE 2.4(A)SPATIAL DISTRIBUTION OF THE MODEL RESIDUALS (BLUE, GREEN, YELLOW AND RED COLORS FOR THE RESPECTIVE FOUR
QUARTILES);(B)HISTOGRAM OF THE MODEL RESIDUALS;(C)VARIOGRAM OF BIOMASS MODEL RESIDUALS (THE GREY SHAPE SHOWS THE CONFIDENCE BAND INTERVAL EXPECTED FOR EACH DISTANCE CLASS). ... 71 FIGURE 2.5RANDOM FOREST PREDICTED VALUES OF ABOVEGROUND BIOMASS ACROSS PARAGOMINAS MUNICIPALITY.IN THE
WESTERN PART OF THE MUNICIPALITY (STRIPPED AREA),SENTINEL-1 DATA WAS NOT AVAILABLE. ... 72
FIGURE 2.6OBSERVED (SEE SECTION 2.2.2.) AND ESTIMATED BIOMASS FROM AVITABILE [23] AND THE RANDOM FOREST MODEL. . 73 FIGURE 2.7COMPARISON OF AGB ESTIMATIONS,RANDOM FOREST,AVITABILE (2016) AND THE DIFFERENCE MAP (1–3
RESPECTIVELY) IN A SELECTED ZONE REPRESENTING THE TRANSITION BETWEEN NON-FOREST TO FOREST AREA (SEE FIGURE 1 FOR PRECISE LOCATION IN PARAGOMINAS).THE SELECTIVE LOGGING AREA AND THE LOGGING ROAD WERE VALIDATED DURING THE FIELD TRIP. ... 74
FIGURE 2.8FIVE CLASSES OF DEGRADED FOREST TYPOLOGY BASED ON THE OBSERVATION OF 140 FOREST SITES IN MAY 2015. ... 75 FIGURE 2.9BOXPLOTS OF PREDICTED VALUES OF AGB CALCULATED FOR THE FIVE-CLASS TYPOLOGY OF DEGRADED FOREST WITH THE
RANGE (1ST AND 3RD QUARTILE), THE MEAN (LINE) AND THE MEDIAN (CROSS). ... 76
FIGURE 3.1LOCATION OF THE STUDY SITE,PARAGOMINAS MUNICIPALITY, IN PARÁ STATE IN THE BRAZILIAN AMAZON.DISTRIBUTION OF THE 40 FOREST PLOTS COVERED USING UAV.ILLUSTRATIONS OF SELECTIVE LOGGING (A), OVER LOGGING (B) AND FIRE (C)
FROM GOOGLE EARTH®2017 ... 87 FIGURE 3.2FOREST DEGRADATION HISTORY OF EACH FOREST PLOT (BASED ON THE FREQUENCY OF SELECTIVE LOGGING, OVER
LOGGING, FIRE EVENTS AND DATE OF LAST DISTURBANCE). ... 90
FIGURE 3.3WORKFLOW OF THE METHOD USED TO EVALUATE THE POTENTIAL OF CANOPY TEXTURE METRICS TO RETRIEVE THE CANOPY STRUCTURE ALONG THE GRADIENT OF FOREST DEGRADATION AND THEIR RELATION WITH FOREST DEGRADATION HISTORY... 91 FIGURE 3.4CANOPY TEXTURE ORDINATION BASED ON THE FOTO METHOD APPLIED TO UAV-ACQUIRED GREY LEVEL IMAGES.(A)
SCATTER PLOTS OF PCA SCORES ALONG F1 AND F2 AND WINDOWS SELECTED AS ILLUSTRATIONS.(B)HISTOGRAM OF EIGENVALUES EXPRESSED AS % OF TOTAL VARIANCE.(C)CORRELATION CIRCLES WITH FREQUENCIES RANGING FROM 50 TO 240 (CYCLES/KM). ... 94 FIGURE 3.5CANOPY TEXTURE ORDINATION BASED ON THE LACUNARITY METHOD.(A)SCATTER PLOTS OF PCA SCORES ALONG F1 AND
F2 AND WINDOWS SELECTED AS ILLUSTRATIONS.(B)HISTOGRAM OF EIGENVALUES EXPRESSED AS % OF TOTAL VARIANCE.(C)
CORRELATION CIRCLES WITH SUB-WINDOW SIZES RANGING FROM 2 TO 102 PIXELS. ... 95
FIGURE 3.63D PLOTS OF DIGITAL HEIGHT MODELS OF THE (100X100 M) WINDOWS SELECTED TO ILLUSTRATE THE 6 FOREST STRUCTURE CLUSTERS.RADAR CHART SHOWS THE AVERAGE FREQUENCY OF OVER-LOGGING (OL), SELECTIVE LOGGING (SL) AND FIRE (F) DISTURBANCES DETECTED IN ALL FOREST PLOTS WITHIN A GIVEN CLUSTER. ... 97
FIGURE 3.7(A)SCATTER PLOT SHOWING THE DISTRIBUTION OF THE 40 FOREST PLOTS WITH COLOR BASED ON THE COLOR OF CANOPY CLUSTERS ON THE LINEAR DISCRIMINANT PLANE (LD1-2).INSET: PROPORTIONS OF LDA TRACE (B)CORRELATION CIRCLE OF
CTM WITH RESPECT TO THE TWO MAIN COMPONENTS (AXES) OF THE LDA(C)CONFUSION MATRIX BETWEEN OBSERVED AND PREDICTED CLUSTERS FOR THE 40 PLOTS (LDA CLASSIFICATIONS) ... 98
FIGURE 3.8MEAN AND SD VALUES OF CTM CALCULATED WITHIN THE 6 PREDICTED CLUSTERS USING LDA. ... 98
FIGURE 3.9 A)UAV GREYLEVELS (10CM) AND B)SPOT-6PANCHROMATIC (1.5M) ... 103
FIGURE 3.10METHOD WORKFLOW FROM FOREST PLOT MODEL TEXTURE/STRUCTURE CALIBRATION TO UPSCALING OF CANOPY STRUCTURE METRICS USING CANOPY TEXTURE ANALYSIS ... 104 FIGURE 3.11CANOPY TEXTURE ORDINATION BASED ON THE FOTO METHOD APPLIED TO SPOT GREY LEVEL IMAGES:HISTOGRAM OF
EIGENVALUES EXPRESSED AS % OF TOTAL VARIANCE AND CORRELATION CIRCLES WITH FREQUENCIES ... 105 FIGURE 3.12PREDICTION OF STANDARD DEVIATION OF CANOPY HEIGHT (100M RESOLUTION)... 106 FIGURE 3.13 WORKFLOW FOR DETECTING LOGGING DISTURBANCES... 108 FIGURE 3.14A)DETECTION OF LINEAR LOGGING DISTURBANCES IN 2009 IN CIKEL(UNDER FOREST MANAGEMENT), DETECTION OF
NONLINEAR DISTURBANCES OUTSIDE OF CIKEL IN 2017 ... 109
FIG 3.15INDICATORS OF FOREST DEGRADATION AT THE PLOT SCALE OF A CIKEL PLOT (UNDER FOREST MANAGEMENT) AND A PLOT NEVER EXPLOITED (CONSERVED PRIMARY FOREST) AND A PLOT ILLEGALLY LOGGED OUTSIDE OF CIKEL ... 109 FIGURE 4.1CONCEPTUAL FRAMEWORK OF DIRECT AND INDIRECT DRIVERS OF PRIMARY FOREST DEGRADATION AT THE FOREST PATCH,
9
FIGURE 4.2PARAGOMINAS MUNICIPALITY (C) AND ITS LOCATION ON THE DEFORESTATION FRONT (B) IN THE LEGAL AMAZONIA (A)
... 119 FIGURE 4.3WORKFLOW OF THE METHOD USED TO IDENTIFY AND MAP FOREST DEGRADATION DRIVERS AT THE LANDSCAPE SCALE. . 120 FIGURE 4.4ABOVEGROUND BIOMASS AND NON-PHOTOSYNTHETIC VEGETATION VARIANCE AS PROXIES OF PRIMARY FOREST
DEGRADATION (NON-PRIMARY FOREST IS SHOWN IN WHITE)... 121 FIGURE 4.5DIRECT AND INDIRECT DRIVERS OF FOREST DEGRADATION ... 122
FIGURE 4.6LAND USE/LAND COVER CLASSIFICATION COMBINING CURRENT LANDSCAPE MOSAICS AND 29 YEARS OF SECONDARY FOREST MAPPING USING LANDSAT IMAGES (FIG 4.6B TO FIG 4.6G ARE EXAMPLES OF THE HETEROGENEITY OF LAND USE/COVER MOSAICS). ... 127
FIGURE 4.7FOREST DEGRADATION PROXIES AND THEIR RELATIONSHIP WITH SOME DRIVERS OF FOREST DEGRADATION ... 129
FIGURE 4.8MAP OF CLUSTERS OF PROXIES OF DIRECT AND INDIRECT FOREST DEGRADATION DRIVERS.GREY BARS REPRESENT THE MEAN INDICATOR VALUE OF ALL THE CLUSTERS, EMPTY SLOTS MEAN THE VARIABLE WAS NOT SIGNIFICANT FOR THAT PARTICULAR CLUSTER... 130 FIGURE 4.9CLASSES OF LANDSCAPE TRAJECTORIES (T1 TO T10) BASED ON LAND COVER COMPOSITION AND CONFIGURATION
DYNAMICS FROM 1988 TO 2017 OBTAINED USING ACT-STATIS AND CLUSTERING METHODS ... 137
FIGURE 5.1METHODOLOGICAL FRAMEWORK DESIGNED TO ASSESS FOREST ECOLOGICAL VULNERABILITY WITH ITS FOUR STEPS (I-IV)146 FIGURE 5.2LOCATION AND CLASSIFICATION OF DI LINH DISTRICT (LAM DONG PROVINCE) IN THE CENTRAL HIGHLANDS OF VIETNAM.
... 153 FIGURE 5.3TRANSFORMATION OF LAND USE/COVER PATCHES INTO LANDSCAPE MOSAICS USING A REGULAR 360 M X 360 M GRID AND
SENTINEL-2 BASED CLASSIFICATION AT 10 M RESOLUTION (2018). A)HISTOGRAM OF EIGENVALUES EXPRESSED AS % OF TOTAL VARIANCE. B)CORRELATION CIRCLE OF THE FIRST TWO PCA COMPONENTS. C)CLASSES OF LANDSCAPE MOSAICS (L1 TO L15)
ACCORDING TO HIERARCHICAL CLUSTERING BASED ON THE FIRST SEVEN PCA COMPONENTS:AVERAGE COMPOSITION OF LAND COVER/LAND USE AND LANDSCAPE INTENSIFICATION SCORE ATTRIBUTED TO EACH LANDSCAPE MOSAIC CLASS. D)LANDSCAPE MOSAICS DISTINGUISHED ACCORDING TO THE LANDSCAPE INTENSIFICATION GRADIENT (SEE THE LEGEND TO FIG 5.3C) ... 155
FIGURE 5.4MAPS SHOWING 45 YEARS OF EVERGREEN FOREST, PINE FOREST, CROPLAND AND WATER COVER USING LANDSAT ARCHIVES AND RANDOM FOREST CLASSIFICATION ... 156
FIGURE 5.5CLASSES OF LANDSCAPE TRAJECTORIES (T1 TO T15) BASED ON LAND COVER COMPOSITION AND CONFIGURATION DYNAMICS FROM 1973 TO 2018 OBTAINED USING ACT-STATIS AND CLUSTERING METHODS.HATCHED AREAS REPRESENT WATER BODIES IN 2018(2%). ... 158 FIGURE 5.6FOREST ECOLOGICAL VULNERABILITY TO DEFORESTATION AND DEGRADATION (AGRICULTURAL LANDSCAPES ARE IN WHITE,
COMMUNES ARE DELIMITED IN GREY) ... 160
FIGURE 5.7AGREEMENT, OVERESTIMATION AND UNDERESTIMATION IN EXPERT AND SIMULATION BASED ECOLOGICAL VULNERABILITY ASSESSMENTS ... 163 FIGURE 5.8NUMBER OF FOREST LANDSCAPE MOSAIC AND LANDSCAPE TRAJECTORY PAIRS IDENTIFIED IN THE MOST VULNERABLE
10
List of Tables
TABLE 2.1AGB COLLECTION DATA IN THE MUNICIPALITY OF PARAGOMINAS (SEE BERENGUER ET AL.2014). ... 63 TABLE 2.2RANDOM FOREST MODEL PERFORMANCE (MEAN SQUARED RESIDUALS AND PERCENTAGE OF VARIANCE EXPLAINED FOR EACH OF THE 10 K-FOLD RANDOM FOREST MODELS). ... 69
TABLE 3.1RANDOM FOREST REGRESSION MODELS FOR THE PREDICTION OF CANOPY STRUCTURE METRICS (CSM) FROM CANOPY TEXTURE METRICS (CTM) ON GREY LEVEL IMAGES. ... 96 TABLE 3.2RANDOM FOREST REGRESSION MODELS FOR THE PREDICTION OF CANOPY STRUCTURE METRICS FROM CANOPY TEXTURE
METRICS (FOTO AND SKEWNESS) ON SPOT GREY LEVEL IMAGES. ... 105 TABLE 4.1LANDSCAPE STRUCTURE METRICS (COMPOSITION AND CONFIGURATION) ... 124 TABLE 4.2MULTIPLE LINEAR REGRESSION MODELS FOR THE PREDICTION OF FOREST DEGRADATION PROXIES (MEAN OF AGB, MEAN
AND STANDARD DEVIATION OF NPVV) FROM DIRECT AND INDIRECT DRIVERS.THE POSITIVE OR NEGATIVE SIGN REFERS TO THE TYPE OF CORRELATION (POSITIVE OR NEGATIVE). ... 128
12
Abstract
The conservation of tropical forest cover is a key to ensuring sustainable provision of multiple ecosystem services. However, increasing demography, demand for agricultural products and changes in land uses are affecting forest sustainability through degradation processes. A first step to tailor effective forest management is to identify most vulnerable forests and to characterize their drivers. The objective of this thesis is to develop a multidimensional approach to assess forest degradation and the relations with the broader dynamics of land use/cover towards the evaluation of forest ecological vulnerability. The thesis was applied in Paragominas (Brazil) and Di Linh (Vietnam) where large-scale deforestation driven by commercial agriculture shaped the landscape into land use mosaics with increasing degradation pressures. In Paragominas, degradation is linked with selective logging and fire implying changes in forest structure. We estimated the potential of multisource remote sensing to map forest aboveground biomass from large-scale field assessment of carbon stock and investigated the consequences of degradation history on forest structures. We found that canopy textures correlated with forest structure variability and could be used as proxies to characterize degraded forests using very high resolution images. Based on environmental, geographical factors and landscape structure metrics, we demonstrated that 80% of forest degradation was mainly driven by accessibility, geomorphology, fire occurrence and fragmentation. The drivers of degradation acted together and in sequence. The combination of current forest state, landscape dynamics and information on degradation drivers would be at the basis of ecological vulnerability assessment. In Di Linh, degradation is driven by encroachment of coffee-based agriculture. Field inventory of the different forest types and other landscape elements combined with Sentinel-2 images allowed to map with high precision the current land cover. We constructed trajectories of landscape structure dynamics from which we characterized the expansion of the agricultural frontier and highlighted heterogeneous agricultural encroachment on forested areas. We also identified degradation and fragmentation trajectories that affect forest cover at different rates and intensity. Combined, these indicators pinpointed hotspots of forest ecological vulnerability. Through the developed remote sensing approaches and indicators at forest and landscape scales, we provided a holistic diagnosis of forests in human-modified landscapes This thesis aims to pave the way for tailored and prioritized management of degraded forests at the landscape scale.
13
Résumé
La conservation du couvert forestier tropical est essentielle pour assurer la fourniture durable de services écosystémiques. Cependant, l'accroissement de la démographie, la demande de produits agricoles et les changements dans l'utilisation des terres affectent leur durabilité. L'objectif de cette thèse est de développer une approche multidimensionnelle pour évaluer la dégradation des forêts et les relations avec la dynamique de l'utilisation des terres afin d’estimer leur vulnérabilité. La thèse a été appliquée à Paragominas (Brésil) et Di Linh (Vietnam), où la déforestation due à l'agriculture commerciale a façonné le paysage en mosaïques d'utilisation des terres. A Paragominas, la dégradation est liée à l’exploitation sélective du bois et au feu impliquant des changements dans la structure forestière. Nous avons estimé le potentiel de la télédétection multisource pour cartographier la biomasse forestière aérienne à partir de données de stock de carbone et avons étudié les conséquences de la dégradation sur les structures forestières. Nous avons constaté que les textures de la canopée étaient corrélées à la variabilité de la structure forestière et pouvaient être utilisés comme indicateurs pour caractériser les forêts dégradées grâce aux images à très haute résolution. En nous basant sur des facteurs environnementaux, géographiques et de structure du paysage, nous avons démontré que 80 % de la dégradation était principalement due à l'accessibilité, la géomorphologie, la fréquence des incendies et à la fragmentation et que ces facteurs agissaient en séquence. A Di Linh, la dégradation est due à l'empiètement de la culture de café. L'inventaire sur le terrain des différents types de forêts et d'autres éléments, combiné aux images Sentinel-2, a permis de cartographier avec une grande précision la couverture du sol actuelle. Nous avons construit des trajectoires de dynamique paysagère afin de caractériser l'expansion de la frontière agricole et mis en évidence l'empiétement agricole sur les zones forestières. Nous avons identifié des trajectoires de dégradation et de fragmentation qui affectent le couvert forestier à différentes intensités. Ensemble, ces indicateurs ont mis en évidence des points chauds de vulnérabilité. Grâce aux approches et aux indicateurs de télédétection développés à l'échelle de la forêt et du paysage, nous avons fourni un diagnostic holistique des forêts dans les paysages modifiés par l'homme. Cette thèse vise à ouvrir la voie à une gestion adaptée et prioritaire des forêts dégradées à l'échelle du paysage.
14
Résumé substantiel
La conservation du couvert forestier tropical est essentielle pour assurer la fourniture durable de services écosystémiques. Dans les paysages anthropisés, la conservation des forêts doit également être conciliée avec la productivité agricole. Toutefois, l'accroissement de la démographie, la demande de produits agricoles et les changements dans l'utilisation des terres affectent la durabilité des forêts à travers des dynamiques de degradation complexes. Une première étape pour adapter la gestion efficace des forêts par les décideurs locaux consiste à identifier les forêts les plus vulnérables et à caractériser ce qui la génère. L'objectif de cette thèse est de développer une approche multidimensionnelle utilisant la télédétection et autres analyses spatiales pour évaluer la dégradation des forêts et les relations avec la dynamique de l'utilisation des terres afin d’estimer la vulnérabilité écologique des forêts.
L'examen des méthodes existantes illustre le manque de compréhension et de quantification des conséquences de la degradation à long terme sur la structure des forêts. Il met également en évidence les compromis à faire entre résolution, précision, superficie couverte, coût et fréquence pour cartographier les structures forestières dégradées et la biomasse forestière à travers des gradients de perturbations anthropiques. Par conséquent, un objectif de cette these est de mieux caractériser le large éventail de structures résultant de la dégradation via des approches de télédétection multidimensionnelle.
De plus, la degradation forestière est majoritairement étudiée dans des approches centrées sur le peuplement forestier et non sur des approches holistiques ou paysagères. Cela limite considérablement la compréhension des effets de cascade des facteurs directs et indirects de la dégradation et des influences des changements d'utilisation et de couverture des sols sur l'état du couvert forestier. Par consequent, nous avons peu de connaissances sur les moteurs de la degradation liés aux dynamiques complexes des changements d’utilisation des terres et des decisions de gestion des territoires sous-jacentes. Dans cette these, nous insistons sur le fait que la dégradation des forêts doit être analysée dans le cadre d'une approche paysagère afin de i) saisir les interactions entre les forêts et la dynamique plus large de l'utilisation de la couverture des sols qui rend compte des pratiques agricoles et des consequences de la gestion territoriale et ii) de caractériser les facteurs directs et indirects de la dégradation des forêts.
Enfin, il n'existe pas de méthodes ou de cadre conceptuel visant à caractériser la vulnérabilité du couvert forestier aux impacts anthropiques. L'évaluation de la vulnérabilité écologique des forêts permet d'intégrer différents indicateurs à l'échelle de la forêt et du paysage afin d’informer sur la
15
localisation des forêts les plus vulnérables et ainsi de hierarchiser les priorités de gestion des forêts dégradées en envisageant par exemple la conservation ou la restoration forestière.
Dans le chapitre 2 de la thèse, nous avons évalué le potentiel des sources de télédétection optique (Landsat, MODIS) et radar (ALOS-1 PALSAR), Sentinel-1) pour la modélisation et la cartographie de la biomasse forestière dans la commune de Paragominas (Brésil). Nous avons extrait un large éventail d'indices de végétation et de texture et les avons combinés avec des données de biomasse recueillies in situ au sein d’un modèle de régression pour prédire la biomasse des forêts à une résolution de 20m. Le modèle a expliqué 28% de la variance avec une erreur quadratique moyenne de 97,1 Mg-ha-1. Nous avons identifié les indicateurs les plus robustes ayant le plus grand pouvoir explicatif. La cartographie de la biomasses révèle que 87% des forêts restantes dans la commune de Paragominas sont dégradées, avec des activités d'exploitation forestière illégale et des impacts sur les lisières. Nous avons validé cette carte avec des inventaires terrain renseignant sur la structure forestière le long d’un gradient de dégradation.
Dans le chapitre 3, nous avons évalué comment l'analyse de la texture de la canopée pouvait saisir les complexités de la structure forestière résultants de différentes histoires de dégradation des forêts. Nous avons utilisé un drone léger pour cartographier 739 ha de forêts dégradées à Paragominas et 33 ans d'images d’archive issues de Landsat pour reconstituer l'historique de la dégradation par la détection des perturbations dues à l'exploitation forestière et aux incendies. Des analyses de texture de la canopée ont été utilisées pour évaluer la structure de la canopée forestière et pour établir une typologie reliant l'historique de la dégradation et l'état actuel. Les mesures de texture permettent de saisir le grain du couvert, l'hétérogénéité et gradients d'ouverture et sont en lien avec la variabilité de la structure forestière (r² : 0,58). Nous montrons que des structures forestières similaires partagent une histoire commune de dégradation et peuvent être discriminées grâce aux mesures de texture de la canopée (précision : 55%).
Dans le chapitre 4, nous avons identifié les facteurs directs et indirects de la dégradation des forêts en utilisant une approche paysagère qui permet d’aller au-delà de la détection directe des perturbations forestières. Nous utilisons des méthodes de regression et de clustering afin de cartographier les facteurs de dégradation des forêts primaires à partir d'un large ensemble de facteurs environnementaux et géographiques, et de mesures de la structure du paysage dérivées de la classification de l'utilisation/couverture des terres. Les modèles ont révélé qu'à l'échelle du paysage, l'accessibilité, la géomorphologie, la fréquence des incendies et la fragmentation ont été les principaux facteurs indirects et directs de dégradation (80% de la variance expliquée). Nous avons clairement montré que les facteurs directs et indirects de la degradation forestière ont agi ensemble et en
16
séquence révélant une utilisation différente des terres et donc des pratiques de gestion du couvert forestier différentes. Dans la partie centrale de la municipalité, les forêts sont dégradées en raison de la surexploitation passée du bois, qui a été indirectement renforcée par l'accessibilité aux parcelles forestières et au marché, et plus récemment en raison des conflits liés à l'expansion agricole et aux boucles de rétroaction négatives générées par la fragmentation. Dans les mosaïques de paysages plus complexes, les forêts sont dégradées en raison du résultat conjoint entre une degradation historique liée à la colonisation de cet espace et de facteurs plus recents tel que l’utilisation du feu dans les pratiques agricoles qui, s’il n’est pas maitrisé et controlé, peut impacter la structure des forêts. Ce phénomène est amplifié par le niveau élévé de fragmentation du paysage ainsi que des évenements de sécheresse de plus en plus intenses et longs. Connaitre et cartographier les facteurs de la degradation forestière à l’échelle du paysage permet d’engager des politiques de gestion du couvert adaptées.
Dans le chapitre 5, nous avons élaboré un cadre méthodologique rigoureux pour évaluer la vulnérabilité des forêts aux impacts anthropiques. Nous avons présenté une méthode novatrice qui intègre la cartographie actuelle des mosaïques de paysages avec les trajectoires de 45 ans de structures de paysages en utilisant des images Sentinel-2 et Landsat. Nous avons extrait des indicateurs d'exposition à l'expansion des terres cultivées, de sensibilité liée à la dégradation et à la fragmentation des forêts, et la capacité d’adaptation des forêts fondée sur la composition du paysage dans le district de Di Linh (Vietnam). Nous avons cartographié les mosaïques forestières-agricoles actuelles avec une grande précision pour évaluer l'intensification du paysage (indice kappa = 0,78). Nous avons également cartographié l'expansion de la frontière agricole et a mis en évidence l'empiètement hétérogène de l'agriculture sur les zones forestières (indice kappa = 0,72-0,93). Enfin, nous avons identifié des trajectoires de dégradation et de fragmentation qui ont affecté le couvert forestier à des rythmes et des intensités différents. Combinés, ces indicateurs ont mis en évidence les points chauds de la vulnérabilité des forêts. Cette étude a fourni des réponses et des leviers de gestion adaptés pour pour les décideurs locaux afin de donner la priorité aux actions visant à prévenir la dégradation future des forêts.
Enfin, nous présentons dans cette these une synthèse qui vise à discuter des méthodes les plus adaptées pour caractériser l’état du couver forestier resultant de la degradation et d’insister sur la pertinence de l’approche paysagère pour l’analyse des moteurs de la degradation conjointement avec la dynamique de changement d’occupation du sol. Ainsi, cette these vise à poser un cadre d’analyse de la vulnérabilité des forêts dans le but de guider la gestion future des forêts tropicales dans les paysages modifiés par l’homme où les enjeux environnementaux liés à la gestion du couvert sont majeurs.
17
Acknowledgements
J’ai pensé à la redaction de cette partie de remerciement dès mon premier jour de these, m’efforçant de mémoriser chaque personne ou institut qui ont contribué à son aboutissement. Je vais essayer ici de restituer au mieux cet exercice de mémorisation de 3 ans où j’ai eu l’opportunité de rencontrer des personnes exceptionnelles sur 3 continents et de partager des experiences humaines, culturelles et professionnelles assez incroyables.
Partons de la fin ou dirais-je du sprint final où on est tout essouflé et fatigué, merci aux (nombreux) membres du jury de these qui malgré les grèves et autres complications logistiques ont assuré leurs rôles d’évaluateur de ce travail: Sandra Luque, Laurence Moy, Maxime Réjou-Méchain, Yves Laumonier, Frédéric Achard, Frédéric Gosselin et Aurélie Shapiro.
Le plus gros des remerciements, je les dois à mon équipe choc d’encadrants/directeurs. Il y a tout d’abord le duo génial Valéry et Lilian qui jour après jour m’ont porté pour arriver à la fin de cette aventure. Que de discussions, de questionnements et de soutien (comme pendant le deuil du premier drone, rip) toujours dans une bonne humeur si agréable, que cela soit à baillarguet, dans un combi, au Pic Saint Loup, autour d’un verre/pizza ou sur le terrain… Je remercie mes encadrants du CIAT, Louis et Peter qui malgré la distance et autres difficultés m’ont aidé à intégrer un autre site d’étude et donc à compléxifier de façon positive le sujet pour aboutir à ce cadre d’analyse dont on est tous fier. Je ne remercierai jamais assez Johan pour toute l’aide qu’il m’a apporté, toujours entre deux blagues ou deux ACP dont il a le secret. J’ai hâte de faire du terrain au Canada avec toi. Enfin, mon cortège de personnes qui ont aussi passé un temps fou avec moi: Julie (la turbo compresseur/serveur de l’équipe), Hélène (la pro de l’analyse discriminate), Jacques Hugues & Chloé, Guillaume (R master), Jean-Stéphane, Renan (R master n°2), Solen, Trong (meilleur copilote de honda wave, malgré les ouragans), Pablo, Damien aux idées débordantes et Plinio le grand chef.
Merci aussi à toutes les personnes qui m’ont aidé sur le terrain, je pense notamment à René, aux dirigeants de la CIKEL (et aux ouvriers queridos), aux membres du DP Amazonie, aux collègues vietnamiens du CIAT et aux fermiers qui savent réparer les motos à coups de machette.
Ce qui était aussi génial et qui dynamisait les printemps et étés suffocants, c’était d’encadrer et/ou d’être encadré chaque année par des supers stagiaires, doctorants et postdoc. Alors là j’espère ne pas oublier quelqu’un : Giacomo, Andes, Amah, Elodie, Ophélie, Pierro, François, Begum, Sarah, Flo, Mario, Ali, Regis, Camille, ToinonmaisOui, Etienne, Gael, Malou, Fanny, Justine, Théo, Jimmy, Emna, Audrey, Gabriel, Thomas, Uday, Loic etc etc..
18
Merci aussi à l’unité F&S du CIRAD et au CIAT-Asie pour son accueil et son aide. A Daphné/deepl/Claire pour les traductions. Au CIRAD et à ABIES pour toutes les formations auxquelles j’ai pu participer. Enfin et on va s’arrêter là, merci à tous mes amis pour leur soutien : Mael, Julien, Alejandro, Kevin, Nicolas, Geoffrey, Audrey, Catherine, Marie, Louis, Le, Nhiem, Than, Donatien, Arnaud, Marcel, Brice, Lucia, Armando, Tiffany, Erik, Mao, Kien, Trung, Lisette etc. Pendant toute cette aventure, merci à ma famille (pas besoin de citer, ils se reconnaîtront), cette thèse est aussi la vôtre. De ses étoiles, j'embrasse mon cousin Arnaud.
20
Chapter 1 - General introduction
22
1.1 Background
Tropical forests located between the Tropics of Cancer and Capricorn have historically covered about 12 percent of Earth’s land area and now only make up less than 5 percent (Hansen et al. 2013). Yet, tropical forests are considered as the most diverse and complex biomes on Earth exerting major influences on weather patterns, freshwater, natural disasters, biodiversity, food and human heath from local to global scales (Thompson et al. 2009). Tropical forests house approximately two third of the planet’s terrestrial biodiversity (Gardner et al. 2009) and provide many ecosystem services (ES) which are essential to human well-being (MEA 2005). Tropical rainforests in particular (e.g. evergreen and semi-evergreen forest) play major roles in global climate regulation acting as carbon sinks, in water cycle regulation, protection of ecosystems from soil erosion, and provision of many goods (timber and non timber products) directly used by humans (Brandon 2014).
Tropical deforestation and forest degradation reduce or halt the flows of ecosystem goods and services (Seymour and Busch 2016). Collectively these two processes amount to the second largest source of anthropogenic emissions of carbon dioxide after fossil fuel combustion (Van Der Werf et al. 2009). They impact local to regional climate (Pielke 2005; Kalnay and Cai 2003), biodiversity (Barlow et al. 2016), soil degradation and livelihood (Lambin et al. 2001; Song et al. 2018). However, changes in land use and land cover provide essential provisioning services to humans (e.g. food, fiber and fresh-water). Most of worldwide forest loss (2.3 million square kilometers) from 2000 to 2012 was located in Brazil, Democratic Republic of the Congo and South East Asia (mainly Indonesia), though opposite trends of deforestation rates between countries are recorded (Hansen et al. 2013; Lewis et al. 2015)(Fig 1.1). The main driver of global forest loss in the tropics can be attributed to deforestation through permanent land use change for commodity production (Curtis et al. 2018).
23
Figure 1.1 (A) Tree cover, (B) forest loss, (C) forest gain and (D) color composite of tree cover in green,
forest loss in red, forest gain in blue and forest loss and gain in magenta, from Hansen et al. (2013) Compared with deforestation, information on the rates, locations and drivers of forest degradation vary widely as do the estimates for carbon emissions. In 2000, it was assessed that tropical forest degradation ranged from 350 to 500 millions hectares (20-30% of tropical forest cover)(International Tropical Timber Organization 2002). Forest degradation accounts for 25% (Pearson et al. 2017) to 68.9% (Baccini et al. 2017) of overall tropical forest carbon losses, and accounts for at least 15% of total carbon emissions from land-cover and land-use changes in the tropics (Houghton 2013)(Fig 1.2).
Figure 1.2 Geography of carbon density change (gains, losses and no change) from 2003 to 2014,
24
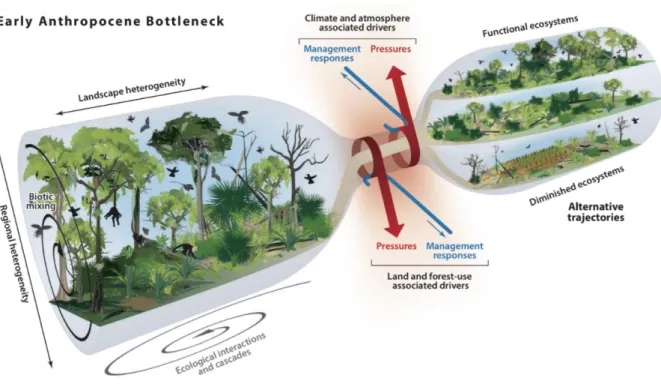
Deforestation and forest degradation shaped landscapes into a patchwork of forest, agricultural lands and other uses. Most remaining tropical forests experienced anthropogenic effects of logging and other resource extraction, wildfire and defaunation and keep experiencing increasing pressures from degradation and fragmentation dynamics (Malhi et al. 2014). Intact forests declined by 18% between 2007 and 2013, particularly in old pioneer fronts of Southeast Asia, Africa and Latin America (Tyukavina et al. 2016). Historical land/forest-use-associated drivers (i.e. degradation, fragmentation and agricultural expansion) determine the large range of heterogeneous status and configuration of current forest landscapes. Future forest landscapes will thus be shaped by both ongoing pressures and management responses (Malhi et al. 2014)(Fig 1.3).
Figure 1.3 The future of tropical forests are determined by the severity and duration of the
Anthropocene bottleneck influenced by the current forest state, ongoing pressures and management responses, from (Malhi et al. 2014)
Considering the importance of the extent and dynamics of forest degradation and their major consequences on the provision of forest ecosystem goods and services, there is an urgent need to better understand the heteregenous status of remaining forests and the pressures they are facing in order to plan management interventions to avoid and mitigate these pressures. However, fostering multiple transitions towards the improved management or restoration of forests within multifunctional landscapes and avoiding severe bottlenecks of degradation is only possible if there is a complete understanding of the vulnerability of forest cover to agricultural expansion and degradation.
25
Despite the potential of spatial analyses using remote sensing to monitor forests and land use/cover, the implementation of ecological vulnerability assessment based on the characterization of the status of remnant forests and the exogenous forces or pressures that affect forest cover is still rare (Malhi et al. 2014; Mitchell et al. 2017; Melito et al. 2018). Forest degradation is a complex multi-aspect phenomenon which makes the mapping of forest degradation indicators a challenge within the remote sensing community (Herold et al. 2011). There is a particular need to analyze forest degradation at the landscape scale in order to interconnect degradation and land use/cover change dynamics towards a better understanding of forest vulnerability. Such a spatially explicit assessment can inform decision makers on identifing the most vulnerable forests in order to prioritize tailored interventions through the direct reduction of exposition factors or through forest management and land use planning.
26
1.2 Key concepts linking forest degradation with broader
landscape dynamics to assess forest vulnerability
1.2.1 Forest degradation
While deforestation refers to a rapid conversion of land use, forest degradation describes a change in forest quality while remaining classified as forest. The difficulty in tackling forest degradation lie in the definition of this change and on the construction of indicators to capture it.
Deforestation is globally recognized as being the strict conversion of forest to other land uses (Achard et al. 2014). However, this definition remains reliant on the definition of forest itself, which varies in terms of tree size, area, and canopy density, while also depending on the perception and management objectives of each country or community (Chazdon et al. 2016; Sasaki and Putz 2009a; Putz and Redford 2010a). Nevertheless, the consensus on defining deforestation and the parallel development of remote sensing allowed the development of efficient methods to pinpoint and monitor deforestation at a large scale (Achard et al. 2007). Deforestation alert systems (Hansen et al. 2010; P. Potapov et al. 2019) are good example of this as they provide key near-real time information to decision makers for direct impact at the field (Leisher et al. 2013; Reymondin et al. 2012; Finer et al. 2018) and institution levels (« PRODES — Coordenação-Geral de Observação da Terra »). Latest developments are focusing on refining data spatial resolution towards more precise and accurate detection and on improving more frequent data acquisition thanks to the coupling of radar and optical images (Reiche et al. 2015; 2018; Bouvet et al. 2018).
By comparison, there is little agreement on the definition of forest degradation, making it more difficult to measure and monitor (Thompson et al. 2013; Putz and Redford 2010; Simula 2009; Bustamante et al. 2016). A degraded forest is the result of a process of degradation which negatively affects the structural and functional characteristics of that forest. Degradation triggers a reduction in the forest capacity to produce ecosystem services (e.g. carbon storage, wood products, soil protection, regulation of water supply and climate)(Vásquez-Grandón et al. 2018). Beyond this theoretical concept, there are more than 50 definitions of degraded forest and forest degradation (Lund 2009) that currently do not allow a practical understanding of the spatial and temporal complexities of degradation (Sasaki and Putz 2009; Putz and Redford 2010; Simula 2009). This lack of coherence in the definition of forest degradation is explained by several difficulties linked with the complexity of the phenomenon (Thompson et al. 2013a).
27
Forest degradation is a temporal process of disturbances accumulation
Degradation is often assimilated with human-made disturbances such as selective logging and understory fires (Matricardi et al. 2010; Asner et al. 2009; Souza et al. 2005). Each disturbance event affects the status of the forest by damaging the canopy and the internal structure without triggering any changes in land use (Putz and Redford 2010b; Herold et al. 2011). The damages in the forest structure depend on the type and intensity of the disturbance and can vary from limited gaps in the canopy from reduced impact logging to larger opening following unsustainable logging up to large scale destruction of the structure following fire (Rappaport et al. 2018). Repetitive unsustainable logging events weakens the forest structure triggering increasing tree mortality and drying effects, which will increase forest structure flammability (Morton et al. 2011). At the forest stand scale, degradation is therefore a multidimensional process within which the accumulation in space and time of disturbances are key factors for explaining the resulting degraded forest structure (Chazdon et al. 2016; Malhi et al. 2014). Moreover, the recovery (i.e. vegetation regrowth) in between disturbances is another crucial parameter that needs to be taken into account in forest degradation evaluation. The partial opening of the canopy further to selective logging or to forest fires is a transient problem that is difficult to detect as vegetation returns to these clearings at different rates depending on the state of the soil and the surrounding vegetation (Piponiot et al. 2016). At a larger scale (e.g. landscape to regional scales), degradation is driven by other parameters such as the increase of drought on edge areas (Briant et al. 2010), infrastructure development (Laurance et al. 2009) or fragmentation (Broadbent et al. 2008).
Forest degradation and loss of resilience
From an ecological point of view, degraded forests are forests that have lost their resilience capacity, i.e. capacity to return to their stable pre-disturbance state (Holling 1973; Gunderson 2000; Folke et al. 2004). Forests can naturally cope with “small impact disturbances” (storms, climate variability, pest and diseases, etc) and still retain their basic function and structure but intense and frequent disturbances can shift forest ecosystems into a state from which transitions back to the stable state are unlikely or can only occur after a long period of time (Thompson et al. 2009; Ghazoul et al. 2015). This definition calls for an understanding of two major concepts, the state of reference and the ecological threshold beyond which a forest is considered as degraded (Ghazoul and Chazdon 2017). A reference state or baseline may be used in the evaluation of degradation. It must be taken from forests located within the same edaphoclimatic zone and biome type (i.e. similar biophysical characteristics) with no sign of previous human-made disturbances (Tucker et al. 2008) which in practice is difficult to prove due to data limitation (Morales-Barquero et al. 2014). The ecological threshold or tipping point
28
is the instance where forest composition, structure and function are radically altered considering the reference and stable state. In practice, this boundary could be defined using a combination of ecological indicators (Thompson et al. 2013a) but remains at this time an unsolved limitation (Vásquez-Grandón et al. 2018).
Forest degradation and the influence of perceptions
Perceptions of forest degradation vary according to each individual and their own understanding of the degradation process. Some authors consider tropical forests to be degraded once the forest has been logged once (Foley 2005) whereas others consider it only when the forest has been heavily burned and logged several times (Souza et al. 2005b). There are currently two main opposing visions: the conservationist vision claims that any human presence or activity in a forest ecosystem are signs of degradation while the vision shared by users of forest resources following sustainable forest management practices claim that forest production is not a degradation. This antagonism is amplified by the fact that the term degradation is often perceived in a pejorative way by some actors, which can complicate its study (Sasaki and Putz 2009b).
Considering the different complexities linked with forest degradation raised previously, we stress the importance of characterizing the disturbances at the origin of degradation and identifying conserved forest. The adopted definition of degradation is the following:
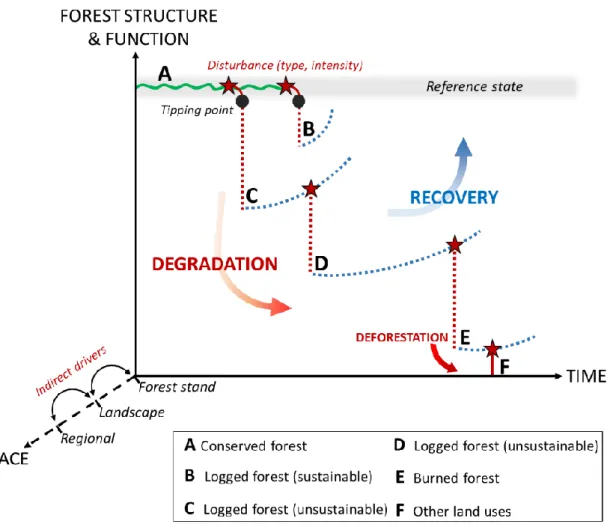
Forest degradation (process) is the accumulation in time and space of human-made disturbances operating at forest stand (direct disturbances such as logging and fire) and larger scales (indirect drivers), which affect the states of the forest by partially destroying the canopy and internal structure without triggering any changes in land use (Fig 1.4). Degraded forests (state) are therefore the consequence of complex degradation and recovery processes which radically differ in terms of structure and ecological functioning from a conserved forest i.e. reference state (no sign of recent historical disturbances).
29
1.2.2 Landscape approach of land use and land cover change
dynamics to analyze forest degradation
Among other natural resource management and environmental issues, tropical forest and its degradation can be analyzed using the social-ecological system (SES) approach built upon the dynamical and reciprocal interactions that exist between human systems and forest ecosystems (Ostrom 2009). Humans not only benefit from forest ecosystems but impact and shape their capacity to generate services (Folke et al. 2005). SES approaches allows for the dissection of complex cause-effects relationships involving multiscale influences and feedbacks. In a SES approach, forest
Figure 1.4 Adopted framework of simplified degradation and recovery trajectories at the forest stand
scale where an accumulation of different direct drivers (disturbances) such as logging and fire trigger a rapid change in the forest structure and function. Dashed lines represents various degradation and recovery conditions depending on the respective disturbance type and intensity and environment/ecological conditions. The time between the stages A to F can also vary depending a multitude of factors. The cascade of indirect drivers operating at the landscape and regional scale are not shown in detail here.
30
degradation analysis cannot be restricted to only forest ecosystems but needs to encompass broader scales and be linked with land use and cover change dynamics.
Land use and land cover changes (LULCC) are the result of the close interaction between human activities and their environment (Turner et al. 1995; Lambin et al. 2001; Foley 2005). Analyzing LULCC offer a better understanding of how decisions at the local scale affect land use change and how global drivers can influence these decisions (Lambin and Meyfroidt 2010; Turner et al. 2007; Geist and Lambin 2002). More generally, understanding the drivers, trends and impacts of LULCC on social and natural processes helps to reveal how changes in the land system affect the functioning of the socio-ecological system as a whole (Verburg et al. 2015). Land use change is influenced by driving forces involving the complex interaction of biophysical environments, socioeconomic activities, and cultural contexts in time and space. Global drivers relate to economic (e.g. market prices and capital flows) and biophysical factors and processes, access to technology and policies. Local drivers relate to farmer choices and practices but also on farming systems including demographic, social and cultural factors (Lambin et al. 2003). As a growing number of drivers at multiple spatial scales influence land use and land cover, and as these drivers interact in chain-linked or nested ways, they produce dissimilar land cover/use outcomes (Fig 1.5).
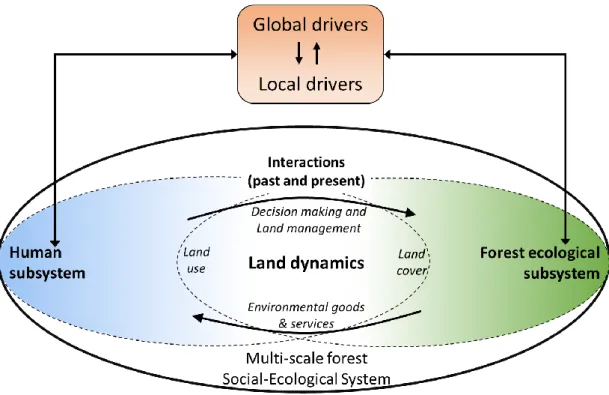
Figure 1.5 Multi-scale forest social-ecological system where land dynamics are at the intersection
between human and forest ecological subsystems and under the influence of a cascade of global and local drivers, adapted from Turner et al. (2007), Virapongse et al. (2016) and Gardner et al. (2013).
31
Characterizing forest social-ecological system throughout the interconnection of forest within land use and land cover dynamics are challenges closely linked with the landscape approach objectives. Integrated landscape approach aims at solving environmental, social and economic issues in unison within a geographical area composed by a variety of competing land uses and multiple stakeholders (Reed et al. 2016; Opdam et al. 2018). Landscape approaches show potential as a framework for balancing and finding trade-offs between conservation of natural resources and development i.e. improve social capital (enhance community income, employment opportunities) while reducing land degradation (Sayer et al. 2013). However, the implementation and evaluation progress of such approaches are still under development, mainly due to the difficulty in engaging diverse stakeholders (Reed et al. 2017; 2019).
In a spatially explicit approach, landscapes are the scale at which people and nature mesh and interact. The composition and configuration of a landscape both profoundly affect and are affected by human activities (Wu 2013). Landscape approach provides a supplementary level of understanding on LULCC as its scale encompasses spatial patterns that reveal the underlying social, environmental and ecological processes (Wu 2007; Messerli et al. 2009; Hett et al. 2012). Assessing drivers of change usually consists of interpretation of human–environmental interactions through the translation of land cover into land use information at the pixel scale. However, LULCC triggers changes at a larger scale where the spatial distribution and configuration of land use and cover types are key information for interpreting dynamics and underlying drivers (Messerli et al. 2009). Complex landscape mosaics resulting from long-term LULCC can be characterized using landscape approaches (Oszwald et al. 2011).
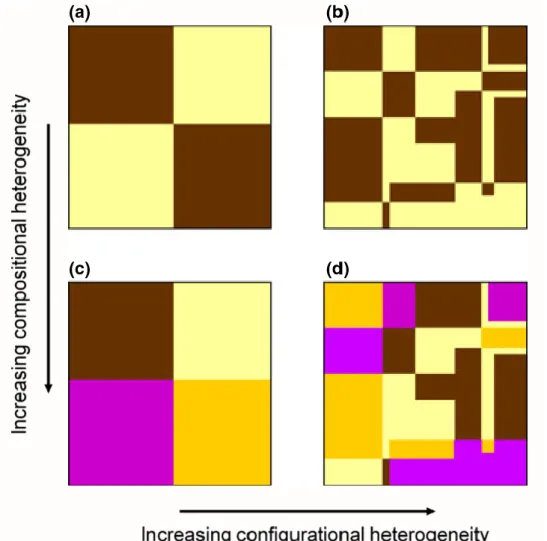
Spatial heterogeneity is a key concept for characterizing landscape mosaics. Spatial heterogeneity can refer to the quantification of the variation of a process in space. This general definition of functional heterogeneity can be applied to individuals, species, biological processes or other ecological variables (Fahrig et al. 2011; Katayama et al. 2014). Spatial heterogeneity can also refer to its structural dimension and becomes a measurable property of a considered landscape. Based on this concepts of structural heterogeneity, many methods allow quantifying the structure and spatial patterns of the landscape defined as the combination of landscape composition and configuration (O’Neill et al. 1997; 1999). This structural approach of spatial heterogeneity was adopted in this thesis in order to disentangle landscape structure dynamics i.e. the analysis of spatial structures or spatial arrangement of the landscape elements in relation to others (Burel and Baudry 1999). Spatial heterogeneity is based on two components: the diversity of landscape elements (composition) and the complexity of their spatial relationships (configuration). The heterogeneity of composition increases with an increase in
32
the number of land cover types. The configuration heterogeneity increases with an increase in the complexity of the spatial organization of these land covers (Fig 1.6).
Figure 1.6 Two components of spatial heterogeneity: composition and configuration, extracted from
Fahrig et al. 2011.
Spatial heterogeneity can be described through the concepts of fragmentation and connectivity. Fragmentation is the transformation of a large area of habitat into a greater or lesser number of fragments of varying sizes, whose total area is smaller than that of the original habitat and which are more or less isolated from each other (Fig 1.7). Spatial connectivity is defined by the fact that two patches of same land cover type are adjacent or joined in space.
33
Figure 1.7 The a,b,c photos represent an increasing degree of fragmentation of forest landscape
(Paragominas landscapes, September 2017)
The notion of scale in landscape approach is essential, as it will have a direct impact on the LULCC process that need to be characterized in both space and time dimensions (Burel and Baudry 1999). Here, the spatial scale refers to the resolution of the map and to the extent within which the different metrics related to fragmentation, connectivity and heterogeneity will be computed while temporal scale refers to the gap of time between the dates of the analysis.
To conclude, forest cover is integrated within a mosaic of land use and cover types in constant mutual interaction. As highlighted above, there is a need to combine social-ecological system, land dynamics science and the quantitative aspect of landscape approaches for better characterizing forest degradation:
Forest degradation must be analyzed within a landscape approach in order to i) capture human-environment interactions occurring between forests and the broader land use and land cover dynamic and ii) to characterize the direct and indirect drivers of forest degradation. A landscape is a geographical area of varying extent characterized by specific structure (i.e. composition and configuration of landscape units or land cover types) which transcribes specific LULCC history, human practices and governance.
34
1.2.3 Ecological vulnerability of degraded forests to agricultural
expansion
Analyzing forest degradation and its drivers (interacting factors and feedback loops between human and forest ecological systems) at the landscape level are key elements for better understanding and characterizing the vulnerability of forest cover within human-modified landscapes. The concept of vulnerability directly emerges from the social-ecological system framework as it focuses on the consequences of mutual interactions between exogenous and endogenous processes. Forest resilience is often compared with vulnerability but these two concepts are very different. Resilience refers to the capacity of a system to anticipate, absorb or recover from the effects of perturbations and other stressors, and to ensure the preservation, restoration or improvement of its structure and functions (Holling 1973; Folke et al. 2004). Resilience and vulnerability are both related to understanding the response of systems to change and share common elements but resilience is not the flip side of vulnerability (Adger 2006). While resilience focuses on the preservation of a system within a stable state, vulnerability refers to the propensity or predisposition a system to be adversely transformed. Moreover, resilience is an internal property of the system and does not include exposure to perturbations (Gallopín 2006). Vulnerability is better adapted to multidimensional degradation processes. In the context of old deforestation fronts where historical and current processes of forest degradation are active, the concept of vulnerability of forest cover is a fundamental concept for prioritizing sustainable forest and landscape management and reduce degradation risks.
Originally formalized for climate change and the agricultural sector by the Intergovernmental Panel on Climate Change (IPCC), the vulnerability framework makes it possible to assess the key determinants of system responses to external stress and pressures (Marshall et al. 2010; Parker et al. 2019). Vulnerability assessments provide guidance on how to target interventions and to support decision making processes (Adger 2006). Adapted from the IPCC definition, vulnerability is the degree to which a forest ecosystem is susceptible to, or unable to cope with, adverse effects of human-triggered impacts such as land use and land cover change and forest degradation (McCarthy 2001). Vulnerability is commonly defined as the combination of three main components where exposure relates to the magnitude of stress undergone by a system (exogenous processes) ; sensitivity refers to the degree to which the stress may affect the system, and the adaptive capacity is the system’s ability to respond to the stress (endogenous processes)(McCarthy 2001). This definition is widely used in the literature to
35
describe human-environment interactions and the resulting pressure and response options in the framework of socio-ecological systems (Thiault et al. 2018; Morel et al. 2019)(Fig 1.8).
Figure 1.8 Conceptual framework of forest ecological vulnerability as the combination of exposure
(exogenous), sensitivity and adaptive capacity (endogenous), modified from Gallopín (2006) and Thiault et al. (2018). Vulnerability assessment has a direct link with decision-making and management to reduce exposure risks and enhance adaptive capacity.
36
1.3 Litterature review of forest degradation and landscape
approach towards the assessment of forest ecological
vulnerability
1.3.1 Characterizing structures resulting from forest degradation
using remote sensing
In human-dominated landscapes such as old deforestation fronts, the distinction between forested and deforested lands traditionally used to map the state of the forest does not reflect the reality of the situation. A whole gradient exists for these forests, spanning from well conserved to severely degraded. Due to the complexity of the forest degradation concept, a wide range of remote sensing methods exist in the literature and can be generally grouped into two main approaches: direct and indirect (Herold et al. 2011). These methods vary in terms of remote sensing sources (satellite and airborne optical, Synthetic Aperture Radar (SAR), Light Detection And Ranging (LiDAR) or fusion), timescales (punctual to long time-series) and spatial coverage (local to pantropical)(Frolking et al. 2009; Herold et al. 2011; Hirschmugl et al. 2017; Mitchell et al. 2017)(Fig 1.9).
Figure 1.9 Direct and indirect approaches to characterize forest degradation/degraded forest using
37
Indirect approach
Indirect approaches focus on the spatial distribution and evolution of human infrastructure and on the identification of forest disturbances along time. They are usually used as proxies for assessing potentially degraded forest areas. Indirect methods are thus useful for large area mapping and may serve as a guide to identify hotspots of degradation.
Proximity metrics such as distance to roads, agricultural activity or infrastructure but also size and connectivity of forest patches are used for delineating hinterland forests and map intact forest landscapes (Tyukavina et al. 2016; Potapov et al. 2017; Tyukavina et al. 2017). Fragmentation of forest habitat could also be a proxy of degradation (Broadbent et al. 2008). For instance, Shapiro et al. (2016) demonstrated that forest biomass was significantly different within different fragmentation classes constructed on the basis of forest habitat morphological parameters (geometry and connectivity). The detection of logging roads, skid trails and log decks using moderate resolution optical and SAR provide proxy indicators of selective logging activity (Asner et al. 2002; Lei et al. 2018; Hethcoat et al. 2019). For instance, Bourbier et al. (2013) developped semi-automatic algorithm to extract road network and canopy gaps using Landsat imagery.
The detection of fire using MODIS Fire product (Justice et al. 2002; Giglio 2015) allows near-real time monitoring of forest and land fires but the coarse resolution of the data and the relatively high uncertainty of detection may be limiting. Other methods decided to focus on mapping the resulting burned vegetation and develop indicators of forest fire scars using Landsat images (Silva et al. 2018) or using multisource remote sensing such as Sentinel-1/2 (Verhegghen et al. 2016) or Landsat/Sentinel-2 (Roy et al. 2019).
Direct approach
Direct approaches focus on assessing the damage of forest canopy and forest structure generated by human-made disturbances. To capture these subtle changes, the use of common vegetation indices such as the NDVI (Normalized Difference Vegetation Index) from optical data is not sufficient due to saturation effects in forests with abundant undergrowth (Gond et al. 2013). In addition, degradation is a phenomenon only visible at a very fine scale and therefore cannot be detected correctly if the spatial resolution of the data is too coarse.
At the sub-pixel scale, degraded forests are mixed fractions of photosynthetic vegetation, non-photosynthetic vegetation, and bare soil. Spectral unmixing analysis (SMA) distinguishs these three