MODELS:
a critical perspective
EVALUATION AND
DECISION MODELS:
a critical perspective
Denis Bouyssou
ESSEC
Thierry Marchant
Ghent University
Marc Pirlot
SMRO, Facult´
e Polytechnique de Mons
Patrice Perny
LIP6, Universit´
e Paris VI
Alexis Tsouki`
as
LAMSADE - CNRS, Universit´
e Paris Dauphine
Philippe Vincke
SMG - ISRO, Universit´
e Libre de Bruxelles
KLUWER ACADEMIC PUBLISHERS
Boston/London/Dordrecht
1 Introduction 1 2 Choosing on the basis of several opinions 3 3 Building and aggregating evaluations 5
3.1 Introduction . . . 5
3.1.1 Motivation . . . 5
3.1.2 Evaluating students in Universities . . . 6
3.2 Grading students in a given course . . . 7
3.2.1 What is a grade? . . . 7
3.2.2 The grading process . . . 7
3.2.3 Interpreting grades . . . 13
3.2.4 Why use grades? . . . 16
3.3 Aggregating grades . . . 17
3.3.1 Rules for aggregating grades . . . 17
3.3.2 Aggregating grades using a weighted average . . . 18
3.4 Conclusions . . . 27
4 Constructing measures 29
5 Assessing competing projects 31 6 Comparing on several attributes 33
7 Deciding automatically 35
8 Dealing with uncertainty 37
9 Supporting decisions 39 10 Conclusion 41 Bibliography 43 Author Index 45 Index 45 Index 46 v
1
INTRODUCTION
2
CHOOSING ON THE BASIS OF
SEVERAL OPINIONS: THE
EXAMPLE OF VOTING
3
BUILDING AND AGGREGATING
EVALUATIONS: THE EXAMPLE OF
GRADING STUDENTS
3.1
Introduction
3.1.1
Motivation
In chapter 2, we tried to show that “voting”, although being a familiar activity to almost everyone, raises many important and difficult questions that are closely connected to the subject of this book. Our main objective in this chapter is similar. We all share the – more or less pleasant – experience of having received “grades” in order to evaluate our academic performances. The authors of this book spend part of their time evaluating the performance of students through grading several kinds of work, an activity that you may also be familiar with. The purpose of this chapter is to build upon this shared experience. This will allow us to discuss, based on simple and familiar situations, what is meant by “evaluating a performance” and “aggregating evaluations”, both activities being central to most evaluation and decision models. Although the entire chapter is based on the example of grading students, it should be stressed that “grades” are often used in contexts unrelated to the evaluation of the performance of students: employees are often graded by their employers, products are routinely tested and graded by consumer organisations, experts are used to rate the feasibility or the riskiness of projects, etc. The findings of this chapter are therefore not limited to the realm of a classroom.
As with voting systems, there is much variance across countries in the way “education” is organised. Curricula, grading scales, rules for aggregating grades and granting degrees, are seldom similar from place to place (for information on the systems used in the European Union see www.eurydice.org).
This diversity is even increased by the fact that each “instructor” (a word that we shall use to mean the person in charge of evaluating students) has generally developed his own policy and habits. The authors of this book have studied in four different European countries (Belgium, France, Greece and Italy) and obtained degrees in different disciplines (Maths, Operational Research, Computer Science, Geology, Management, Physics) and in different Universities. We were not overly astonished to discover that the rules that governed the way our performances were assessed were quite different. We were perhaps more surprised to realise that
although we all teach similar courses in comparable institutions, our “grading policies” were quite different even after having accounted for the fact that these policies are partly contingent upon the rules governing our respective institutions. Such diversity might indicate that evaluating students is an activity that is perhaps more complex than it appears at first sight.
3.1.2
Evaluating students in Universities
We shall restrict our attention in this chapter to education programmes with which we are familiar. Our general framework will be that of a programme at University level in which students have to take a number of “courses” or “credits”. In each course the performance of students is graded. These grades are then collected and form the basis of a decision to be taken about each student. Depending on the programme, this decision may take various forms, e.g. success or failure, success or failure with possible additional information such as distinctions, ranks or average grades, success or failure with the possibility of a differed decision (e.g. the degree is not granted immediately but there is still a possibility of obtaining it). Quite often the various grades are “summarised”, “amalgamated”, we shall say “aggregated”, in some way before a decision is taken.
In what follows, we shall implicitly have in mind the type of programmes in which we teach (Mathematics, Computer Science, Operational Research, Engi-neering) that are centred around disciplines which, at least at first sight, seem to raise less “evaluation problems” than if we were concerned with, say, Philosophy, Music or Sports.
Dealing only with “technically-oriented” programmes at University level will clearly not allow us to cover the immense literature that has been developed in Education Science on the evaluation of the performance of students. For good accounts in English, we refer to Airaisian (1991), Davis (1993), Lindheim, Morris and Fitz-Gibbon (1987), McLean and Lockwood (1996), Moom (1997) and Speck (1998). Note that in Continental Europe, the Piagetian influence, different institu-tional constraints and the popularity of the classic book by Pi´eron (1963) have led to a somewhat different school of thought, see Bonboir (1972), Cardinet (1986), de Ketele (1982), de Landsheere (1980), Merle (1996) and Noizet and Caverini (1978). As we shall see, this will however allow us to raise several important is-sues concerning the evaluation and the aggregation of performances. Two types of questions prove to be central for our purposes:
• how to evaluate the performance of students in a given “course”, what is the meaning of the resulting “grades” and how to interpret them?
• how to combine the various grades obtained by a student in order to arrive at an overall evaluation of his academic performance?
3.2
Grading students in a given course
Most of you have probably been in the situation of an “instructor” having to attribute grades to students. Although this is clearly a very important task, many instructors share the view that this is far from being the easiest and most pleasant part of their jobs. We shall try here to give some hints on the process that leads to the attribution of a grade as well as on some of its pitfalls and difficulties.
3.2.1
What is a grade?
We shall understand a grade as an evaluation of the performance of a student in a given course, i.e. an indication of the level to which a student has fulfilled the objectives of the course.
This very general definition calls for some remarks.
1. A grade should always be interpreted in connection with the objectives of a course. Although it may appear obvious, this implies a precise statement of the objectives of the course in the syllabus, a condition that is unfortunately not always perfectly met.
2. All grades do not have a similar function. Whereas usually the final grade of a course in Universities mainly has a “certification” role, intermediate grades, on which the final grade may be partly based, have a more complex role that is often both “certificative” and “formative”, e.g. the result of a mid-term exam is included in the final grade but is also meant to be a signal to a student indicating his strengths and weaknesses.
3. Although this is less obvious in Universities than in elementary schools, it should be noticed that grades are not only a signal sent by the instructor to each of his students. They have many other potential important “users”: other students using them to evaluate their position in the class, other in-structors judging your severity and/or performance, parents watching over their child, administrations evaluating the performance of programmes, em-ployers looking for all possible information on an applicant for a job. Thus, it appears that a grade is therefore a complex “object” with multi-ple functions (see Chatel 1994, Laska and Juarez 1992, Lysne 1984, McLean and Lockwood 1996). Interpreting it necessarily calls for a study of the process that leads to its attribution.
3.2.2
The grading process
What is graded and how?
The types of work that are graded, the scale used for grading and the way of amal-gamating these grades may vary in significant ways for similar types or courses.
1. The scale that is used for grading students is usually imposed by the pro-gramme. Numerical scales are often used in Continental Europe with varying bounds and orientations: 0-20 (in France or Belgium), 0-30 (in Italy), 6-1 (in Germany and parts of Switzerland), 0-100 (in some Universities). American and Asian institutions often use a letter scale, e.g. E to A or F to A. Obvi-ously we would not want to conclude from this that Italian instructors have come to develop much more sensitive instruments for evaluating performance than German ones or that the evaluation process is in general more “precise” in Europe than it is in the USA. Most of us would agree that the choice of a particular scale is mainly conventional. It should however be noted that since grades are often aggregated at some point, such choices might not be totally without consequences. We shall come back to that point in section 3.3.
2. Some courses are evaluated on the basis of a single exam. But there are many possible types of exams. They may be written or oral; they may be open-book or closed-book. Their duration may vary (45 minute exams are not uncommon in some countries whereas they may last up to 8 hours in some French programmes). Their content for similar courses may vary from multiple choice questions to exercises, case-studies or essays.
3. In most courses the final grade is based on grades attributed to multiple tests. The number and type of work may vary a lot: final exam, mid-term exam, exercises, case-studies or even “class participation”. Furthermore the way these various grades are aggregated is diverse: simple weighted average, grade only based on exams with group work (e.g. case-studies or exercises) counting as a bonus, imposition of a minimal grade at the final exam, etc. (an overview of grading policies and practices in the USA can be found in Riley, Checca, Singer and Worthington 1994).
4. Some instructors use “raw” grades. For reasons to be explained later, others modify the “raw” grades in some way before aggregating and/or releasing them, e.g. standardising them.
Preparing and grading a written exam
Within a given institution suppose that you have to prepare and grade a written, closed-book, exam. We shall take the example of an exam for an “Introduction to Operational Research (OR)” course, including Linear Programming (LP), Integer Programming and Network models, with the aim of giving students a basic un-derstanding of the modelling process in OR and an elementary mastering of some basic techniques (Simplex Algorithm, Branch and Bound, elementary Network Algorithms). Many different choices interfere with such a task.
1. Preparing a subject. All instructors know that preparing the subject of an
exam is a difficult and time consuming task. Is the subject of adequate diffi-culty? Does it contain enough questions to cover all parts of the programme?
Do all the questions clearly relate to one or several of the announced objec-tives of the course? Will it allow to discriminate between students? Is there a good balance between modelling and computational skills? What should the respective parts of closed vs. open questions be?
2. Preparing a marking scale. The preparation of the marking scale for a given
subject is also of utmost importance. A “nice-looking” subject might be impractical in view of the associated marking scale. Will the marking scale include a bonus for work showing good communication skills and/or will misspellings be penalised? How to deal with computational errors? How to deal with computational errors that lead to inconsistent results? How to deal with computational errors influencing the answers to several questions? How to judge an LP model in which the decision variables are incompletely defined? How to judge a model that is only partially correct? How to judge a model which is inconsistent from the point of view of units? Although much expertise and/or “rules of thumb” are involved in the preparation of a good subject and its associated marking scale, we are aware of no instructor not having had to revise his judgement after correcting some work and realising his severity and/or to correct work again after discovering some frequently given half-correct answers that were unanticipated in the marking scale.
3. Grading. A grade evaluates the performance of a student in completing
the tasks implied by the subject of the exam and, hopefully, will give an indication of the extent to which a student has met the various objectives of the course (in general an exam is far from dealing with all the aspects that have been dealt with during the course). Although this is debatable, such an evaluation is often thought of as a “measure” of performance. For this kind of “measure” the psychometric literature (see Ebel and Frisbie 1991, Kerlinger 1986, Popham 1981), has traditionally developed at least two desirable criteria. A measure should be:
• reliable, i.e. give similar results when applied several times in similar
conditions,
• valid, i.e. should measure what was intended to be measured and only
that.
Extensive research in Education Science has found that the process of giving grades to students is seldom perfect in these respects (a basic reference re-mains the classic book of Pi´eron (1963). Airaisian (1991) and Merle (1996) are good surveys of recent findings). We briefly recall here some of the difficulties that were uncovered.
The crudest reliability test that can be envisaged is to give similar works to correct to several instructors and to record whether or not these works are graded similarly. Such experiments were conducted extensively in various disciplines and at various levels. Not overly surprisingly, most experiments have shown that even in the more “technical” disciplines (Maths, Physics, Grammar) in which it is possible to devise rather detailed marking scales
there is much difference between correctors. On average the difference be-tween the more generous and the more severe correctors on Maths work can be as high as 2 points on a 0-20 scale. Even more strikingly on some work in Maths the difference can be as high as 9 points on a 0-20 scale (see Pi´eron 1963).
In other experiments the same correctors are asked to correct a work that they have already corrected earlier. These auto-reliability tests give similar results since in more than 50% of the cases the second grade is “significantly” different from the first one. Although few experiments have been conducted with oral exams, it seems fair to suppose that they are no more reliable than written ones.
Other experiments have shown that many extraneous factors may interfere in the process of grading a paper and therefore question the validity of grades. Instructors accustomed to grading papers will not be surprised to note that:
• grades usually show much auto correlation: similar papers handed in by a usually “good” student and by a usually “uninterested” student are likely not to receive similar grades,
• the order in which papers are corrected greatly influences the grades. Near the end of a correction task, most correctors are less generous and tend to give grades with a higher variance.
• “anchoring effects” are pervasive: it is always better to be corrected after a remarkably poor work than after a perfect one.
• misspellings and poor hand-writing prove to have a non negligible influ-ence on the grades even when the instructor declares not to take these effects into account or is instructed not to.
4. The influence of correction habits. Experience shows that “correction habits”
tend to vary from one instructor to another. Some of them will tend to give an equal percentage of all grades and will tend to use the whole range of the scale. Some will systematically avoid the extremes of the range and the dis-tribution of their marks will have little variability. Others will tend to give only extreme marks e.g. arguing that either the basic concepts are under-stood or they are not. Some are used to giving the lowest possible grade after having spotted a mistake which, in their minds, implies that “nothing has been understood” (e.g. proposing a “non linear LP model”). The distribu-tion of grades for similar papers will tend to be highly different according to the corrector. In order to cope with such effects, some instructors will tend to standardise the grades before releasing them (the so-called “z-scores”), others will tend to equalise average grades from term to term and/or use a more or less ad hoc procedure.
Defining a grading policy
A syllabus usually contains a section entitled “grading policy”. Although instruc-tors do not generally consider it as the most important part of their syllabus, they
are aware that it is probably the part that is read first and most attentively by all students. Besides useful considerations on “ethics”, this section usually describes the process that will lead to the attribution of the grades for the course in detail. On top of describing the type of work that will be graded, the nature of exams and the way the various grades will contribute to the determination of the final grade, it usually also contains many “details” that may prove important in order to understand and interpret grades. Among these “details”, let us mention:
• the type of preparation and correction of the exams: who will prepare the subject of the exam (the instructor or an outside evaluator)? Will the work be corrected once or more than once (in some Universities all exams are corrected twice)? Will the names of the students be kept secret?
• the possibility of revising a grade: are there formal procedures allowing the students to have their grades reconsidered? Do the students have the possibility of asking for an additional correction? Do the students have the possibility of taking the same course at several moments in the academic year? What are the rules for students who cannot take the exam (e.g. because they are sick)?
• the policy towards cheating and other dishonest behaviour (exclusion from the programme, attribution of the lowest possible grade for the course, at-tribution of the lowest possible grade for the exam).
• the policy towards late assignments (no late assignment will be graded, minus
x points per hour or day).
Determining final grades
The process of the determination of the final grades for a given course can hardly be understood without a clear knowledge of the requirements of the programme in order to obtain the degree. In some programmes students are only required to obtain a “satisfactory grade” (it may or not correspond to the “middle” of the grading scale that is used) for all courses. In others, an “average grade” is computed and this average grade must be over a given limit to obtain the degree. Some programmes attribute different kinds of degrees through the use of “distinctions”. Some courses (e.g. “core courses”) are sometimes treated apart; a “dissertation” may have to be completed.
The freedom of an instructor in arranging his own grading policy is highly conditioned by this environment. A grade can hardly be interpreted without a clear knowledge of these rules (note that this sometimes creates serious problems in institutions allowing students pertaining to different programmes with different sets of rules to attend the same courses). Within a well defined set of rules, however, many degrees of freedom remain. We examine some of them below. Weights We mentioned that the final grade for a course was often the combina-tion of several grades obtained throughout the course: mid-term exam, final exam, case-studies, dissertation, etc. The usual way to proceed is to give a (numerical)
weight to each of the work entering into the final grade and to compute a weighted average, more important works receiving higher weights. Although this process is simple and almost universally used, it raises some difficulties that we shall examine in section 3.3. Let us simply mention here that the interpretation of “weights” in such a formula is not obvious. Most instructors would tend to compensate for a very difficult mid term exam (weight 30%) preparing a comparatively easier final exam (weight 70%). However, if the final exam is so easy that most students obtain very good grades, the differences in the final grades will be attributable almost exclusively to the mid term exam although it has a much lower weight than the final exam. The same is true if the final grade combines an exam with a dissertation. Since the variance of the grades is likely to be much lower for the dissertation than for the exam, the former may only marginally contribute towards explaining differences in final grades independently of the weighting scheme. In order to avoid such difficulties, some instructors standardise grades before averag-ing them. Although this might be desirable in some situations, it is clear that the more or less arbitrary choice of a particular measure of dispersion (why use the standard deviation and not the inter quartile range? should we exclude outliers?) may have a crucial influence on the final grades. Furthermore, the manipulation of such “distorted grades” seriously complicates the positioning of students with respect to a “minimal passing grade” since their use amounts to abandoning any idea of “absolute” evaluation in the grades.
Passing a course In some institutions, you may either “pass” or “fail” a course and the grades obtained in several courses are not averaged. An essential problem for the instructor is then to determine which students are above the “minimal passing grade”. When the final grade is based on a single exam we have seen that it is not easy to build a marking scale. It is even more difficult to conceive a marking scale in connection to what is usually the minimal passing grade according to the culture of the institution. The question boils down to deciding what amount of the programme should a student master in order to obtain a passing grade, given that an exam only gives partial information about the amount of knowledge of the student.
The problem is clearly even more difficult when the final grade results from the aggregation of several grades. The use of weighted averages may give undesirable results since, for example, an excellent group case-study may compensate for a very poor exam. Similarly weighted averages do not take the progression of the student during the course into account.
It should be noted that the problem of positioning students with respect to a minimal passing grade is more or less identical to positioning them with respect to any other “special grades”, e.g. the minimal grade for being able to obtain a “distinction”, to be cited on the “Dean’s honour list” or the “Academic Honour Roll”.
3.2.3
Interpreting grades
Grades from other institutions
In view of the complexity of the process that leads to the attribution of a grade, it should not be a surprise that most instructors find it very difficult to interpret grades obtained in another institution. Consider a student joining your programme after having obtained a first degree at another University. Arguing that he has already passed a course in OR with 14 on a 0-20 scale, he wants to have the opportunity to be dispensed from your class. Not aware of the grading policy of the instructor and of the culture and rules of the previous University this student attended, knowing that he obtained 14 offers you little information. The knowledge of his rank in the class may be more useful: if he obtained one of the highest grades this may be a good indication that he has mastered the contents of the course sufficiently. However, if you were to know that the lowest grade was 13 and that 14 is the highest, you would perhaps be tempted to conclude that the difference between 13 and 14 may not be very significant and/or that you should not trust grades that are so generous and exhibit so little variability.
Grades from colleagues
Being able to interpret the grade that a student obtained in your own institution is quite important at least as soon as some averaging of the grades is performed in order to decide on the attribution of a degree. This task is clearly easier than the preceding one: the grades that are to be interpreted here have been obtained in a similar environment. However, we would like to argue that this task is not an easy one either. First it should be observed that there is no clear implication in having obtained a similar grade in two different courses. Is it possible or meaningful to assert that a student is “equally good” in Maths and in Literature? Is it possible to assert that, given the level of the programme, he has satisfied to a greater extent the objectives of the Maths course than the objectives of the Literature course? Our experience as instructors would lead us to answer negatively to such questions even when talking of programmes in which all objectives are very clearly stated. Secondly, in section 3.2.2 we mentioned that, even within fixed institutional constraints, each instructor still had many degrees of freedom to choose his grading policy. Unless there is a lot of co-ordination between colleagues they may apply quite different rules e.g. in dealing with late assignments or in the nature and number of exams. This seriously complicates the interpretation of the profile of grades obtained by a student.
Interpreting your own grades
The numerical scales used for grades throughout Europe tend to give the impres-sion that grades are “real measures” and that, consequently these numbers may be manipulated as any other numbers. There are many possible kinds of “mea-sure” and having a numerical scale is no guarantee that the numbers on that scale may be manipulated in all possible ways. In fact, before manipulating numbers supposedly resulting from “measurements” it is always important to try to figure
out on which type of scales they have been “measured”. Let us notice that this is true even in Physics. Saying that Mr. X weighs twice as much as Mr. Y “makes sense” because this assertion is true whether mass is measured in pounds or in kilograms. Saying that the average temperature in city A is twice as high as the average temperature in city B may be true but makes little sense since the truth value of this assertion clearly depends on whether temperature is measured using the Celsius or the Fahrenheit scale.
The highest point on the scale An important feature of all grading scales is that they are bounded above. It should be clear that the numerical value attributed to the highest point on the scale is somewhat arbitrary and conventional. No loss of information would be incurred using a 0-100 or a 0-10 scale instead of a 0-20 one. At best it seems that grades should be considered as expressed on a ratio scale, i.e. a scale in which the unit of measurement is arbitrary (such scales are frequent in Physics, e.g. length can be measured in meters or inches without loss of information).
If grades can be considered as measured on a ratio scale, it should be recognised that this ratio scale is somewhat awkward because it is bounded above. Unless you admit that knowledge is bounded or, more realistically, that “perfectly fulfilling the objectives of a course” makes clear sense, problems might appear at the upper bound of the scale. Consider two excellent, but not necessarily “equally excellent”, students. They cannot obtain more than the perfect grade 20/20. Equality of grades at the top of the scale (or near the top, depending on grading habits) does not necessarily imply equality in performance (after a marking scale is devised it is not exceptional that we would like to give some students more than the maximal grade, i.e. because some bonus is added for particularly clever answers, whereas the computer system of most Universities would definitely reject such grades !). The lowest point on the scale It should be clear that the numerical value that is attributed to the lowest point of the scale is no less arbitrary and conventional than was the case for the highest point. There is nothing easier than to transform grades expressed on a 0-20 scale to grades expressed on a 100-120 scale and this involves no loss of information. Hence it would seem that a 0-20 scale might be better viewed as an interval scale, i.e. a scale in which both the origin and the unit of measurement are arbitrary (think of temperature scale in Celsius or Fahrenheit). An interval scale allows comparisons of “differences in performance”; it makes sense to assert that the difference between 0 and 10 is similar to the difference between 10 and 20 or that the difference between 8 and 10 is twice as large as the difference between 10 and 11, since changing the unit and origin of measurement clearly preserves such comparisons.
Let us notice that using a scale that is bounded below is also problematic. In some institutions the lowest grade is reserved for students who did not take the exam. Clearly this does not imply that these students are “equally ignorant”. Even when the lowest grade can be obtained by students having taken the exam, some ambiguity remains. “Knowing nothing”, i.e. having completely failed to meet any of the objectives of the course, is difficult to define and is certainly contingent
upon the level of the course (this is all the more true that in many institutions the lowest grade is also granted to students having cheated during the exam, with obviously no guarantee that they are “equally ignorant”). To a large extent “knowing nothing” — in the context of a course — is somewhat as arbitrary as is “knowing everything”. Therefore, if grades are expressed on interval scales, care should be taken when manipulating grades close to the bounds of the scale. In between We already mentioned that on an interval scale, it makes sense to compare differences in grades. The authors of this book (even if their students should know that they spend a lot of time and energy in grading them !) do not consider that their own grades always allow for such comparisons. First we already mentioned that a lot of care should be taken in manipulating grades that are “close” to the bounds. Second, in between these bounds, some grades are very particular in the sense that they play a particular role in the attribution of the degree. Let us consider a programme in which all grades must be above a minimal passing grade, say, 10 on a 0-20 scale, in order to obtain the degree. If it is clear that an exam is well below the passing grade, few instructors will claim that there is a highly significant difference between 4/20 and 5/20. Although the latter exam seems slightly better than the former, the essential idea is that they are both well below the minimal passing grade. On the contrary the gap between 9/20 and 10/20 may be much more important since before putting a grade just below the passing grade most instructors usually make sure that they will have good arguments in case of a dispute (some systematically avoid using grades just below the minimal passing grade). In some programmes, not only the minimal passing grade has a special role: some grades may correspond to different possible levels of distinction, other may correspond to a minimal acceptable level below which there is no possibility of compensation with grades obtained in other courses. In between these “special grades” it seems that the reliable information conveyed by grades is mainly ordinal. Some authors have been quite radical in emphasising this point, e.g. Cross (1995) stating that: “[...] we contend that the difficulty of nearly all academic tests is arbitrary and regardless of the scoring method, they provide nothing more than ranking information” (but see French 1993, Vassiloglou and French 1982). At first sight this would seem to be a strong argument in favour of the letter system at use in most American Universities that only distinguishes between a limited classes of grades (usually from F or E to A with, in some institutions, the possibility of adding “+” or “–” to the letters). However, since these letter grades are usually obtained via the manipulation of a distribution of numerical grades of some sort, the distinction between letter grades and numerical grades is not as deep as it appears at first sight. Furthermore the aggregation of letter grades is often done via a numerical transformation as we shall see in section 3.3.
Finally it should be observed that, in view of the lack of reliability and validity of some aspects of the grading process, it might well be possible to assert that small differences in grades that do not cross any special grades may not be significant at all. A difference of 1 point on a 0-20 scale may well be due only to chance via the position of the work, the quality of the preceding papers, the time of correction.
Once more grades appear as complex objects. While they seem to mainly convey ordinal information (with the possibility of the existence of non significant small differences) that is typical of a relative evaluation model, the existence of special grades complicates the situation in introducing some “absolute” elements of evaluation in the model (on the measurement-theoretic interpretation of grades see French 1981, Vassiloglou 1984).
3.2.4
Why use grades?
Some readers, and most notably instructors, may have the impression that we have been overly pessimistic on the quality of the grading process. We would like to mention that the literature in Education Science is even more pessimistic leading some authors to question the very necessity of using grades (see Sager 1994, Tchudi 1997). We suggest to sceptical instructors the following simple experiment. Having prepared an exam, ask some of your colleagues to take it with the following instructions: prepare what you would think to be an exam that would just be acceptable for passing, prepare an exam that would clearly deserve distinction, prepare an exam that is well below the passing grade. Then apply your marking scale to these papers prepared by your colleagues. It would be extremely likely that the resulting grades show some surprises!
However, none of us would be prepared to abandon grades, at least for the type of programmes in which we teach. The difficulties that we mentioned would be quite problematic if grades were considered as “measures” of performance that we would tend to make more and more “precise” and “objective”. We tend to consider grades as an “evaluation model” trying to capture aspects of something that is subject to considerable indetermination, the “performance of students”.
As is the case with most evaluation models, their use greatly contributes to transforming the “reality” that we would like to “measure”. Students cannot be expected to react passively to a grading policy; they will undoubtedly adapt their work and learning practice to what they perceive to be its severity and consequences. Instructors are likely to use a grading policy that will depend on their perception of the policy of the Faculty (on these points, see Sabot and Wakeman 1991, Stratton, Myers and King 1994). The resulting “scale of measure-ment” is unsurprisingly awkward. Furthermore, as with most evaluation models of this type, aggregating these evaluations will raise even more problems.
This not to say that grades cannot be a useful evaluation model. If these lines have lead some students to consider that grades are useless, we suggest they try to build up an evaluation model that would not use grades without, of course, relying too much on arbitrary judgements. This might not be an impossible task; we, however, do not find it very easy.
3.3
Aggregating grades
3.3.1
Rules for aggregating grades
In the previous section, we hope to have convinced the reader that grading a student in a given course is a difficult task and that the result of this process is a complex object.
Unfortunately, this is only part of the evaluation process of students enrolled in a given programme. Once they have received a grade in each course, a decision still has to be made about each student. Depending on the programme, we already mentioned that this decision may take different forms: success or failure, success or failure with possible additional information e.g. distinctions, ranks or average grades, success or failure with the additional possibility of partial success (the degree is not granted immediately but there remains a possibility of obtaining it), etc. Such decisions are usually based on the final grades that have been obtained in each course but may well use some other information, e.g. verbal comments from instructors or extra-academic information linked to the situation of each student. What is required from the students to obtain a degree is generally described in a lengthy and generally opaque set of rules that few instructors—but generally all students—know perfectly (as an interesting exercise we might suggest that you investigate whether you are perfectly aware of the rules that are used in the programmes in which you teach or, if you do not teach, whether you are aware of such rules for the programmes in which your children are enrolled). These rules exhibit such variety that it is obviously impossible to exhaustively examine them here. However, it appears that they are often based on three kinds of principles (see French 1981).
Conjunctive rules
In programmes of this type, students must pass all courses, i.e. obtain a grade above a “minimal passing grade” in all courses in order to obtain the degree. If they fail to do so after a given period of time, they do not obtain the degree. This very simple rule has the immense advantage of avoiding any amalgamation of grades. It is however seldom used as such because:
• it is likely to generate high failure rates,
• it does not allow to discriminate between grades just below the passing grade and grades well below it,
• it offers no incentive to obtain grades well above the minimal passing grade,
• it does not allow to discriminate (e.g. using several kinds of distinctions) between students obtaining the degree.
Most instructors and students generally violently oppose such simple systems since they generate high failure rates and do not promote “academic excellence”.
Weighted averages
In many programmes, the grades of students are aggregated using a simple weighted average. This average grade (the so-called “GPA” in American Universities) is then compared to some standards e.g. the minimal average grade for obtaining the de-gree, the minimal average grade for obtaining the degree with a distinction, the minimal average grade for being allowed to stay in the programme, etc. Whereas conjunctive rules do not allow for any kind of compensation between the grades obtained for several courses, all sorts of compensation effects are at work with a weighted average.
Minimal acceptable grades
In order to limit the scope of compensation effects allowed by the use of weighted averages, some programmes include rules involving “minimal acceptable grades” in each course. In such programmes, the final decision is taken on the basis of an average grade provided that all grades entering this average are above some minimal level.
The rules that are used in the programmes we are aware of often involve a mixture of these three principles, e.g. an average grade is computed for each “cat-egory” of courses provided that the grade of each course is above a minimal level and such average grades per category of courses are then used in a conjunctive fashion. Furthermore, it should be noticed that the final decision concerning a student is very often taken by a committee that has some degree of freedom with respect to the rules and may, for instance, grant the degree to someone who does not meet all the requirements of the programme e.g. because of serious personal problems.
All these rules are based on “grades” and we saw in section 3.2 that the very nature of the grades was highly influenced by these rules. This amounts to aggre-gating evaluations that are highly influenced by the aggregation rule. This makes aggregation an uneasy task. We study some aspects of the most common aggre-gation rule for grades below: the weighted average (more examples and comments will be found in chapters 4 and 6).
3.3.2
Aggregating grades using a weighted average
The purpose of rules for aggregating grades is to know whether the overall per-formance of a student is satisfactory taking his various final grades into account. Using a weighted average system amounts to assessing the performance of a stu-dent combining his grades using a simple weighting scheme. We shall suppose that all final grades are expressed on similar scales and note gi(a) the final grade for course i obtained by student a. The average grade obtained by student a is then computed as g(a) = Pni=1wigi(a), the (positive) weights wi reflecting the “im-portance” (in “academic” terms and/or in function of the length of the course) of the course for the degree. The weights wi may, without loss of generality, be normalised in such a way that Pni=1wi = 1. Using such a convention the aver-age grade g(a) will be expressed on a scale having the same bounds as the scale
used for the gi(a). The simplest decision rule consists in comparing g(a) with some standards in order to decide on the attribution of the degree and on possible distinctions. A number of examples will allow us to understand the meaning of this rule better and to emphasise its strengths and weaknesses (we shall suppose throughout this section that students have all been evaluated on the same courses; for the problems that arise when this is not so, see Vassiloglou (1984)).
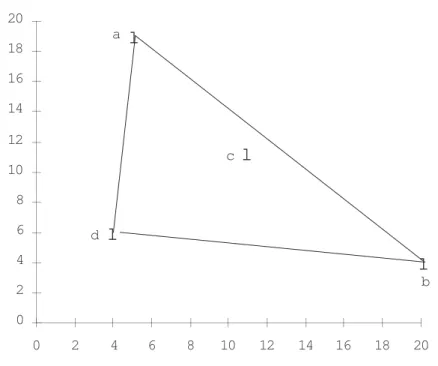
Example 1
Consider four students enrolled in a degree consisting of two courses. For each course, a final grade between 0 and 20 is allocated. The results are as follows:
g1 g2
a 5 19
b 20 4
c 11 11
d 4 6
Student c has performed reasonably well in all courses whereas d has a consis-tent very poor performance; both a and b are excellent in one course while having a serious problem in the other. Casual introspection suggests that if the students were to be ranked, c should certainly be ranked first and d should be ranked last. Students a and b should be ranked in between, their relative position depending on the relative importance of the two courses. Their very low performance in 50% of the courses does not make them good candidates for the degree. The use of simple weighted average of grades leads to very different results. Considering that both courses are of equal importance gives the following average grades:
average grades
a 12
b 12
c 11
d 5
which leads to having both a and b ranked before c. As shown in figure 3.1, we can say even more: there is no vector of weights (w, 1−w) that would rank c before both
a and b. Ranking c before a implies that 11w + 11(1 − w) > 5w + 19(1 − w) which
leads to w > 8
15. Ranking c before b implies 11w + 11(1 − w) > 20w + 4(1 − w), i.e.
w < 7
16(figure 3.1 should make clear that there is no loss of generality in supposing
that weights sum to 1). The use of a simple weighted sum is therefore not in line with the idea of promoting students performing reasonably well in all courses. The exclusive reliance on a weighted average might therefore be an incentive for students to concentrate their efforts on a limited number of courses and benefit
0 2 4 6 8 10 12 14 16 18 20 0 2 4 6 8 10 12 14 16 18 20 a b c d
l
l
l
l
Figure 3.1: Use of a weighted sum for aggregating grades
from the compensation effects at work with such a rule. This is a consequence of the additivity hypothesis embodied in the use of weighted averages.
It should finally be noticed that the addition of a “minimal acceptable grade” for all courses can decrease but not suppress (unless the minimal acceptable grade is so high that it turns the system in a nearly conjunctive one) the occurrence of such effects.
A related consequence of the additivity hypothesis is that it forbids to account for “interaction” between grades as shown in the following example.
Example 2
Consider four students enrolled in an undergraduate programme consisting in three courses: Physics, Maths and Economics. For each course, a final grade between 0 and 20 is allocated. The results are as follows:
Physics Maths Economics
a 18 12 6
b 18 7 11
c 5 17 8
d 5 12 13
On the basis of these evaluations, it is felt that a should be ranked before b. Al-though a has a low grade in Economics, he has reasonably good grades in both
Maths and Physics which makes him a good candidate for an Engineering pro-gramme; b is weak in Maths and it seems difficult to recommend him for any programme with a strong formal component (Engineering or Economics). Using a similar type of reasoning, d appears to be a fair candidate for a programme in Economics. Student c has two low grades and it seems difficult to recommend him for a programme in Engineering or in Economics. Therefore d is ranked before c. Although these preferences appear reasonable, they are not compatible with the use of a weighted average in order to aggregate the three grades. It is easy to observe that:
• ranking a before b implies putting more weight on Maths than on Economics (18w1+ 12w2+ 6w3> 18w1+ 7w2+ 11w3⇒ w2> w3),
• ranking d before c implies putting more weight on Economics than on Maths (5w1+ 17w2+ 8w3> 5w1+ 12w2+ 13w3⇒ w3> w2),
which is contradictory.
In this example it seems that “criteria interact”. Whereas Maths do not over-weigh any other course (see the ranking of d vis-`a-vis c), having good grades in both Math and Physics or in both Maths and Economics is better than having good grades in both Physics and Economics. Such interactions, although not unfrequent, cannot be dealt with using weighted averages; this is another conse-quence of the additivity hypothesis. Taking such interactions into account calls for the use of more complex aggregation models (see Grabisch 1996).
Example 3
Consider two students enrolled in a degree consisting of two courses. For each course a final grade between 0 and 20 is allocated; both courses have the same weight and the required minimal average grade for the degree is 10. The results are as follows:
g1 g2
a 11 10
b 12 9
It is clear that both students will receive an identical average grade of 10.5: the difference between 11 and 12 on the first course exactly compensates for the oppo-site difference on the second course. Both students will obtain the degree having performed equally well.
It is not unreasonable to suppose that since the minimal required average for the degree is 10, this grade will play the role of a “special grade” for the instructors, a grade above 10 indicating that a student has satisfactorily met the objectives of the course. If 10 is a “special grade” then, it might be reasonable to consider that the difference between 10 and 9 which crosses a special grade is much more significant than the difference between 12 and 11 (it might even be argued that the small difference between 12 and 11 is not significant at all). If this is the case, we
would have good grounds to question the fact that a and b are “equally good”. The
linearity hypothesis embodied in the use of weighted averages has the inevitable
consequence that a difference of one point has a similar meaning wherever on the scale and therefore does not allow for such considerations.
Example 4
Consider a programme similar to the one envisaged in the previous example. We have the following results for three students:
g1 g2
a 14 16
b 15 15
c 16 14
All students have an average grade of 15 and they will all receive the degree. Furthermore, if the degree comes with the indication of a rank or of an average grade, these three students will not be distinguished: their equal average grade makes them indifferent. This appears desirable since these three students have very similar profiles of grades.
The use of linearity and additivity implies that if a difference of one point on the first grade compensates for an opposite difference on the other grade, then a difference of x points on the first grade will compensate for an opposite difference of −x points on the other grade, whatever the value of x. However, if x is chosen to be large enough this may appear dubious since it could lead, for instance, to view the following three students as perfectly equivalent with an average grade of 15:
g1 g2
a0 10 20
b 15 15
c0 20 10
whereas we already argued that, in such a case, b could well be judged preferable to both a0and c0 even though b is indifferent to a and c. This is another consequence of the linearity hypothesis embodied in the use of weighted averages.
Example 5
Consider three students enrolled in a degree consisting of three courses. For each course a final grade between 0 and 20 is allocated. All courses have identical importance and the minimal passing grade is 10 on average. The results are as follows:
g1 g2 g3
a 12 5 13
b 13 12 5
c 5 13 12
It is clear that all students have an average equal to the minimal passing grade 10. They all end up tied and should all be awarded the degree.
As argued in section 3.2 it might not be unreasonable to consider that final grades are only recorded on an ordinal scale, i.e. only reflect the relative rank of the students in the class, with the possible exception of a few “special grades” such as the minimal passing grade. This means that the following table might as well reflect the results of these three students:
g1 g2 g3
a 11 4 12
b 13 13 6
c 4 14 11
since the ranking of students within each course has remained unchanged as well as the position of grades vis-`a-vis the minimal passing grade. In this case, only
b (say the Dean’s nephew) gets an average above 10 and both a and c fail (with
respective averages of 9 and 9.6). Note that using different transformations, we could have favoured any of the three students.
Not surprisingly, this example shows that a weighted average makes use of the “cardinal properties” of the grades. This is hardly compatible with grades that would only be indicators of “ranks” even with some added information (a view that is very compatible with the discussion in section 3.2). As shown by the following example, it does not seem that the use of “letter grades”, instead of numerical ones, helps much in this respect.
Example 6
In many American Universities the Grade Point Average (GPA), which is nothing more than a weighted average of grades, is crucial for the attribution of degrees and the selection of students. Since courses are evaluated on letter scales, the GPA is usually computed by associating a number to each letter grade. A common “conversion scheme” is the following:
A 4 (outstanding or excellent) B 3 (very good) C 2 (good) D 1 (satisfactory) E 0 (failure)
in which the difference between two consecutive letters is assumed to be equal. Such a practice raises several difficulties. First, letter grades for a given course are generally obtained on the basis of numerical grades of some sort. This implies using a first “conversion scheme” of numbers into letters. The choice of such a scheme is not obvious. Note that when there are no “holes” in the distribution of numerical grades it is possible that a very small (and possibly non significant) difference in numerical grades results in a significant difference in letter grades.
Secondly, the conversion scheme of letters into numbers used to compute the GPA is somewhat arbitrary. Allowing for the possibility of adding “+” or “–” to the letter grades generally results in a conversion schemes maintaining an equal difference between two consecutive letter grades. This can have a significant impact on the ranking of students on the basis of the GPA.
To show how this might happen suppose that all courses are first evaluated on a 0–100 scale (e.g. indicating the percentage of correct answers to a multiple choice questionnaire). These numbers are then converted into letter grades using a first conversion scheme. These letter grades are further transformed, using a second conversion scheme, into a numerical scale and the GPA is computed. Now consider three students evaluated on three courses on a 0-100 scale in the following way:
g1 g2 g3
a 90 69 70
b 79 79 89
c 100 70 69
Using an E to A letter scale, a common conversion scheme (that is used in many Universities) is A 90–100% B 80–89% C 70–79% D 60–69% E 0–59% This results in the following letter grades:
g1 g2 g3
a A D C
b C C B
c A C D
Supposing the three courses of equal importance and using the conversion scheme of letter grades into numbers given above, the calculation of the GPA is as follows:
g1 g2 g3 GPA
a 4 1 2 2.33
b 2 2 3 2.33
c 4 2 1 2.33
making the three students equivalent.
Now another common (and actually used) scale for converting percentages into letter grades is as follows:
A+ 98–100% A 94–97% A– 90–93% B+ 87–89% B 83–86%, B– 80–82% C+ 77–79%, C 73–76%, C– 70–72%, D 60–69%, F 0–59%
This scheme would result in the following letter grades:
g1 g2 g3
a A– D C–
b C+ C+ B+
c A+ C– D
Maintaining the usual hypothesis of a constant “difference” between two consecu-tive letter grades we obtain the following conversion scheme:
A+ 10 A 9 A– 8 B+ 7 B 6 B– 5 C+ 4 C 3 C– 2 D 1 F 0
which leads to the following GPA:
g1 g2 g3 GPA
a 8 1 2 3.66
b 4 4 7 5.00
c 10 2 1 4.33
In this case, b (again the Dean’s nephew) gets a clear advantage over a and c. It should be clear that standardisation of the original numerical grades before conversion offers no clear solution to the problem uncovered.
Example 7
We argued in section 3.2 that small differences in grades might not be significant at all provided they do not involve crossing any “special grade”. The explicit treatment of such imprecision is problematic using a weighted average; most often, it is simply ignored. Consider the following example in which three students are enrolled in a degree consisting of three courses. For each course a final grade between 0 and 20 is allocated. All courses have the same weight and the minimal passing grade is 10 on average. The results are as follows:
g1 g2 g3
a 13 12 11
b 11 13 12
c 14 10 12
All students will receive an average grade of 12 and will all be judged indifferent. If all instructors agree that a difference of one point in their grades (away from 10) should not be considered as significant, student a has good grounds to complain. He can argue that he should be ranked before b: he has a significantly higher grade than b on g1while there is no significant difference between the other two grades.
The situation is the same vis-`a-vis c: a has a significantly higher grade on g2and
this is the only significant difference.
In a similar vein, using the same hypotheses, the following table appears even more problematic:
g1 g2 g3
a 13 12 11
b 11 13 12
c 12 11 13
since, while all students clearly obtain a similar average grade, a is significantly better than b (he has a significantly higher grade on g1 while there are no
significantly better than a (the reader will have noticed that this is a variant of the Condorcet paradox mentioned in chapter 2).
Aggregation rules using weighted sums will be dealt with again in chapters 4 and 6. In view of these few examples, we hope to have convinced the reader that although the weighted sum is a very simple and almost universally accepted rule, its use may be problematic for aggregating grades. Since grades are a complex evaluation model, this is not overly surprising. If it is admitted that there is no easy way to evaluate the performance of a student in a given course, there is no reason why there should be an obvious one for an entire programme. In particular, the necessity and feasibility of using rules that completely rank order all students might well be questioned.
3.4
Conclusions
We all have been accustomed to seeing our academic performances in courses evaluated through grades and to seeing these grades amalgamated in one way or another in order to judge our “overall performance”. Most of us routinely grade various kinds of work, prepare exams, write syllabi specifying a grading policy, etc. Although they are very familiar, we have tried to show that these activities may not be as simple and as unproblematic as they appear to be. In particular, we discussed the many elements that may obscure the interpretation of grades and argued that the common weighted sum rule to amalgamate them may not be without difficulties. We expect such difficulties to be present in the other types of evaluation models that will be studied in this book.
We would like to emphasise a few simple ideas to be drawn from this example that we should keep in mind when working on different evaluation models:
• building an evaluation model is a complex task even in simple situations. Actors are most likely to modify their behaviour in response to the imple-mentation of the model;
• “evaluation operations” are complex and should not be confused with “mea-surement operations” in Physics. When they result in numbers, the proper-ties of these numbers should be examined with care; using “numbers” may be only a matter of convenience and does not imply that any operation can be meaningfully performed on these numbers.
• the aggregation of the result of several evaluation models should take the nature of these models into account. The information to be aggregated may itself be the result of more or less complex aggregation operations (e.g. ag-gregating the grades obtained at the mid-term and the final exams) and may be affected by imprecision, uncertainty and/or inaccurate determination.
• aggregation models should be analysed with care. Even the simplest and most familiar ones may in some cases lead to surprising and undesirable conclusions.
Finally we hope that this brief study of the evaluation procedures of students will also be the occasion for instructors to reflect on their current grading practices. This has surely been the case for the authors.
4
CONSTRUCTING MEASURES: THE
EXAMPLE OF INDICATORS
5
ASSESSING COMPETING
PROJECTS: THE EXAMPLE OF
COST-BENEFIT ANALYSIS
6
COMPARING ON THE BASIS OF
SEVERAL ATTRIBUTES: THE
EXAMPLE OF MULTIPLE CRITERIA
DECISION ANALYSIS
7
DECIDING AUTOMATICALLY:
THE EXAMPLE OF RULE BASED
CONTROL
8
DEALING WITH UNCERTAINTY:
AN EXAMPLE IN ELECTRICITY
PRODUCTION PLANNING
9
SUPPORTING DECISIONS: A
REAL-WORLD CASE STUDY
10
CONCLUSION
[1] Airaisian, P.W. (1991). Classroom assessment, McGraw-Hill, New York.
[2] Bonboir, A. (1972). La docimologie, PUF, Paris.
[3] Cardinet, J. (1986). ´Evaluation scolaire et mesure, De Boeck, Brussels.
[4] Chatel, E. (1994). Qu’est-ce qu’une note : recherche sur la pluralit´e des modes d’´education et d’´evaluation, Les Dossiers d’ ´Education et Forma-tions 47: 183–203.
[5] Cross, L.H. (1995). Grading students, Technical Report Series EDO-TM-95-5, ERIC/AE Digest.
[6] Davis, B.G. (1993). Tools for teaching, Jossey-Bass, San Francisco.
[7] de Ketele, J.-M. (1982). La docimologie, Cabay, Louvain-La-Neuve.
[8] de Landsheere, G. (1980). ´Evaluation continue et examens. Pr´ecis de doci-mologie, Labor-Nathan, Paris.
[9] Ebel, R.L. and Frisbie, D.A. (1991). Essentials of educational measurement, Prentice-Hall, New-York.
[10] French, S. (1981). Measurement theory and examinations, British Journal of
Mathematical and Statistical Psychology 34: 38–49.
[11] French, S. (1993). Decision theory – An introduction to the mathematics of
rationality, Ellis Horwood, London.
[12] Grabisch, M. (1996). The application of fuzzy integrals to multicriteria deci-sion making, European Journal of Operational Research 89: 445–456.
[13] Kerlinger, F.N. (1986). Foundations of behavioral research, 3rd edn, Holt, Rinehart and Winston, New York.
[14] Laska, J.A. and Juarez, T. (1992). Grading and marking in American schools:
Two centuries of debate, Charles C. Thomas, Springfield.
[15] Lindheim, E., Morris, L.L. and Fitz-Gibbon, C.T. (1987). How to measure
performance and use tests, Sage Publications, Thousand Oaks.
[16] Lysne, A. (1984). Grading of student’s attainement: Purposes and functions,
Scandinavian Journal of Educational Research 28: 149–165.
[17] McLean, J.E. and Lockwood, R.E. (1996). Why and how should we assess
students? The competing measures of student performance, Sage
Publica-tions, Thousand Oaks.
[18] Merle, P. (1996). L’´evaluation des ´el`eves. Enquˆete sur le jugement professoral, PUF, Paris.
[19] Moom, T.M. (1997). How do you know they know what they know? A
hand-book of helps for grading and evaluating student progress, Grove
Publish-ing, Westminster.
[20] Noizet, G. and Caverini, J.-P. (1978). La psychologie de l’´evaluation scolaire, PUF, Paris.
[21] Pi´eron, H. (1963). Examens et docimologie, PUF, Paris.
[22] Popham, W.J. (1981). Modern educational measurement, Prentice-Hall, New-York.
[23] Riley, H.J., Checca, R.C., Singer, T.S. and Worthington, D.F.. (1994). Grades
and grading practices: The results of the 1992 AACRAO survey, American
Association of Collegiate Registrars and Admissions Officers, Washington D.C.
[24] Sabot, R. and Wakeman, L.J. (1991). Grade inflation and course choice,
Jour-nal of Economic Perspectives 5: 159–170.
[25] Sager, C. (1994). Eliminating grades in schools: An allegory for change, A S Q Quality Press, Milwaukee.
[26] Speck, B.W. (1998). Grading student writing: An annotated bibliography, Greenwood Publishing Group, Westport.
[27] Stratton, R.W., Myers, S.C. and King, R.H. (1994). Faculty behavior, grades and student evaluations, Journal of Economic Education 25: 5–15.
[28] Tchudi, S. (1997). Alternatives to grading student writing, National Council of Teachers of English, Urbana.
[29] Vassiloglou, M. (1984). Some multi-attribute models in examination assess-ment, British Journal of Mathematical and Statistical Psychology 37: 216– 233.
[30] Vassiloglou, M. and French, S. (1982). Arrow’s theorem and examination assessment, British Journal of Mathematical and Statistical Psychology 35: 183–192.
aggregation, 6, 17, 27 additive, 20 compensation, 22 conjunctive rule, 17 linearity, 22 weight, 11 weighted average, 18 anchoring effect, 10 cardinal, 23 compensation, 22 computer science, 6 Condorcet paradox, 27 conjunctive rule, 17 dominance, 27 engineering, 6 evaluation model, 16, 27 GPA, 24 grade, 5 anchoring effect, 10 GPA, 24 marking scale, 9 minimal passing, 12, 18 standardised score, 10 imprecision, 27 marking scale, 9 mathematics, 6 measurement, 14, 27 cardinal, 23 ordinal, 15, 23 reliability, 9 scale, 8, 14 validity, 9 model, 16 operational research, 6 ordinal, 15, 23 preference threshold, 26 scale, 8, 14 threshold, 26 uncertainty, 27 voting procedure Concordet paradox, 27 weight, 11 weighted average, 18 45
aggregation, 6, 17, 27 additive, 20 compensation, 22 conjunctive rule, 17 linearity, 22 weight, 11 weighted average, 18 anchoring effect, 10 cardinal, 23 compensation, 22 computer science, 6 Condorcet paradox, 27 conjunctive rule, 17 dominance, 27 engineering, 6 evaluation model, 16, 27 GPA, 24 grade, 5 anchoring effect, 10 GPA, 24 marking scale, 9 minimal passing, 12, 18 standardised score, 10 imprecision, 27 marking scale, 9 mathematics, 6 measurement, 14, 27 cardinal, 23 ordinal, 15, 23 reliability, 9 scale, 8, 14 validity, 9 model, 16 operational research, 6 ordinal, 15, 23 preference threshold, 26 scale, 8, 14 threshold, 26 uncertainty, 27 voting procedure Concordet paradox, 27 weight, 11 weighted average, 18 46