Title: Evaluation of the Quebec Healthy Enterprise Standard: Effect on adverse physical and psychosocial work factors and work-related musculoskeletal problems
Running title: Effect of QHES on adverse work factors and WMSP
Authors:
Karine Aubé1,2, MScPH
Caroline S. Duchaine1,2 , MSc, PhD candidate
Clermont E. Dionne1,2, PhD
Michel Vézina3, MD, MPH, FRCP
Marie-Michèle Mantha-Bélisle3, MBA
Hélène Sultan-Taïeb4, PhD
France St-Hilaire5, PhD
Caroline Biron6, PhD
Chantal Brisson1,2, PhD
1Faculty of Medicine, Laval University, Quebec City, QC G1V 0A6, Canada
2Population Health and Optimal Health Practices Unit, CHU de Quebec Research Center,
Quebec City, QC G1S 4L8, Canada
3Institut national de santé publique du Québec (INSPQ), Quebec City, QC G1V 5B3, Canada
4School of Management Sciences, University of Quebec in Montréal, Montreal, QC H2X 3X2,
Canada
5Management School, University of Sherbrooke, Sherbrooke, QC J1K 2R1, Canada
6Faculty of Administration Sciences, Laval University, Quebec City, QC G1V 0A6, Canada
Corresponding author: Karine Aubé, CHU de Quebec Research Center Population Health and Optimal Health Practices Unit, 1050 Chemin Ste-Foy, Quebec, QC, G1S 4L8; Telephone: 418-682-7511, extension: 84537; Email: Karine.Aube@crchudequebec.ulaval.ca
Sources of funding and other acknowledgements: This project was funded by the Canadian Institutes of Health Research, Agreement number 01155-002. KA also obtained the bursary
Bourse de formation Desjardins pour la recherche et l’innovation for her work on this project.
The authors thank the INSPQ for data access. Conflict of interest: None declared.
Abstract
Objective: Evaluate the effect of the Quebec Healthy Enterprise Standard (QHES) on adverse physical and psychosocial work factors and work-related musculoskeletal problems (WMSP).
Methods: Workers of ten organizations completed questionnaires before (n=2849) and 2-3 years following (n=2560) QHES implementation. Outcomes were assessed using validated instruments.
Results: Workers exposed to adverse physical and psychosocial work factors had a higher prevalence of WMSP. After interventions, the prevalences of one adverse physical and three adverse psychosocial work factors were lower among workers exposed to interventions. Among men exposed to physical and psychosocial interventions, the lower prevalence of neck WMSP is compatible with a beneficial intervention effect. Other results generally showed few effects on WMSP.
Conclusions: Results suggest that QHES implementation lead to a decrease in some adverse physical and psychosocial factors. Few effects were observed on WMSP.
Keywords: Musculoskeletal problems; Psychosocial work factors; Physical work factors; Workplace intervention; Standard evaluation
Manuscript (All Manuscript Text Pages, including, References and Figure Legends - NO AUTHOR INFO)
2 INTRODUCTION
Work-related musculoskeletal problems (WMSP) are among the most frequent and costly
health problems experienced by the working population.1-3 Occupational health reports
estimate that over one-fifth of European1 and Canadian workers3 suffer from a WMSP.
Moreover and despite the fact that WMSP are often under-reported to workers’
compensation boards,4 over a third of work-related illnesses are due to a WMSP,
accounting for 34-76% of all work days lost.1,2,5-7 Efforts to reduce this disabling health
problem are thus important and constitute a significant occupational and public health concern.
WMSP refer to painful, non-traumatic inflammatory or degenerative disorders of the
musculoskeletal structures of the back, neck and upper or lower extremities.8 These
develop gradually and typically result from an accumulation of damage that exceeds the
structures’ adaptive capacity.8 According to Stock’s theoretical9 and validated10-12
framework, several workplace risk factors can interact to contribute to the development and maintenance of WMSP, including adverse physical and adverse psychosocial work factors. Adverse physical work factors refer to both the biomechanical factors of work (e.g. lifting heavy loads, exerting physical effort) and the physical work environment itself (e.g. workspace and equipment ergonomics). Adverse psychosocial work factors refer to the organizational and interpersonal conditions of a workplace that may negatively affect workers’ mental and/or physical health, such as high psychological
work demands, low job control, low social support at work and low rewards.13-15 Several
systematic reviews and primary studies provide support for the individual16-20 and
combined10,11,21,22 role of adverse physical and psychosocial work factors in the etiology
of WMSP among workers.
These adverse work factors are modifiable and the implementation of preventive interventions targeting both these factors could potentially improve the musculoskeletal
health of workers.9 However, the vast majority of intervention studies in this area have
focused on physical rather than psychosocial workplace risk factors.23,24 Given the
economic and social burden associated with WMSP1-3,5-7 and the role of adverse physical
and psychosocial work factors in their development9-12,21,22, it would be pertinent to
assess the impact of organizational interventions targeting both adverse physical and psychosocial work factors on WMSP.
In Quebec (Canada) in 2008, the Bureau de Normalisation du Quebec (BNQ; the province’s standard association) published the voluntary standard Prevention, Promotion
and Organizational Practices Contributing to Health in the Workplace (BNQ
9700-800/2008),25 more commonly called the Quebec Healthy Enterprise Standard (QHES).
The main purpose of this occupational health standard is to sustainably improve both the physical and mental health of workers. A comprehensive implementation process managed by the BNQ and leading to a certification ensures that the standard is appropriately implemented. Interventions implemented as part of the QHES are tailored to the organizations’ occupational context and target four areas of activity known to have an impact on workers’ health: Lifestyle habits, Work-life balance, Workplace
3 areas can include promoting physical activity and healthy nutritional choices at work (Lifestyle habits), providing telecommute options to workers to aid in harmonizing their professional and personal responsibilities (Work-life balance), installing ergonomic work stations (Workplace environment) and starting an employee recognition program (Management practices). Interventions implemented in these latter two areas of the QHES aim to reduce the two main occupational risk factors for WMSP: adverse physical
and adverse psychosocial work factors, respectively.25
The effect of this innovative standard on workers’ musculoskeletal health has not yet been evaluated. The aim of this study was to evaluate the effect of interventions implemented in the context of the QHES on the prevalence of adverse physical and adverse psychosocial work factors. Additionally, the aim was to evaluate the effect of these interventions on the prevalence of WMSP. This is one of the rare studies that evaluated the effect of preventive workplace interventions implemented in the context of a standard. Moreover, this study is one of the few that has evaluated the effect of interventions that aim to reduce both adverse physical and adverse psychosocial work factors on workers’ musculoskeletal outcomes, and the first to do so in the context of an occupational standard.
4 METHODS
Study design and population
Details regarding the study design and population have been published elsewhere.26
Briefly, this is a study derived from secondary data collected by the INSPQ (National Institute of Public Health of Quebec). At the study’s conception, organizations that were involved in the certification process and who had enlisted the INSPQ’s services to collect data for their needs assessment were invited to participate in the study. All ten organizations agreed to participate. These hailed from the public (7/10) and private (3/10) sectors, namely in public administration (8/10) and also in the manufacturing (1/10) and banking (1/10) sectors. Organization size varied from 103 to 1467 workers encompassing a range of occupations as supervisors, professionals, technicians, office workers, and manual workers. QHES implementation occurred between May 2011 and December 2013 (T1) and a follow-up was completed two to three years later, between May 2014 and November 2015 (T2). The final sample included 2849 workers at T1 (67-90% participation) and 2560 at T2 (63-88% participation).
This project was based on secondary data and, due to privacy issues, it was not possible to pair participants’ responses between T1 and T2. In addition, although all organizations collected WMSP information at T2, only two organizations did so at T1. Given these two constraints, a cross-sectional design at T2 was used.
QHES implementation and certification process
Details regarding the QHES implementation and certification process have been
published elsewhere.26 Briefly, the QHES is a voluntary standard and organizations were
responsible for implementing interventions. This is a participatory process involving management engagement, the establishment of a health and well-being committee, a
needs assessment and a continuous record of implemented intervention activities.27 The
needs assessment utilizes various methods of internal data collection (such as administrative data, survey data and employees’ suggestions) and is used by the health and well-being committee to guide intervention activities. All implemented interventions
are recorded in a logbook.25,27
The QHES certification process is under the responsibility of the BNQ, the province’s
standard association. As described previously,26 the BNQ performs rigorous external
audits in order to verify QHES implementation.27
Interventions in the Workplace environment and Management practices areas of the QHES
Each organization implements interventions that are tailored to their needs and occupational context. As such, interventions in each area vary from one organization to the next. Interventions in the Workplace environment area can include increasing the accessibility to tools and equipment that promote safe work, implementing ergonomic
programs as well as implementing programs for noise control and ventilation.25 The
5
and methods of work modality.25 Interventions in this area can thus include the
implementation of recognition programs, facilitating the communication channels between management and workers, including workers’ in decision-making and
opportunities for career development and training.25
Ethical considerations
This project was approved by the Research Ethics Committee of the University of Quebec in Montreal (S-7034324) and the Research Ethics Committee of the CHU de Quebec-Université Laval Research Center (108812). Informed consent was obtained from all participants. Data was made available to the present research team after consent was obtained from all participating organizations. Denomalized databases are stored under password protection on a secure network.
Data collection and measures
Data were collected by the INSPQ using a self-report questionnaire specifically created to evaluate the QHES. This 30-minute questionnaire was administered at the workplace during work hours and contained a variety of validated items to assess exposure to workplace risk factors and several health outcomes. A supplementary section was added to the T2 questionnaire to assess participants’ exposure to QHES interventions, as described below. Qualitative data of implemented interventions were obtained for seven of the 10 participating organizations by members of our research team in order to complement quantitative analyses and fulfill other project objectives.
Intervention exposure to the Workplace environment area of the QHES
Participants’ perceived exposure to interventions in the Workplace environment area of the QHES was assessed in the T2 questionnaire. Participants rated on a four-point Likert-type scale (none at all, little, enough, and many) the level of changes they perceived in their workplace as a result of interventions in the Workplace environment area of the QHES. Participants who responded none at all were considered not exposed to this area; all other responses were considered exposed.
Intervention exposure to the Management practices area of the QHES
Participants’ perceived exposure to interventions in the Management practices area of the QHES was assessed in the T2 questionnaire using items adapted from a questionnaire
previously used by our research group.28 Participants rated on a five-point scale the level
of changes they observed in their workplace since the implementation of the QHES with regard to 1) workload, 2) autonomy, 3) support from colleagues and superiors and 4) recognition. If participants responded, on any of the five items, that the changes they perceived in their workplace had improved, did not change or deteriorated their work situation, they were considered exposed to interventions. Participants were considered not exposed if they answered either no change implemented or I do not know to all five items. If all five items were rated as I do not know, it was treated as a non-response. The internal consistency (Cronbach’s alpha) of these five items was 0.89. This instrument was used for seven organisations which employed, collectively, 86% of the study population. For
6 the three remaining organisations (14%), one general item was used (similar to the
Workplace environment exposure item). Adverse physical work factors
Physical work factors were assessed using five items derived from a Quebec occupational
health survey.3 For four of these items, participants rated on a four-point Likert-type scale
from never to all the time how often they were exposed to the following adverse physical work factors: awkward trunk posture, performing repetitive or precise movements, exerting physical effort at work and handling heavy loads without help. The validity of
these items has been demonstrated in a systematic review.29 Participants were considered
exposed to an adverse physical work factor if they responded often or all the time. For the fifth item, participants rated on a four-point Likert scale how strongly they agreed to a statement that their workspace was designed to promote good posture. Participants were considered exposed to that adverse physical work factor if they responded disagree or
strongly disagree.
Adverse psychosocial work factors
As described in detail elsewhere,26 psychosocial work factors were assessed using items
from the validated versions of Karasek’s Job Content Questionnaire30, Siegrist’s ERI
Questionnaire31,32 and proxies from the Copenhagen Psychosocial Questionnaire33. For
all items, participants rated on a four-point Likert scale how strongly they agreed to statements regarding their work, from strongly disagree to strongly agree. Scores were dichotomized according to cut-off points corresponding to the medians for the general
working population of Quebec.3 Participants exposed to both high psychological
demands and low control are considered exposed to job strain.13 A ratio of the sum score
of the psychological demands scale (proxy of the effort scale, as in previous studies34) by
the sum score of the rewards scale was calculated. Participants with a ratio over one are
considered exposed to ERI.32
Work-related musculoskeletal problems
WMSP were assessed using four items adapted from the validated Nordic
Questionnaire.35 Fair to good agreement between self-reported musculoskeletal
symptoms and a physical examination of these has been documented.36 Participants
indicated on a four-point Likert-type scale ranging from never to all the time how often, in the past 12 months, they had felt significant pain that was partially or completely related to their current employment and that had disturbed them during their daily activities in four anatomical regions: neck, back, upper extremities (shoulders, arms, elbows, forearms, wrists, or hands) and lower extremities (hips, thighs, knees, legs, calves, or feet). The questionnaire specifically highlights that any pain due to an injury, trauma, or work accident are excluded from this assessment. Responses on these four items were dichotomized into absence (never and sometimes) or presence (often and all
the time) of WMSP for each anatomical region.3 Additionally, a fifth variable was created
in which participants with significant pain in at least one anatomical region were coded as having a “WMSP of any region”.
7
Covariates
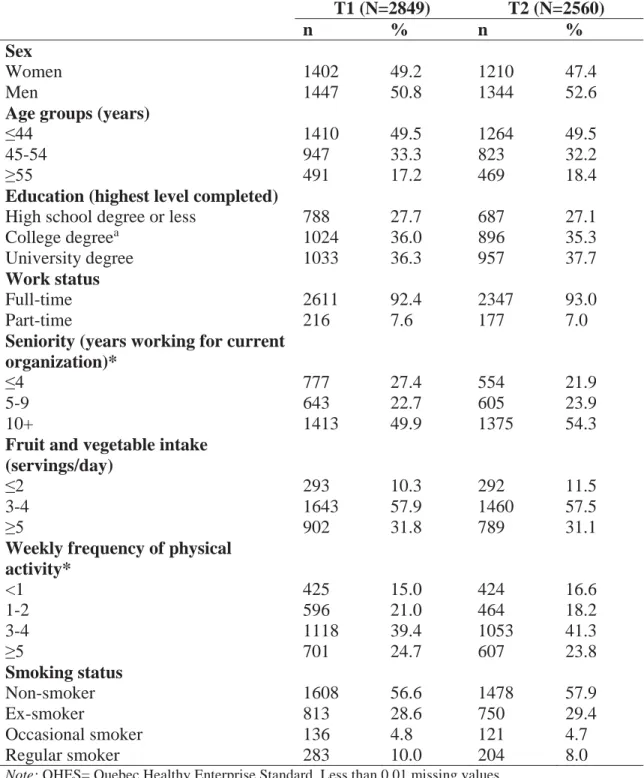
Collected by questionnaire, covariates were sex, age in years (<44, 45-54, ≥55), highest formal education completed (high school or less, college, university), work status (full-time or part-(full-time worker), seniority (years of employment with current employer), fruit and vegetable consumption (≤2, 3-4, ≥5 servings per day), level of physical activity (<1, 1-2, 3-4, ≥5 per week), and smoker status (non-smoker, ex-smoker, occasional smoker, regular smoker).
Data analysis
All statistical analyses were conducted using SAS 9.4 software.37 Chi-square (χ2) tests
were performed to compare participants’ characteristics between T1 and T2. Three groups of outcome variables were examined: adverse physical work factors, adverse psychosocial work factors and WMSP. Crude and adjusted prevalence ratios (PRs) and their 95% confidence intervals (CI) were estimated using log-binomial regressions and controlled for clustering by including random effects for organizations.
First, to verify the theoretical assumption that exposure to adverse physical and psychosocial work factors are associated with WMSP, cross-sectional analyses at T2 were computed to determine the association between the prevalence of WMSP of any region and independent and combined exposures to these adverse work factors. Second, cross-sectional analyses at T2 were computed to determine the association between outcomes according to participants’ self-reported exposure to interventions in the QHES: 1) adverse physical work factors and exposure to Workplace environment; 2) adverse psychosocial work factors and exposure to Management practices; and 3) WMSP and exposure to both areas. Three models were computed for each analysis (crude, adjusted for sociodemographic factors, adjusted for sociodemographic and lifestyle factors). Given the similar results these three models provided, only the full model will be presented in the tables (see Supplementary tables for results based on models 1 and 2). The two-tailed statistical significance level was fixed at 0.05. A difference of 15% in outcome prevalence was considered appropriate and of meaningful public health significance considering available data and previous studies in this field. All analyses were also conducted while stratifying by sex.
8 RESULTS
Table 1 presents participants’ characteristics at baseline (T1) and follow-up (T2). Our sample was composed of equal proportions of men and women. The majority of our participants were under the age of 45 years, were full-time employees and had worked at the participating organization for over 10 years.
As presented in Table 2, the prevalence of WMSP was positively associated with both independent and combined exposure to adverse physical and psychosocial work factors. Participants exposed to three or more adverse physical work factors (PR=2.09, 95%CI=1.94-2.25, p<0.0001) or three or more adverse psychosocial work factors (PR=1.69, 95%CI=1.44-1.98, p<0.0001) had a higher prevalence of WMSP compared to those exposed to none of these respective factors. Moreover, participants exposed to a combination of at least one adverse physical work factor and at least one adverse psychosocial work factor had a prevalence of WMSP two times higher than unexposed workers (PR=2.26, 95%CI=1.70-3.01, p<0.0001). In our sample, these associations were consistently stronger in men than in women.
After QHES implementation (T2): Prevalence of adverse work factors according to participants’ exposure to QHES intervention areas
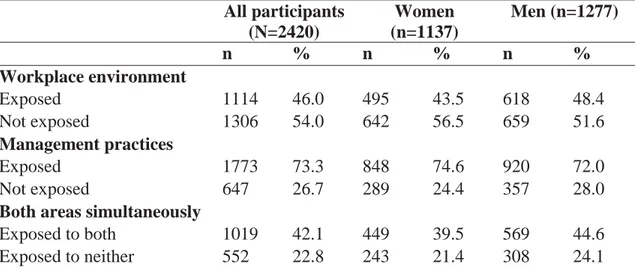
As shown in Table 3, following QHES implementation 46% of participants reported being exposed to interventions in the Workplace environment area, 73% in the
Management practices area, 42% in both these areas simultaneously and 23% reported
that they were not exposed to interventions in neither of these two areas.
Cross-sectional analyses after QHES implementation (T2) revealed that participants who reported being exposed to interventions in the Workplace environment area had a lower prevalence of working in a workspace that does not promote good posture compared to those not exposed to interventions in this area (PR=0.63, 95%CI=0.54-0.75, p<0.0001). However, the prevalences of all other adverse physical work factors were similar between the two groups, as shown in Table 4. Similar results were observed in the analyses stratified by sex.
As presented in Table 5, the prevalence of exposure to low job control (PR=0.90, 95%CI=0.84-0.96, p=0.002), low social support at work (PR=0.79, 95%CI=0.73-0.87,
p<0.0001) and low rewards (PR=0.86, 95%CI=0.80-0.93, p<0.0001) were lower among
participants who reported being exposed to interventions in the Management practices area of the QHES compared to those not exposed to interventions in this area. Similar results were obtained for the analyses stratified by sex with one exception; low job control was only lower among men exposed to the Management practices area (PR=0.82, 95%CI=0.75-0.90, p<0.0001). In contrast, the prevalence of exposure to high psychological job demands (PR=1.15, 95%CI=1.03-1.28, p=0.016) tended to be higher among participants who reported being exposed to interventions in the Management
9 After QHES implementation (T2): Prevalence of WMSP according to participants’ exposure to interventions in both QHES areas
The results for WMSP of the neck were compatible with a beneficial intervention effect, although this was not statistically significant. Indeed, the prevalence of WMSP of the neck was lower among participants exposed to both the Workplace environment and
Management practices areas of the QHES simultaneously compared to those not exposed
to either of these areas (PR=0.85, 95%CI=0.70-1.04, p=0.115) and this difference was more important among men (PR=0.74, 95%CI=0.52-1.06, p=0.099). However, no significant differences in the prevalence of any type of WMSP was observed between participants who reported being exposed to interventions in both areas of the QHES and those who were not exposed to these interventions, as shown in Table 6.
10 DISCUSSION
As expected from our theoretical framework,9 workers exposed to adverse physical and
psychosocial work factors had a higher prevalence of WMSP. Regarding adverse work factors, we compared workers who reported being exposed to interventions in each of the
Workplace environment and the Management practices areas of the QHES and those not
exposed to these areas. Among workers exposed to these interventions, the prevalence of one adverse physical work factor (workspace that does not promote good posture) and three adverse psychosocial work factors (low job control, low social support at work and low rewards) were lower than in workers not exposed to these interventions. Regarding WMSP, among men exposed to interventions in both areas simultaneously, the results for neck WMSP are compatible with a beneficial intervention effect. Other results generally showed few effects on WMSP.
Our findings on WMSP outcomes could, in part, be explained by the quality and intensity of implemented interventions. In the present study, only 42% of participants reported being exposed to interventions in both the Workplace environment and Management
practices areas of the QHES simultaneously. Moreover, less than half of participants
reported being exposed to interventions in the Workplace environment area. Although four of the seven organizations with available qualitative data implemented interventions in the Workplace environment area, the intervention activities in two of these organizations were merely holding conferences regarding ergonomics and handling heavy loads safely. These types of interventions do not directly reduce adverse physical work factors. Only two organizations aimed to directly reduce these and they did so by developing ergonomic workspaces and equipment. This qualitative data aligns well with our finding that participants who reported being exposed to interventions in the
Workplace environment area had a lower prevalence of exposure to a workspace that
does not promote good posture compared to those not exposed to this area.
Despite this, the evidence regarding the effectiveness of these types of intervention activities in preventing WMSP is mixed. The authors of a recent systematic review of workplace interventions found a moderate level of evidence to suggest that workstation adjustment alone has no effect on WMSP and that ergonomics training activities yield
mixed results in their effectiveness to prevent upper extremity WMSP.23 Moreover, a
systematic review of randomized control trials concludes that ergonomic interventions are not more effective in preventing or reducing low back pain and neck pain than no
intervention.38 Although we cannot imply causality, it is thus possible that the lack of an
intervention effect on WMSP in our study may be due to the fact that not many organizations chose to implement interventions in the Workplace environment area and, of those that did, their choice of interventions included activities that have yielded few beneficial effects on WMSP in the scientific literature.
In contrast to the Workplace environment area, almost three-quarters of participants reported being exposed to interventions in the Management practices area of the QHES. Five of the seven organizations with available qualitative data implemented interventions in the Management practices area. Moreover, each of these five organizations implemented at least three and an average of five intervention activities in this area. The
11 two most common intervention activities centered on recognition/reward programs and management training to promote a healthy psychosocial work environment. To our knowledge, only two studies have previously examined the impact of an organizational
psychosocial intervention on WMSP.39,40 Of these, only one39 reported a positive
intervention effect on the psychosocial work environment and a decrease in the
prevalence of WMSP was observed in that study.39
In the present study, no such intervention effect on WMSP was observed. Given that interventions in the Workplace environment yielded little effect on adverse physical work
factors but that the QHES had a beneficial effect on psychosocial work factors,26 it is
possible that changing the physical work environment may be more important in preventing WMSP. However, it is noteworthy that our results revealed that workers exposed to adverse physical and adverse psychosocial work factors, either independently or in combination, had a higher prevalence of WMSP. These findings, albeit
cross-sectional, provide support for Stock’s theoretical model9 and also corroborate previous
findings22,41-43 highlighting the role of both adverse physical and psychosocial work
factors in the development of WMSP. As such, it is also possible that the follow-up period was insufficient to affect the musculoskeletal health of participants. It is possible that even if interventions are effective in reducing these adverse factors, it would take some time for the beneficial effects of these to impact musculoskeletal health outcomes. The latency effect could thus possibly, and partially, explain our results.
This study has several strengths that distinguish it from the literature. This is the first study to assess the impact of participative, multi-component interventions targeting both adverse physical and adverse psychosocial work factors implemented in the context of an occupational standard on WMSP outcomes. Quebec’s standard association (BNQ) is responsible for the QHES certification process and performs external audits in order to
verify QHES implementation.27 This study also had a large sample size of workers
encompassing a wide range of occupations from 10 organizations of various sectors of activity. In addition, the use of qualitative data complemented the quantitative analyses and enriched our interpretation of the results.
Finally, this study has good external validity; a crucial aspect in intervention research
with public health implications.44 The participating organizations adopted the QHES of
their own initiative, chose the areas of activity relevant to their needs and developed interventions adapted to their organizational context. Our role as a research group was to assess the impact of the standard as it was interpreted and implemented in the participating organizations, without the interference of researchers. As such, this study assessed the impact of the QHES as it occurred in a natural situation.
The present study also has certain limitations, a number of which are inherent to the use of secondary data. First, the anonymity assured to participants made it impossible to pair participants’ responses between T1 and T2. As such, we were unable to neither observe the evolution of adverse work factors and WMSP from before to after QHES implementation nor control for the prevalences of these at baseline, thus limiting our ability to determine causality. Second, our study design lacked a control group which would have allowed us to compare differences in the evolution of outcomes between
12 organizations that implemented the QHES and those that did not. Third, perceived intervention exposure and outcomes were both assessed in the T2 questionnaire. This may have introduced the common method bias given that the adverse work factors assessed in the questionnaire have an inherent association with the intervention areas of the QHES.
Fourth, two forms of recall bias are possible in this study due to the instruments used to assess WMSP and intervention exposure. For WMSP, participants were asked to recall musculoskeletal pain and symptoms related to their work and experienced in the past 12 months. It is possible that participants recalled musculoskeletal symptoms that were non-work related or were exacerbated by non-work or that they recall a WMSP that occurred over 12 months ago, thereby leading to an under- or over-reporting of symptoms. For perceived intervention exposure, participants were asked to recall changes that occurred in their workplace due to the QHES. It may be difficult to recall changes and interventions that occurred, thereby leading to an underestimation of QHES intervention exposure. Conversely, participants could remember changes that were implemented that occurred outside of the QHES (for example, an independent exercise program) and attribute it to the QHES, thereby overestimating intervention exposure. Similarly, participants could recall an intervention that was implemented due to the QHES but believe it to be unrelated to the QHES, thereby underestimating intervention exposure. Finally, the generalizability of these results is limited to other organizations adopting the QHES that have a similar employee profile to that of the 10 participating organizations. More specifically, our participants had a lower prevalence of adverse physical work factors as well as a higher prevalence of adverse psychosocial work factors and WMSP than that documented in a representative occupational health survey of the province of
Quebec.3
Conclusion
This is one of the rare studies that evaluated the effect of preventive workplace interventions implemented in the context of an occupational standard. Moreover, this study is one of the few that evaluated the effect of interventions that aim to reduce both adverse physical and adverse psychosocial work factors on workers’ musculoskeletal health outcomes. Results suggest that the implementation of the QHES lead to a decrease in some adverse physical and psychosocial work factors. Few beneficial effects were observed on WMSP. Taken together with previous studies, our results suggest that further research is needed to evaluate the effectiveness of interventions targeting both these adverse work factors on musculoskeletal outcomes.
13 REFERENCES
1. Schneider E, Irastorza X. OSH in figures: Work-related musculoskeletal disorders
in the EU, Facts and figures [European Agency for Safety and Health at Work report]. 2010. Available at:
https://osha.europa.eu/en/tools-and-publications/publications/reports/TERO09009ENC. Accessed June 20 2016.
2. Health and Safety Executive. Work-related musculoskeletal disorder (WRMSDs)
Statistics in Great Britain 2017 [Health and Safety Executive report]. November 2017. Available at:
http://www.hse.gov.uk/statistics/causdis/musculoskeletal/msd.pdf?pdf=msd. Accessed June 18 2018.
3. Vézina M, Cloutier E, Stock S, et al. Enquête québécoise sur des conditions de
travail, d'emploi, et de santé et de sécurité du travail (EQCOTESST). Institut de
recherche Robert-Sauvé en santé et sécurité du travail; Institut national de santé publique du Québec; Institut de la statistique du Québec;2011. R-691.
4. Stock S, Nicolakakis N, Raïq H, Messing K, Lippel K, Turcot A. Underreporting
work absences for nontraumatic work-related musculoskeletal disorders to workers’ compensation: results of a 2007–2008 survey of the Quebec working population. American Journal of Public Health. 2014;104(3):e94-e101.
5. Safe Work Australia. Australian worker's compensation statistics, 2014-15 [Safe
Work Australia report]. July 28 2017. Available at:
https://www.safeworkaustralia.gov.au/system/files/documents/1707/australian-workers-compensation-statistics-2014-15-revised_1.pdf. Accessed August 2 2017.
14
6. Ministère de la décentralisation et de la fonction publique. Guide pratique:
Démarche de prévention des troubles musculo-squelettiques (TMS) [Le Portail de la Fonction Publique guide]. February 28 2015. Available at:
https://www.fonction-publique.gouv.fr/files/files/publications/coll_outils_de_la_GRH/guide_pratique_T MS.pdf. Accessed August 2 2017.
7. Michel C, Arcand R, Crevier H, et al. Portrait national des troubles
musculo-squelettiques (TMS) 1998-2007 : TMS sous surveillance [Institut national de santé publique du Québec report]. September 2010. Available at:
https://www.inspq.qc.ca/pdf/publications/1156_TMS1998-2007SousSurveillance.pdf. Accessed August 2 2017.
8. Stock S, Funes A, Delisle A, St-Vincent M, Turcot A, Messing K. Chapitre 7 :
Troubles musculo-squelettiques. Enquête québécoise sur des conditions de
travail, d'emploi, et de santé et de sécurité du travail (EQCOTESST): Institut de
recherche Robert-Sauvé en santé et sécurité du travail, Institut national de santé publique du Québec, Institut de la statistique du Québec; 2011:445-530.
9. Stock S, Nicolakakis N, Messing K, Turcot A, Raiq H. Quelle est la relation entre
les troubles musculo-squelettiques (TMS) liés au travail et les facteurs
psychosociaux?. Survol de diverses conceptions des facteurs psychosociaux du travail et proposition d’un nouveau modèle de la genèse des TMS. Perspectives
interdisciplinaires sur le travail et la santé. 2013;15(2):1-20.
10. Nicolakakis N, Stock S, Kline R. Non-traumatic upper extremity musculoskeletal
15 distress: a path analysis of mediated and moderated effects. PREMUS2016: Ninth International Scientific Conference on the Prevention of Work-Related
Musculoskeletal Disorders; 2016; Toronto, Canada.
11. Nicolakakis N, Stock SR, Abrahamowicz M, Kline R, Messing K. Relations
between work and upper extremity musculoskeletal problems (UEMSP) and the moderating role of psychosocial work factors on the relation between computer work and UEMSP. International Archives of Occupational and Environmental
Health. 2017;90(8):751-764.
12. Stock S, Raiq H, Nicolakakis N, Messing K, Turcot A, Abrahamowicz M. La
détresse psychologique : quel rôle joue-t-elle dans la relation entre les risques psychosociaux du travail et les maux de dos. In: Lerouge L, ed. Approche
interdisciplinaire des risques psychosociaux au travail. Toulouse: Octares
Editions; 2015:309-334.
13. Karasek RA. Job demands, job decision latitude, and mental strain: Implications
for job redesign. Administrative Science Quarterly. 1979;24(2):285-308.
14. Johnson JV, Hall EM. Job strain, work place social support, and cardiovascular
disease: A cross-sectional study of a random sample of the Swedish working population. American Journal of Public Health. 1988;78(10):1336-1342.
15. Siegrist J. Adverse health effects of high-effort/low-reward conditions. Journal of
Occupational Health Psychology. 1996;1(1):27-41.
16. da Costa BR, Vieira ER. Risk factors for work-related musculoskeletal disorders:
A systematic review of recent longitudinal studies. American Journal of
16
17. Lang J, Ochsmann E, Kraus T, Lang JW. Psychosocial work stressors as
antecedents of musculoskeletal problems: A systematic review and meta-analysis of stability-adjusted longitudinal studies. Social Science & Medicine.
2012;75(7):1163-1174.
18. Hauke A, Flintrop J, Brun E, Rugulies R. The impact of work-related
psychosocial stressors on the onset of musculoskeletal disorders in specific body regions: A review and meta-analysis of 54 longitudinal studies. Work & Stress. 2011;25(3):243-256.
19. Macfarlane GJ, Pallewatte N, Paudyal P, et al. Evaluation of work-related
psychosocial factors and regional musculoskeletal pain: results from a EULAR Task Force. Annals of the Rheumatic Diseases. 2009;68(6):885-891.
20. Bongers P, Ijmker S, Van den Heuvel S, Blatter B. Epidemiology of work related
neck and upper limb problems: psychosocial and personal risk factors (part I) and effective interventions from a bio behavioural perspective (part II). Journal of
Occupational Rehabilitation. 2006;16(3):272-295.
21. Widanarko B, Legg S, Devereux J, Stevenson M. The combined effect of
physical, psychosocial/organisational and/or environmental risk factors on the presence of work-related musculoskeletal symptoms and its consequences.
Applied Ergonomics. 2014;45(6):1610-1621.
22. Lapointe J, Dionne CE, Brisson C, Montreuil S. Interaction between postural risk
factors and job strain on self-reported musculoskeletal symptoms among users of video display units: A three-year prospective study. Scandinavian Journal of
17
23. Van Eerd D, Munhall C, Irvin E, et al. Effectiveness of workplace interventions in
the prevention of upper extremity musculoskeletal disorders and symptoms: An update of the evidence. Occupational and Environmental Medicine.
2016;73(1):62-70.
24. Stock S, Nicolakakis N, Vezina N, et al. Are work organization interventions
effective in preventing or reducing work-related musculoskeletal disorders? A systematic review of the literature. Scandinavian Journal of Work, Environment
and Health. 2018;44(2):113-133.
25. Bureau de Normalisation du Québec. Prevention, Promotion and Organizational
Practices for Health in the Workplace [standard]. BNQ 9700-800/2008. Québec: Bibliothèque et Archives nationales du Québec; 2008.
26. Letellier MC, Duchaine CS, Aube K, et al. Evaluation of the Quebec Healthy
Enterprise Standard: Effect on Adverse Psychosocial Work Factors and Psychological Distress. International Journal of Environmental Research and
Public Health. 2018;15(3).
27. Bureau de Normalisation du Québec. Protocole de certification BNQ
9700-880/2014. Québec: Bibliothèque et Archives nationales du Québec; 2014.
28. Hasson H, Brisson C, Guérin S, et al. An organizational-level occupational health
intervention: Employee perceptions of exposure to changes, and psychosocial outcomes. Work & Stress. 2014;28(2):179-197.
29. Stock S, Fernandes R, Delisle A, Vezina N. Reproducibility and validity of
workers' self-reports of physical work demands. Scandinavian Journal of Work,
18
30. Karasek RA, Brisson C, Kawakami N, Houtman I, Bongers P, Amick B. The Job
Content Questionnaire (JCQ): An instrument for internationally comparative assessments of psychosocial job characteristics. Journal of Occupational Health
Psychology. 1998;3(4):322-355.
31. Niedhammer I, Siegrist J, Landre M, Goldberg M, Leclerc A. Étude des qualités
psychométriques de la version française du modèle du Déséquilibre Efforts/Récompenses. Revue d'épidémiologie et de santé publique. 2000;48(5):419-438.
32. Siegrist J, Li J, Montano D. Psychometric properties of the Effort-Reward
Imbalance Questionnaire [Düsseldorf University web site]. June 4 2014. Available at:
https://www.uniklinik-duesseldorf.de/fileadmin/Datenpool/einrichtungen/institut_fuer_medizinische_soz iologie_id54/ERI/PsychometricProperties.pdf. Accessed February 9 2016.
33. Kristensen TS, Hannerz H, Høgh A, Borg V. The Copenhagen Psychosocial
Questionnaire - A tool for the assessment and improvement of the psychosocial work environment. Scandinavian Journal of Work, Environment and Health. 2005;31(6):438-449.
34. Bourbonnais R, Jauvin N, Dussault J, Vezina M. Psychosocial work environment,
interpersonal violence at work and mental health among correctional officers.
International journal of law and psychiatry. 2007;30(4-5):355-368.
35. Kuorinka I, Jonsson B, Kilbom A, et al. Standardised Nordic questionnaires for
the analysis of musculoskeletal symptoms. Applied Ergonomics. 1987;18(3):233-237.
19
36. Perreault N, Brisson C, Dionne CE, Montreuil S, Punnett L. Agreement between a
self-administered questionnaire on musculoskeletal disorders of the neck-shoulder region and a physical examination. BMC Musculoskeletal Disorders.
2008;9(34):1-9.
37. SAS 9.4 Software for Windows [computer program]. Cary, NC, USA: SAS
Institute Inc; 2013.
38. Driessen MT, Proper KI, van Tulder MW, Anema JR, Bongers PM, van der Beek
AJ. The effectiveness of physical and organisational ergonomic interventions on low back pain and neck pain: a systematic review. Occupational and
Environmental Medicine. 2010;67(4):277-285.
39. Gilbert-Ouimet M, Brisson C, Vezina M, et al. Intervention study on psychosocial
work factors and mental health and musculoskeletal outcomes. Healthcare
Papers. 2011;11 Spec No:47-66.
40. La Rosa-Rodriguez E, Le Clesiau H, Dubois G, et al. [Assessment of job stress
after implementation of prevention measures in a pension fund]. Sante Publique. 2013;25(1):59-67.
41. Widanarko B, Legg S, Devereux J, Stevenson M. Interaction between physical
and psychosocial risk factors on the presence of neck/shoulder symptoms and its consequences. Ergonomics. 2015;58(9):1507-1518.
42. Widanarko B, Legg S, Devereux J, Stevenson M. Interaction between physical
and psychosocial work risk factors for low back symptoms and its consequences amongst Indonesian coal mining workers. Applied Ergonomics. 2015;46(Pt A):158-167.
20
43. Lapointe J, Dionne CE, Brisson C, Montreuil S. Effort-reward imbalance and
video display unit postural risk factors interact in women on the incidence of musculoskeletal symptoms. Work. 2013;44(2):133-143.
44. Tarquinio C, Kivits J, Minary L, Coste J, Alla F. Evaluating complex
interventions: perspectives and issues for health behaviour change interventions.
Effect of QHES on adverse work factors and WMSP
Table 1. Characteristics of the study population before (T1) and after (T2) QHES implementation T1 (N=2849) T2 (N=2560) n % n % Sex Women 1402 49.2 1210 47.4 Men 1447 50.8 1344 52.6
Age groups (years)
≤44 1410 49.5 1264 49.5
45-54 947 33.3 823 32.2
≥55 491 17.2 469 18.4
Education (highest level completed)
High school degree or less 788 27.7 687 27.1
College degreea 1024 36.0 896 35.3
University degree 1033 36.3 957 37.7
Work status
Full-time 2611 92.4 2347 93.0
Part-time 216 7.6 177 7.0
Seniority (years working for current organization)*
≤4 777 27.4 554 21.9
5-9 643 22.7 605 23.9
10+ 1413 49.9 1375 54.3
Fruit and vegetable intake (servings/day)
≤2 293 10.3 292 11.5
3-4 1643 57.9 1460 57.5
≥5 902 31.8 789 31.1
Weekly frequency of physical activity* <1 425 15.0 424 16.6 1-2 596 21.0 464 18.2 3-4 1118 39.4 1053 41.3 ≥5 701 24.7 607 23.8 Smoking status Non-smoker 1608 56.6 1478 57.9 Ex-smoker 813 28.6 750 29.4 Occasional smoker 136 4.8 121 4.7 Regular smoker 283 10.0 204 8.0
Note: QHES= Quebec Healthy Enterprise Standard. Less than 0.01 missing values.
*p-value for Chi-square test is statistically significant (p<0.05)
aIn the province of Québec, college refers to pre-university education or vocational/technical training. Table 1
Effect of QHES on adverse work factors and WMSP
Table 2. Cross-sectional (T2) associations between the prevalence of WMSP of any region and independent and combined exposure to adverse physical and psychosocial work factors, amongst all participants and by sex
WMSP
n % PR 95% CI p-value
Adverse physical work factors All participants (N=2560)
Not exposed 256 26.8 REF REF REF
Exposed to 1-2 factors 573 39.9 1.46 1.35-1.57 <0.0001a
Exposed to 3+ factors 252 55.8 2.09 1.94-2.25 <0.0001a
Women (n=1210)
Not exposed 135 31.4 REF REF REF
Exposed to 1-2 factors 322 44.9 1.41 1.25-1.58 <0.0001a
Exposed to 3+ factors 116 60.4 1.55 1.28-1.88 <0.0001a
Men (n=1344)
Not exposed 121 23.3 REF REF REF
Exposed to 1-2 factors 249 34.7 1.52 1.19-1.95 <0.0001a
Exposed to 3+ factors 135 51.8 2.19 1.93-2.49 <0.0001a
Sex*factor interaction . . . . 0.657a
Adverse psychosocial work factors All participants (N=2560)
Not exposed 95 27.0 REF REF REF
Exposed to 1-2 factors 383 34.4 1.29 1.14-1.46 <0.0001a
Exposed to 3+ factors 604 45.5 1.69 1.44-1.98 <0.0001a
Women (n=1210)
Not exposed 59 32.9 REF REF REF
Exposed to 1-2 factors 211 40.1 1.23 1.03-1.46 0.021a
Exposed to 3+ factors 303 49.9 1.53 1.30-1.81 <0.0001a
Men (n=1344)
Not exposed 36 20.8 REF REF REF
Exposed to 1-2 factors 171 29.2 1.39 1.04-1.86 0.024a
Exposed to 3+ factors 299 41.5 1.92 1.42-2.58 <0.0001a
Sex*factor interaction . . . . 0.237a
Combined exposure All participants (N=2560)
Exposed to neither 38 19.6 REF REF REF
Exposed to both 766 44.9 2.26 1.70-3.01 <0.0001
Women (n=1210)
Exposed to neither 25 25.1 REF REF REF
Exposed to both 402 49.4 1.95 1.40-2.73 <0.0001
Men (n=1344)
Exposed to neither 13 13.5 REF REF REF
Effect of QHES on adverse work factors and WMSP
Exposed to both 361 40.4 2.91 1.76-4.83 <0.0001
Sex*factor interaction . . . . 0.470
Note: T2= after QHES implementation; WMSP= work-related musculoskeletal problems; PR= prevalence
ratio; 95% CI= 95% confidence interval. Combined exposure= combined exposure to at least one adverse physical and at least one adverse psychosocial work factor. Number of participants with outcome (N) and its associated prevalence (%) may not correspond as prevalence is adjusted for the random effect of organization.
Models adjusted for age, sex, education, full-time or part-time work status, seniority, fruit and vegetable consumption, level of physical activity and smoker status as well as organization as a random effect to take clustering into account in the analyses.
aPRs for these models were estimated using Poisson regressions with sandwich variance estimators. Due to
numerical problems in these models, we are not confident that the generated p-values are precise and these must therefore be interpreted with caution.
Effect of QHES on adverse work factors and WMSP
Table 3. Frequency and proportion of participants who reported being exposed to interventions in the two QHES areas of interest at T2
All participants (N=2420) Women (n=1137) Men (n=1277) n % n % n % Workplace environment Exposed 1114 46.0 495 43.5 618 48.4 Not exposed 1306 54.0 642 56.5 659 51.6 Management practices Exposed 1773 73.3 848 74.6 920 72.0 Not exposed 647 26.7 289 24.4 357 28.0
Both areas simultaneously
Exposed to both 1019 42.1 449 39.5 569 44.6
Exposed to neither 552 22.8 243 21.4 308 24.1
Note: QHES= Quebec Healthy Enterprise Standard; T2= after QHES implementation. 0.06 missing values Table 3
Effect of QHES on adver
se work factors and
W M SP Table 4. Pre v alenc e and pre valen ce r atios (PR) of a dverse ph ys ical work factors ac cordin g to partici pants’ sel f-r eported ex posure to interve ntions in the W o rk place environm ent ar ea after Q H ES implementati on, among st all pa rticipa n ts and b y sex
Not exposed to WE area (N
=1306) Expose d to WE area (N =1114) n % n % PR 95% CI p -value Sex*time interaction
Workspace does not prom
o te good posture All par ticipants 354 23.6 178 14.8 0.63 0.54-0.75 <0.0001 Women 172 24.8 71 13.5 0.53 0.41-0.69 <0.0001 Men 180 22.1 107 15.8 0.74 0.59-0.92 0.007 0.055 Awk w ar d tr unk posture All par ticipants 374 30.2 304 27.8 0.89 0.78-1.02 0.091 Women 179 29.2 131 26.1 0.87 0.75-1.02 0.095 a Men 193 31.4 173 29.4 0.90 0.79-1.02 0.102 a 0.695 Rep etitiv e/ p re cise m o v emen ts All par ticipants 618 45.7 533 47.1 1.00 0.93-1.06 0.885 a Women 336 51.3 274 53.8 1.02 0.93-1.12 0.698 a Men 280 40.9 259 41.5 0.97 0.86-1.09 0.597 a 0.551 P h ysical ef fo rt All par ticipants 197 18.1 213 18.5 0.98 0.84-1.13 0.758 a Women 70 12.7 60 11.4 0.88 0.66-1.18 0.396 a Men 126 23.3 153 25.5 1.03 0.84-1.26 0.796 a 0.390 Handli ng heavy loads All par ticipants 131 12.0 132 11.1 0.87 0.68-1.10 0.231 Women 44 7.4 34 5.9 0.81 0.53-1.24 0.338 Men 86 16.4 98 16.3 0.89 0.67-1.18 0.419 0.723 Table 4
Effect of QHES on adver
se work factors and
W M SP No te : QHES= Q u eb ec Healthy En terprise Sta n dard; W E = Workp lace en vironmen t area of th e Q H E S ; 95% C I= 95% confiden ce in ter v al. N of w o m e n not ex posed to WE area= 642; w o m e n e x pos ed=495; m e n n o t ex pos ed to WE area=6 59; m e n ex pos ed= 618. 0. 06 m is si n g v al u es. N u m b er of participa n ts w ith ou tc om e (N ) and its as sociated prevalence ( %) m a y n o t co rrespon d as p re v alence i s ad ju sted f o r th e ran dom e ff ec t o f org an izatio n . Mo dels ad ju sted f o r age, sex, ed u cation , fu ll -t im e or part -t im e w o rk stat us, sen iorit y , f ru it and v egetab le co ns um ptio n , l evel of phy sica l activit y a n d s m o k er status as w ell a s org aniza tion as a rando m eff ect to tak e cl us terin g i n to acco un t i n th e a n al y se s. aP R s f o r th e se m odels w ere es ti m ated usi n g P o isso n regress ion s w it h sa n d w ich v arian ce e sti m ato rs. D u e to n u m erical pr oblem s in t h e se m odels, w e are n o t co n fide n t th a t th e g enerated p -v alu e
s are precise and th
e se m u st t h er ef ore be in terpreted w ith cau tion .
Effect of QHES on adver
se work factors and
W M SP Table 5. Pre valenc e and pre valen ce r atios (PR) of adverse ps yc hosocial w ork f actors ac cordin g to pa rticipants’ self -r eported e x posure to interventions in the Manageme nt practices
area after QHES implementation
, among st all participa n ts and b y sex Not exposed to MP ar ea (N =647) Expose d to MP a rea (N =1773) n % n % PR 95% CI p -value Sex*time inte raction High psycholog ical demands All par ticipants 250 36.9 740 41.0 1.15 1.03-1.28 0.016 Women 113 36.7 341 39.2 1.09 0.93-1.28 0.305 Men 136 36.8 398 42.7 1.19 1.03-1.38 0.020 0.419 Low job contr o l All par ticipants 383 61.4 1008 57.1 0.90 0.84-0.96 0.002 a Women 158 56.8 495 57.9 0.99 0.91-1.08 0.833 a Men 224 65.6 512 56.6 0.82 0.75-0.90 <0.0001 a <0.0001 Low soc ial s uppor t at wor k All par ticipants 341 56.1 768 44.5 0.79 0.73-0.87 <0.0001 Women 137 50.2 348 41.3 0.83 0.72-0.96 0.010 Men 204 62.1 419 48.0 0.77 0.69-0.86 <0.0001 0.425 Job str a in All par ticipants 136 20.2 389 20.7 1.01 0.85-1.21 0.870 Women 60 19.8 179 19.3 0.99 0.76-1.28 0.932 Men 75 20.4 210 22.2 1.04 0.82-1.31 0.768 0.793 L o w rew ard s All par ticipants 432 63.6 972 53.8 0.86 0.80-0.93 <0.0001 Women 191 61.0 444 50.2 0.82 0.74-0.92 <0.001 Men 241 65.5 525 57.3 0.89 0.81-0.98 0.016 0.270 ERI Table 5
Effect of QHES on adver
se work factors and
W M SP All par ticipants 245 34.6 589 31.7 0.94 0.83-1.06 0.307 Women 104 32.1 266 29.4 0.92 0.77-1.11 0.403 Men 140 36.3 321 33.6 0.95 0.81-1.11 0.511 0.828 No te : QHES= Q u eb ec Healthy En terprise Sta n dard; MP = Management pr actices area of th
e QHES; 95% CI= 95% conf
idence in ter v al; ERI= e ff o rt -r ew ard im balan ce. N o f w o m e n n o t e x pos ed to MP area= 289; w o m en ex pos ed =848; m e n n o t ex p o se d to MP a rea=35 7 ; m e n expos ed=92 0 . 0. 06 m iss ing v alu e s. Nu m b er of participants w it h ou tco m e (N ) and its ass o ciated prevale nce (%) m a y n o t correspon d as p revalence is ad ju sted f o r t h e rando m eff ect o f org a n izatio n . Mo dels ad ju sted f o r age, sex, ed u cation , fu ll -t im e or part -t im e w o rk stat us, sen iorit y , f ru it and v egetab le co ns um ptio n , l evel of phy sica l activ it y a n d s m o k er status as w ell a s org aniza tion as a rando m eff ect to tak e cl us terin g i n to acco un t i n th e a n al y se s. aP R s f o r th e se m odels w ere es ti m ated usi n g P o isso n regress ion s w it h sa n d w ich v arian ce e sti m ato rs. D u e to n u m erical pr oblem s in t h ese m odels, we are n o t co n fide n t th a t th e g enerated p -v alu e
s are precise and th
e se m u st t h eref ore be in terpreted w ith cau tion .
Effect of QHES on adver
se work factors and
W M SP Table 6. Pre v alenc e and pre valen ce r atios (PR) of w ork-re lated musculosk eletal problems (W M SP) a ccordin g to pa rticipan ts ’ se lf -re ported ex posure
to interventions in both the
W o rk place en vironment and Manageme nt practic es ar eas simultane ous ly after QHES implementation, among st
all participants and b
y
se
x
Not exposed to eith
er a rea (N =552) Expose d to both are a s (N =1019) n % n % PR 95% CI p -value Sex*time inte raction WMSP of any region All par ticipants 225 36.2 408 37.6 1.02 0.90-1.16 0.739 Women 118 43.6 209 42.9 0.97 0.83-1.14 0.742 Men 106 30.1 199 33.0 1.09 0.90-1.32 0.375 0.183 WMSP of the nec k All par ticipants 127 18.2 182 15.9 0.85 0.70-1.04 0.115 Women 76 25.1 121 23.5 0.90 0.71-1.15 0.409 Men 50 12.4 61 9.4 0.74 0.52-1.06 0.099 0.009 WMSP of the back All par ticipants 130 19.7 243 21.0 1.06 0.88-1.28 0.555 Women 55 19.7 124 24.1 1.21 0.92-1.59 0.176 Men 74 19.2 119 18.4 0.94 0.72-1.21 0.610 0.243 WMSP of
the upper ext
re m ities All par ticipants 127 21.8 230 22.1 0.97 0.80-1.18 0.756 Women 67 26.6 128 27.5 0.99 0.77-1.27 0.917 Men 59 18.1 102 17.6 0.95 0.70-1.28 0.713 0.982 WMSP of the low er ext re m ities All par ticipants 69 12.3 142 12.9 1.04 0.79-1.37 0.800 Women 22 9.2 67 13.4 1.52 0.96-2.41 0.073 Men 46 14.4 75 12.5 0.80 0.56-1.13 0.198 0.153 Table 6
Effect of QHES on adver
se work factors and
W M SP No te : QHES= Q u eb ec Healthy En terprise Sta n dard; 9 5 % CI= 95% con fidence i n terv al. N of w o m e n n o t ex posed to either area=2 4 3 ; w o m e n e x pos ed to both areas=4 49; m e n n o t ex posed t o eith er area=3 08; m en e x pos ed to b o th areas=5 69. 0 .06 m issi n g v al u es. N u m b er of parti c ipants w it h ou tco m e (N) and it s ass o ciated prevalence (%) m a y n o t correspon d as p revalenc e is ad ju sted f o r th e rando m e ff ect o f org a n izatio n . Mo dels ad ju sted f o r age, sex, ed u cation , fu ll -t im e or part -t im e w o rk stat us, sen iorit y , f ru it and v egetab le co ns um ptio n , l evel of phy sica l activit y a n d s m o k er status as w ell a s org aniza tion as a rando m eff ect to tak e cl us terin g i n to acco un t i n th e a n al y se s.