Geosci Data J. 2020;00:1–6. wileyonlinelibrary.com/journal/gdj3
|
1 D A T A PA P E RA database of Holocene temperature records for north-eastern
North America and the north-western Atlantic
Simon van Bellen
|
Anne de Vernal
|
Anna To
|
Marie-Michèle Ouellet-Bernier
|
Natasha Roy
|
ClimHuNor Members
This is an open access article under the terms of the Creative Commons Attribution License, which permits use, distribution and reproduction in any medium, provided the original work is properly cited.
© 2020 The Authors. Geoscience Data Journal published by Royal Meteorological Society and John Wiley & Sons Ltd.
Dataset
Identifier: https://doi.org/10.1594/PANGA EA.905293 Creator: Simon van Bellen
Title: Holocene temperature reconstructions for north-eastern North America and the north-western Atlantic Publisher: PANGAEA Data Archiving & Publication
Publication year: 2019 Resource type: Dataset
†See ClimHuNor Members in Appendix section. Geotop-Université du Québec à Montréal, Montréal, QC, Canada
Correspondence
Simon van Bellen, 201, Avenue du Président-Kennedy, 7e étage, Local PK-7150, Montréal, QC H2X 3Y7, Canada. Email: [email protected]
Funding information
This article was funded by grants from FRQ.
Abstract
Centennial-to-millennial temperature records of the past provide a context for the in-terpretation of current and future changes in climate. Quaternary climates have been relatively well studied in north-east North America and the adjacent Atlantic Ocean over the last decades, and new research methods have been developed to improve re-constructions. We present newly inferred reconstructions of sea surface temperature for the north-western Atlantic region, together with a compilation of published temperature records. The database thus comprises a total of 86 records from both marine and terres-trial sites, including lakes, peatlands, ice and tree rings, each covering at least part of the Holocene. For each record, we present details on seasons covered, chronologies and in-formation on radiocarbon dates and analytical time steps. The 86 records contain a total of 154 reconstructions of temperature and temperature-related variables. Main proxies include pollen and dinocysts, while summer was the season for which the highest num-ber of reconstructions were available. Many records covered most of the Holocene, but many dinocyst records did not extend to the surface, due to sediment mixing, and dendroclimate records were limited to the last millennium. The database allows for the exploration of linkages between sea ice and climate and may be used in conjunction with other palaeoclimate and palaeoenvironmental records, such as wildfire records and peatland dynamics. This inventory may also aid the identification of gaps in the geographic distribution of past temperature records thus guiding future research efforts.
K E Y W O R D S
1
|
INTRODUCTION
Long-term climate records provide a context for the inter-pretation of recent environmental changes. Such records are particularly valuable at high latitudes of the Northern Hemisphere as recent and ongoing climate warming is most pronounced there (Screen and Simmonds, 2010). The Quaternary climate dynamics have been intensively studied in north-east North America and the adjacent Atlantic Ocean, but the ensemble of terrestrial and marine records from this vast region have never been aggregated and presented as a co-herent source of information. Here, we present a database of climate records that covers the eastern Canadian Arctic and Greenland in addition to the boreal and temperate regions of north-east North America and the north-west North Atlantic, which include some of the records presented by Sundqvist
et al. (2014). Climate reconstructions are generally obtained
from sediment cores by the analysis of past assemblages of fossilized organisms and isotope data combined with chronol-ogies established by radiometric dating methods, such as 14C. Other sources include tree rings and ice core characteristics. The climate reconstructions presented here include variables directly related to air temperature, such as lake and sea sur-face temperature as well as sea ice cover, representing an in-direct indicator of temperature.
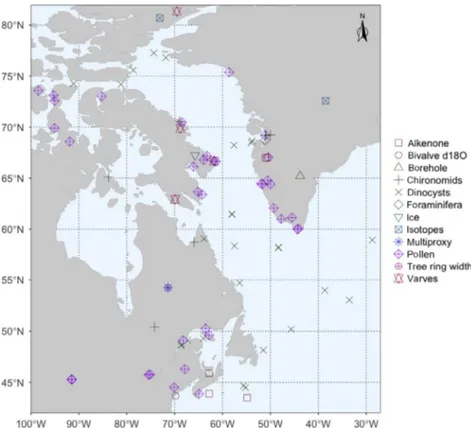
The geographic extent of the database is 43.5–81.4°N and 28.7–98.5°W, covering the north-west Atlantic, including the Labrador Sea and Baffin Bay, eastern Canada and part of the north-east USA. The region is influenced by outflow from the Arctic to the North Atlantic through Canadian Arctic Archipelago, the Baffin Bay and the Labrador Sea and by the relative proximity of the Greenland Ice Sheet, meltwater discharge and sea ice dynamics in adjacent seas as well as weather patterns over the continent (Vavrus et al., 2017).
2
|
DATA PRODUCTION
METHODS
Data were compiled from existing databases, published sci-entific papers and theses. Besides personal archives and con-tributions, NOAA’s Paleoclimatology database was explored as a source of data. Representing a high diversity in study sites and indicators, the publications cover a period of several decades and were generated by a great diversity of research-ers, and therefore, the methodologies to obtain reconstruc-tions are highly diverse.
During the Holocene, a major part of the terrestrial sec-tions of the region remained covered by the Laurentide Ice Sheet for extended periods (Dyke and Prest, 1987; Dyke
et al., 2002; Tarasov and Peltier, 2004), limiting the length of
the palaeoclimate records. As a result, the period of interest
included any part of the Holocene and records covering only a subsection of this period were not excluded. In order to be included in the dataset, records further needed to present di-rect or indidi-rect linkages with atmospheric temperature. For marine sites, the dataset was limited to sea surface tempera-ture and measures of the duration of sea ice cover; air or lake temperature records were included for terrestrial sites. The records may present annual, seasonal or monthly averages, and any analytical time step was allowed. Therefore, the di-versity of the records in terms of time span, analytical resolu-tion and chronological control is high. We aimed to provide detailed metadata in order for the user to identify appropriate records for intended use, applying specific terms to describe the data. Each sample site presents one or several records, identified at the indicator level. The metadata table refers to these records, that is to a single file. Each record includes one or several reconstructions of particular variables. For ex-ample, a single dinoflagellate cyst (or dinocyst) record may include reconstructions of both sea surface temperature and sea ice cover (e.g. Ledu et al., 2010). When available, tem-perature reconstructions also include the counts or the raw data records on which they were based.
2.1
|
Data updates
2.1.1
|
Calibration of dinocyst assemblages
Among data from marine sediment cores based on dinocysts, 23 records were re-calibrated thus representing an update of the previously published articles, following the crea-tion of a new modern analogue dinocyst dataset (de Vernal
et al., 2019) since the original publication (de Vernal et al.,
2001). The records based on the other indicators were not re-calibrated.
2.1.2
|
Age-depth modelling and
chronologies
New age-depth models were created for seven records, using the Bacon package (Blaauw and Christen, 2011) in R (R Core Team, 2016), which provided uncertainty estimates for each depth value, along with best age estimates, based on the mean value of a multitude of iterations. Creation of new models was motivated by the fact that for some records, the original chronologies were not preserved and only the dated sample information remained.
The mean analytical time step of each record was calcu-lated by dividing the number of years separating the first and the last sample of the sequence by the number of samples analysed, minus one.
2.2
|
Data details
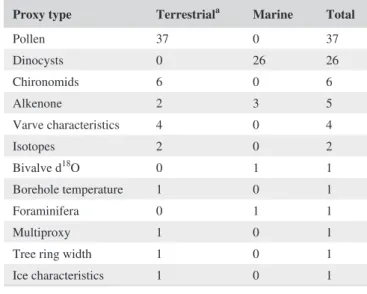
The database presented includes 86 records, of which 55 are terrestrial and 31 marine (Figure 1). The 31 marine records are all based on core sections, and the terrestrial sites include records from lake sediments (46), ice (4), peat (3) and tree rings (2). The most frequently used indicators are pollen (37 records) and dinocysts (26 records); other indicators include chironomids, alkenones, varve characteristics and isotopes (Table 1). In total, the database comprises 154 temperature and temperature-related records.
Temperature records are available for summer, winter and annually, with the seasons defined by one, or several months (Figure 2). A total of 77 summer temperature records are in-cluded, 56 records of annually averaged conditions and 21 representing winter conditions.
2.2.1
|
Chronological coverage and
analytical time step
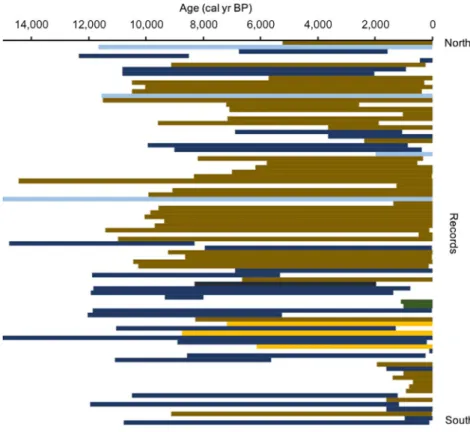
The chronological coverage is relatively uniform along the latitudinal extent (Figure 3). Most lake records start in the early Holocene and have a continuous coverage to the present; many of the northernmost sites present complete Holocene records, despite the proximity of the Laurentide Ice Sheet. Several marine records do not extend to the pre-sent, mainly due to sediment mixing or missing chronologies. Dendroclimatological records are limited to the last millen-nium before present. Generally, modelled chronologies do
not extend beyond the deepest dated sample, as extrapolat-ing chronological models may be hazardous (Blaauw and Heegaard, 2012) because sediment accumulation processes are not stable in time. As a result, several records do not pre-sent age data for one or multiple samples at the bottom of the sequence.
Chronological uncertainties are available for a minority of sites. The median analytical time step is 127 years, with 15 records, mostly shorter and sampled from lakes and tree rings, having a mean time step of less than 20 years and one pollen record attaining 817 years. Varves and tree ring re-cords had a one-year time step.
2.2.2
|
Reconstruction uncertainties
A measure of uncertainty in the records is available for 61 records. Of these, 30 present a measure of the variability in analogues used to infer the reconstruction. For 24 records, the standard deviation of the mean is used, with a few re-maining records presenting similar measures, such as stand-ard errors, confidence intervals or the root mean square errors of prediction. In 25 cases, no measure of uncertainty is available.
The variations in uncertainty measures are related to the statistical methods used to infer reconstructions. It should be noted that the uncertainty is only associated with the statisti-cal method of converting the assemblage data (e.g. pollen or dinocysts) into a climate record. It does not account for any errors related to taxonomy, any misidentification of taxa or
FIGURE 1 Localization of records presented
possible counting or compilation errors. A majority of pollen records, 24 out of the 37 records presented, have uncertainty expressed as the standard deviation of the mean inferred value of the most similar samples using the modern analogue technique. The average of the mean standard deviation for these records of July temperature is 1.2°C. Five records used
the minimum and maximum values of the analogues as a measure of the uncertainty. Dinocyst record uncertainties of modern analogue-based estimates were defined by the min-imum and maxmin-imum nearest corresponding analogues. The error of prediction estimated based on validation exercises is 1.7°C and 1.2°C for summer and winter sea surface tempera-tures, respectively.
3
|
DATASET LOCATION AND
FORMAT
The dataset is available at PANGAEA (https://www.panga ea.de/). It is composed of a metadata table, each line of which refers to a record with a single identification. Each record is presented in a separate file, containing at least one reconstruc-tion and a chronology, and in some cases depths. Addireconstruc-tional variables include sample depth along the core, chronological and reconstruction uncertainties and assemblages on which the reconstructions were based.
4
|
DATASET USE AND REUSE
The database will be used to explore linkages between sea ice and climate. In addition, it allows for the evaluation of TABLE 1 Number of different proxy types, and the number of
records represented per site type
Proxy type Terrestriala Marine Total
Pollen 37 0 37 Dinocysts 0 26 26 Chironomids 6 0 6 Alkenone 2 3 5 Varve characteristics 4 0 4 Isotopes 2 0 2 Bivalve d18O 0 1 1 Borehole temperature 1 0 1 Foraminifera 0 1 1 Multiproxy 1 0 1
Tree ring width 1 0 1
Ice characteristics 1 0 1
aLakes included.
FIGURE 2 Dataset structure showing linkages between archives, indicators and reconstructed variables. Numbers represent the number of reconstructions available
trends in summer and winter temperature for both terrestrial and marine environments and it will aid the interpretation of other palaeoclimate and palaeoenvironmental records avail-able or to be created, such as wildfire records and peatland dynamics. Finally, this inventory may aid the identification and evaluation of gaps in the current geographic distribu-tion of palaeotemperature records and therefore guide future research efforts towards specific regions that may need in-creased coverage.
ACKNOWLEDGEMENTS
The research presented in this paper was funded by Fonds de Recherche du Québec (FRQ), the Fonds de Recherche du Québec Nature et Technologie (FRQNT) and complementary funds from the Natural Sciences and Engineering Research Council (NSERC) of Canada and the Social Sciences and Humanities Research Council (SSHRC) of Canada. The authors are grateful to all exter-nal contributors.
ORCID
Simon van Bellen https://orcid.
org/0000-0002-1698-8530
Anne de Vernal https://orcid.org/0000-0001-5656-724X
Marie-Michèle Ouellet-Bernier https://orcid.
org/0000-0002-8776-2723
Natasha Roy https://orcid.org/0000-0003-4853-6851
REFERENCES
Blaauw, M. and Christen, J. (2011) Flexible paleoclimate age-depth models using an autoregressive gamma process. Bayesian Analysis, 6, 457–474. https://doi.org/10.1214/ba/13396 16472
Blaauw, M. and Heegaard, E. (2012) Estimation of age-depth rela-tionships. In: Birks, H.J.B., Lotter, A.F., Juggins, S. and Smol, J.P. (Eds.) Tracking Environmental Change Using Lake Sediments: Data
Handling and Numerical Techniques. Dordrecht, the Netherlands:
Springer, pp. 379–413.
Dyke, A. and Prest, V. (1987) Late Wisconsinan and Holocene history of the Laurentide ice sheet. Géographie Physique et Quaternaire, 41, 237–263. https://doi.org/10.7202/032681ar
Dyke, A., Andrews, J., Clark, P., England, J., Miller, G., Shaw, J. et al. (2002) The Laurentide and Innuitian ice sheets during the Last Glacial Maximum. Quaternary Science Reviews, 21, 9–31. https:// doi.org/10.1016/S0277 -3791(01)00095 -6
Ledu, D., Rochon, A., de Vernal, A., Barletta, F. and St-Onge, G. (2010) Holocene sea ice history and climate variability along the main axis of the Northwest Passage, Canadian Arctic. Paleoceanography, 25, PA2213. https://doi.org/10.1029/2009P A001817
R Core Team (2016) R: A Language and Environment for Statistical
Computing. Vienna, Austria: R Foundation for Statistical Computing.
Screen, J. and Simmonds, I. (2010) The central role of diminishing sea ice in recent Arctic temperature amplification. Nature, 464, 1334– 1337. https://doi.org/10.1038/natur e09051
Sundqvist, H., Kaufman, D., McKay, N., Balascio, N., Briner, J., Cwynar, L. et al. (2014) Arctic Holocene proxy climate database - new approaches to assessing geochronological accuracy and encod-ing climate variables. Climate of the Past, 10, 1605–1631. https:// doi.org/10.5194/cp-10-1605-2014
FIGURE 3 Dataset structure showing record coverage and type. Dark blue = marine; light blue = ice; brown = lake sediments; yellow = peat; green = tree rings. Record are sorted from North to South
Tarasov, L. and Peltier, W. (2004) A geophysically constrained large en-semble analysis of the deglacial history of the North American ice-sheet complex. Quaternary Science Reviews, 23, 359–388. https:// doi.org/10.1016/j.quasc irev.2003.08.004
Vavrus, S., Wang, F., Martin, J., Francis, J., Peings, Y. and Cattiaux, J. (2017) Changes in North American atmospheric circulation and extreme weather: influence of Arctic amplification and Northern Hemisphere snow cover. Journal of Climate, 30, 4317–4333. https:// doi.org/10.1175/JCLI-D-16-0762.1
de Vernal, A., Henry, M., Matthiessen, J., Mudie, P., Rochon, A., Boessenkool, K. et al. (2001) Dinoflagellate cyst assemblages as tracers of sea-surface conditions in the northern North Atlantic, Arctic and sub-Arctic seas: the new ‘n = 677’ data base and its appli-cation for quantitative palaeoceanographic reconstruction. Journal
of Quaternary Science, 16, 681–698. https://doi.org/10.1002/jqs.659
de Vernal, A., Radi, T., Zaragosi, S., Van Nieuwenhove, N., Rochon, A., Allan, E. et al. (2019) Distribution of common modern dinocyst taxa in surface sediments of the Northern Hemisphere in relation to environmental parameters: the new n=1968 database. Marine
Micropaleontology, in press. https://www.scien cedir ect.com/scien
ce/artic le/pii/S0377 83981 9300441
How to cite this article: van Bellen S, de Vernal A,
To A, Ouellet-Bernier M-M, Roy N; ClimHuNor Members. A database of Holocene temperature records for north-eastern North America and the north-western Atlantic. Geosci Data J. 2020;00:1–6.
https://doi.org/10.1002/gdj3.89
APPENDIX
E Allan, R Audet, E Boucher, C Brice, G Dueymes, J Falardeau, T Fichefet, M Fillion, B Fréchette, P Gachon, M Garneau, G Gilson, H Goosse, C Hillaire-Marcel, N Houde, R Laprise, N Ogden, M Saint-Arnaud, B Tremblay, S Vanwambeke, H Wazneh, J-P van Ypersele