STUDY OF SOME FACTORS INFLUENCING BIODEGRADATION OF
ISOPROPYLBENZENE BY RHODOCOCCUS ERYTHROPOLIS
Jean-Marc Aldric1, Jaqueline Destain1, and Philippe Thonnart 1
(1) Faculté Universitaire des Sciences Agronomiques de Gembloux, Unit of Bioindustries, Centre Wallon de Biologie
Industrielle - Belgium – Bioindus@fsagx.ac.be
KEYWORDS
VOLATILS – ORGANICS-COMPOUNDS; BIODEGRADATION; BIOREACTOR
ABSTRACT
THE PRESENT STUDY EXAMINES THE EFFECT OF VARIOUS FACTORS ON THE BIODEGRADATION OF IPB BY RHODOCOCCUS ERYTHROPOLYS. BY THE IMPLEMENTED PLAN OF PLACKETT AND BURMAN, A POSITIVE EFFECT OF IRON, NEUTRAL pH AND ETHANOL ON THE BIODEGRADATION COULD BE DEMONSTRATED. COMPLEMENTARY EXPERIMENTS IN A BIOREACTOR SHOW THAT ETHANOL, USED AS COSUBSTRATE IN BUFFERED MEDIUM, ALLOWS CELL GROWTH WHILE OPTIMIZING BIODEGRADATION OF IPB.
INTRODUCTION
A research is carried out within the framework of gaseous treatment. It aims to develop a biphasic reactor "water / silicon- oil ". Silicon-oil will be used to allow a better biological abatement of the aromatic organic compounds by improving their solubility within the biphasic reactor. Initially a bacterial strain (Rhodococcus erythropolis T 902.1 ) was selected on the basis of its good capacity to degrade isopropyl-benzene (IPB), compound selected as model such as Benzene, Toluene and Xylene.
Few studies are carried out with the objective to improve the conditions of degradation.
However, some factors can affect the biodegradation of volatile organic compounds (VOC). Indeed the biodegradation of VOCs by Rhodococcus is performed via the dioxygenases allowing the oxidation of the VOC. The crystal structure of dioxygenase has confirmed the presence of Rieske cluster {2Fe–2S} (Gibson. D and Parales R., 2000; Wackett; 2002). The complementary presence of iron should thus play a positive role in the biodegradation. Moreover the ethanol contributes to regenerate coenzymes NAD+ in NADH (Hay, 2000; Maugard et al., 2000). It is also well-known that the pH plays a significant role on enzymatic action. In addition, a positive effect of Ni and Zn on the biodegradation was shown by Amor et al., 2000.
The purpose of this work is to examine the influence of a number of factors on the biodegradation.
MATERIALS AND METHODS
Biological material
The Rhodococcus erythropolis strain was obtained from the collection of the Walloon Center of Industrial Biology (C.W.B.I.).
All the substrates and other chemicals were purchased at VWR internationnal or Aldrich.
Bioreactor
The bioreactor used (Biolafitte BL06.1) and the composition of the two-phase medium were described by Aldric (2001).
Headspace Chromatography
The chromatographic analysis was carried out with a system of sampling in headspace Perkin Elmer sampler HS40 XL coupled with a Gaz Chromatograph Perkin Elmer XL. The chromatographic column used is: Altech Inc Deerfield EC-Wax. The used method was described by Aldric (2001).
Statistical method
In order to determine the influence of chosen parameters for this study, the Plackett and Burman statistical method (1946) was implemented.
RESULTS AND DISCUSSIONS
Evaluation of influence of some factors able to influence biological abatement of IPB
The influence of 10 physiologic factors was evaluated by the statistical method described by Plackett and Burman (1946). The studied factors and their respective level are shown in table 1. Table 2 shows the implemented plan P&B.
Table 1: Studied factors and their respective level Table 2: Plan described by Plackett and Burman
In order to have only one source of carbon for each studied flask, a plan P&B was carried out for each source of carbon. The corresponding results are shown in figures 1 to 4.
Fig 1. Calculated principal effects of the factors compared with the statistical limit of significance (dotted lines). Plan corresponding to glycerol as complementary source of carbon.
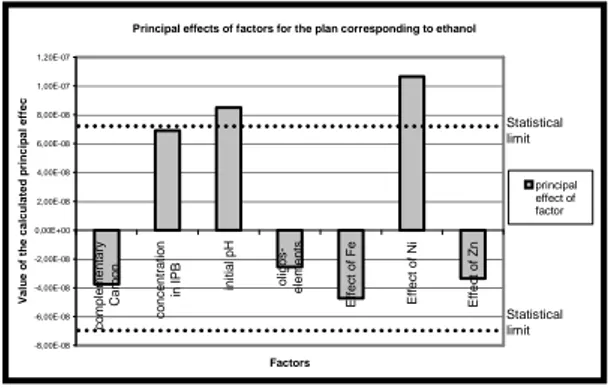
Fig 2. Calculated principal effects of the factors compared with the statistical limit of significance (dotted lines). Plan corresponding to ethanol as complementary source of carbon.
Factors Experiment 1 Source of carbon 2 IPB 3 pH 4 Solution of oligo-elements 5 Fe 6 Ni 7 Zn 1 1 1 1 -1 1 -1 -1 2 -1 1 1 1 -1 1 -1 3 -1 -1 1 1 1 -1 1 4 1 -1 -1 1 1 1 -1 5 -1 1 -1 -1 1 1 1 6 1 -1 1 -1 -1 1 1 7 1 1 -1 1 -1 -1 1 8 -1 -1 -1 -1 -1 -1 -1 Level « low » Level « intermediate » Niveau « high » Factors 1 Glycérol 0,1 g/l 1g/l 1,9 g/l 2 Ethanol 0,1 g/l 1g/l 1,9 g/l 3 Starch 0,1 g/l 1g/l 1,9 g/l 4 Dextrose 0,1 g/l 1g/l 1,9 g/l 5 pollutant (IPB) 0,1 g/l 1g/l 1,9 g/l 6 pH 6 6,5 7 7 Solution of oligo-éléments 0,5ml/l 1ml/l 1,5 ml/l 8 Fer II 0,01 mM 0,05 mM 0,99mM 9 Ni 0,01mM 0,05 mM 0,99mM 10 Zn 0,01mM 0,05 mM 0,99mM
Principal effects of factors for the plan corresponding to ethanol
-8,00E-08 -6,00E-08 -4,00E-08 -2,00E-08 0,00E+00 2,00E-08 4,00E-08 6,00E-08 8,00E-08 1,00E-07 1,20E-07 c o m p le m e n ta ry C a rb o n c o n c e n tr a ti o n in I P B in it ia l p H o lig o s -e le m e n ts E ff e c t o f F e E ff e c t o f N i E ff e c t o f Z n Factors V a lu e o f th e c a lc u la te d p ri n c ip a l e ff e c t principal effect of factor Statistical limit Statistical limit
Principal effect of factor for the plan corresponding to amidon
-1,50E-07 -1,00E-07 -5,00E-08 0,00E+00 5,00E-08 1,00E-07 1,50E-07 c o m p le m e n ta ry C a rb o n c o n c e n tr a ti o n in I P B in it ia l p H o lig o s -e le m e n ts E ff e c t o f F e E ff e c t o f N i E ff e c t o f Z n Factors V a lu e o f th e c a lc u la te d p ri n c ip a l e ff e c t Principal effect of factor Statistical limit Statistical limit
Fig 3. Calculated principal effects of the factors compared with the statistical limit of significance (dotted lines). Plan corresponding to amidon as complementary source of carbon.
Principal effect of factor for the plan corresponding to dextrose
-8,00E-08 -6,00E-08 -4,00E-08 -2,00E-08 0,00E+00 2,00E-08 4,00E-08 6,00E-08 c o m p le m e n ta ry C a rb o n c o n c e n tr a ti o n in I P B in it ia l p H o lig o s -e le m e n ts E ff e c t o f F e E ff e c t o f N i E ff e c t o f Z n Factors V a lu e o f th e c a lc u la te d p ri n c ip a l e ff e c t
Principal effect of factor Statistical limit
Statistical limit
Fig 4. Calculated principal effects of the factors compared with the statistical limit of significance (dotted lines). Plan corresponding to dextrose as complementary source of carbon.
Principal effects of factors for the plan corresponding to glycerol
-6,00E-08 -4,00E-08 -2,00E-08 0,00E+00 2,00E-08 4,00E-08 6,00E-08 c o m p le m e n ta ry C a rb o n c o n c e n tr a ti o n i n IP B in it ia l p H o lig o s -e le m e n ts E ff e c t o f F e E ff e c t o f N i E ff e c t o f Z n Factors v a lu e o f th e c a lc u la te d p ri n c ip a l e ff e c t principal effect of factors Statistical limit Statistical limit
According to the results, no statistically representative influence of the concentration in carbonaceous cosubstrat could be established. The same conclusions are drawn for the effect of Ni and Zn.
On the other hand, a neutral pH seems to have a positive role on the biodegradation of IPB. Finally, two experiments revealed that iron presents a positive effect on the biodegradation when its concentration is increased until 1mM
The only clearly negative influence is obtained for the complementary addition of solution « oligo-elements ».
In order to determine the optimal type of cosubstrate, the IPB’s biodegradation was followed for the 4 types of above mentioned carbonaceous sources (Fig. 5).
Kinetic assay of biological abatement of IPB by Rhodococcus erythropolis into biological-reactor
In order to characterize the biodegradation of IPB by Rhodococcus, the experiments were carried out with a bioreactor of 6 l (Biolafitte). IPB is inoculated within the bioreactor and we have followed the concentration of IPB in the bioreactor, the concentration of cosubstrate, the evolution of pH and the evolution of cellular concentration. In order to standardize methodology and invariable the losses by stripping, all the experiments in bioreactor were carried out with an air flow of 2,5 l/min and a speed of the mobile of 600 RPM.
Kinetic abatement of IPB
The first experiments correspond to abatement of IPB in the bioreactor without addition of nitrogenized and phosphorated solution. Thus, experiences A and B (Fig. 6) respectively correspond to an inoculation of 500 ppm and 1000 ppm of IPB with an initial concentration of dextrose of 1000ppm. Experiences C and D correspond to an inoculation of 500 ppm of IPB with an initial
concentration of dextrose of 1000ppm, 200 ppm of NH4+ and 60 ppm of PO4---. After 50 Hours, IPB,
NH4+ and PO4---. were inoculated again in the two experiments while in experiment D, 1 g/l of dextrose is also again inoculated. These results show that cosubstrate isn’t essential for the biodegradation of IPB by Rhodococcus. Moreover, biodegradation is better in absence of dextrose.
0,00E+00 5,00E-08 1,00E-07 1,50E-07 2,00E-07 2,50E-07 3,00E-07 3,50E-07 4,00E-07 4,50E-07 5,00E-07
Glycerol Ethanol Glucose Amidon
type of cosubstrate s p e c if ic r a te o f d e g ra d a ti o n ( % b io d e g ra d a ti o n /U F C )
Fig 5 Specific rate of degradation observed for the 4 types of cosubstrate. The level of all the other factors being fixed has their intermediate rate.
The most significant rate of specific biodegradation is obtained by using ethanol as cosubstrate. On the other hand, the use of dextrose as cosubtrate generates the low rate of biodegradation. This can be explained by the best regeneration of coenzymes by using ethanol while the use of dextrose leads to a preferential use of this last by Rhodococcus. Glycerol and starch generate an intermediate rate of biodegradation.
In order to summarize obtained results of biodegradation, we calculated the rates of elimination of IPB for each experiment (Table 1).
Fig 6: Evolution of the IPB concentration within a reactor inoculated with 500 ppm of IPB (Exp A) and with 1000 ppm of IPB (exp B).
Fig 7: Evolution of IPB concentration within a reactor inoculated with 500 ppm of IPB. IPB is inoculated again after approximately 50 H of culture. Experiment C only contains the initial dextrose inoculation while in experiment D, 1 g/l of dextrose is inoculated again after 50 H of culture
0 100 200 300 400 500 600 700 800 900 1000 0 10 20 30 40 50 60 70 80 90 Time (H) C o n c e n tr a ti o n o f IP B exp E exp F exp G
Fig 8: Evolution of IPB concentration within a reactor inoculated with 500 ppm of IPB. IPB is inoculated again after approximately 50 H of culture. Experiment E, F and G correspond to ethanol addition as co-substrate. Mediums of experiment F and G are buffered to pH 7.
Experiments E, F and G correspond to use of ethanol as cosubstrate (1 g/L) which is inoculated again after 50H culture. The pH of experiment E is not buffered but experiments F and G are buffered to 7. Results show that the use of ethanol as cosubstate generates better biodegradation of IPB relatively to dextrose. Secondly, biodegradation in buffered medium (ExpF and G) pH 7 is slightly better compared to a non-buffered medium (ExpE).
The calculated rates of elimination show that the biomass adapts itself to the presence of IPB inducing better biodegradation when IPB is inoculated again. Moreover, the calculated rates confirm the best biodegradation of the IPB in the presence of ethanol (Exp F and G) improving the
regeneration of the coenzymes NAD+ to NADH.
Table 1 : Comparative of the rates of elimination of IPB for various study conditions
Experiment Average rates of elimination of the IPB during the first
biodegradation ( ppm / h )
Average rates of eliminat ion of the IPB during the second
biodegradation ( ppm / h ) Exp A and B 11 ,63 -Exp C 17,23 50,39 Exp D 8,9 11,79 Exp E 17, 14 22, 55 Exp F 27,605 31,493 Exp G 27,249 32, 428 0 100 200 300 400 500 600 700 800 900 1000 0 20 40 60 80 100 120 Time ( hours) C o n c e n tr a ti o n o f IP B ( p p m ) 500 ppm ( exp A ) 1000 ppm ( exp B) 0 100 200 300 400 500 600 700 800 900 1000 0 10 20 30 40 50 60 70 80 90 Time (H) C o n c e n tr a ti o n o f IP B exp C exp D
Kinetic consumption of the cosubstrate
Complementarily to the kinetics of biodegradation of IPB, the kinetics of consumption of cosubstrates were also followed for all the above mentioned experiments. For the experiments A and B (results not shown ), one single initial dextrose inoculation (1 g/l) was carried out.
The entirety of dextrose isn’t consumed, concentration in the medium is indeed stabilized with approximately 0,45 g/l. This can be explained by the absence of nitrogenized and phosphorated solution in the reactional medium.
The experiments C and D show that dextrose is entirely consumed when the nitrogenized and phosphorated solution is added. Moreover, these results show a parallel consumption of the pollutant and cosubstrate. Identical conclusions can be drawn for the use of ethanol as cosubstrate (results not shown). However, the consumption of ethanol is a little faster in buffered medium.
Evolution of the cellular concentration during the biodegradation
The experiments were carried out for a limited time. For that reason, it is significant to follow the evolution of the cellular concentration since it is the biomass which allows the biodegradation of VOCs. 1,00E+04 1,00E+05 1,00E+06 1,00E+07 1,00E+08 1,00E+09 0 10 20 30 40 50 60 70 80 90 Time ( H ) U F C Exp D Exp B Exp E Exp F Exp G
Fig. 10 Evolution of the cellular concentration during the biodegradation for experiments A to G
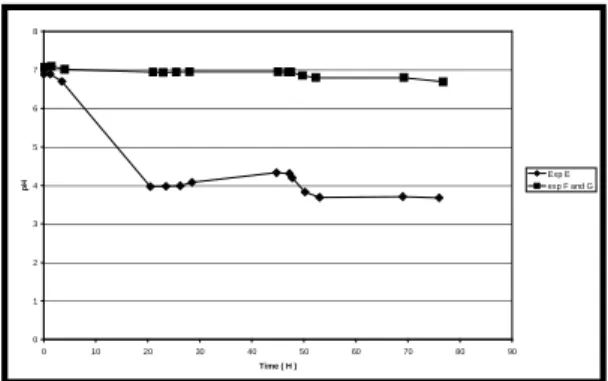
0 1 2 3 4 5 6 7 8 0 10 20 30 40 50 60 70 80 90 Time ( H ) p H Exp E exp F and G
Fig. 9: Evolution of the pH during the biodegradation Evolution of pH during biodegradation of IPB
Evolution of pH was also followed for each experiment (Fig. 9). As observed in the experiment D, the use of dextrose as cosubstrate doesn’t generate significant acidification of the buffered medium M 284 (Tris-HCl 50mM). On the other hand, the use of ethanol as cosubstrate generates a strong acidification of the medium due to the acetic- acid production by oxidation
of ethanol (Exp E,). The use of a
complementary phosphates-buffer ( Na2HPO4 /
NaH2PO4, 25mM) allows to maintain the pH at
the initial level (pH = 7 ; Exp F and G).
The obtained results (fig. 10) show that the use of a cosubstrate is necessary to maintain the cellular concentration. Indeed, the use of
dextrose without secondary inoculation
generated a strong decrease of the cellular concentration (Exp A and B). The secondary dextrose inoculation allows a new cell growth (Exp D). The use of ethanol in non-buffered medium by phosphates-buffer allows keeping the cellular concentration on its initial level (Exp. E). Lastly, the use of ethanol correlated with the use of a phosphates-buffer (25 mM) generates cell growth after a little cellular decrease.
CONCLUSIONS
The possibility of degrading the IPB by Rhodococcus erythropolis was demonstrated. Positive effect of iron and neutral pH on the biodegradation can be suggested.
The adaptation of the biomass to the presence of the IPB is also shown by all the experiments. The use of a cosubstrate is not necessary for the biodegradation but the carbonaceous cosubstrate is useful to maintain the cellular concentration into the bioreactor. The ethanol is the best cosubstrate since it allows maintaining the cellular concentration and regeneration of the coenzymes. However the use of ethanol as cosubstrate must be combined with the use of a buffered-medium (Phosphates-Buffer) to improve the biodegradation and the cell growth.
REFERENCES
Aldric J.M. (2001). Contribution à la mise au point d’un réacteur biphasique destiné à la dégradation des composés organiques volatiles par voie biologique. Mémoire de fin d’études présenté en vue de l’obtention du diplôme d’études approfondies en sciences agronomiques et ingénierie biologique. Faculté Universitaire des Sciences Agronomiques de Gembloux. 75 p.
Gibson T.D. and Parales R.E. (2000). Aromatic hydrocarbon dioxygenase in environmental biotechnology. Current opinion in biotechnology. 11, 236 – 243.
Hai Y., Michimasa K., Takeshi O., Yoshio K., Ken-ichi S., Koichi O., Osamu Y. (2000). Increase in Desulfrization Activity of Rhodococcus erythropolis KA2-5-1 Using Ethanol Feeding. Journal of Bioscience and Bioengineering. Vol. 89, No 4, 361-366.
Maugard T. ; Lamare S. ; Legoy M-D (2001)Gaz. phase biotransformation reaction catalysed by baker’yeast. BBA Prot. Struct. Mol. Enzymol 1387 : 177 – 183
Plackett, R. L. and Burman, J. P. (1946). The Design of Optimum Multifactorial Experiments, Biometrica 33, 305-325.
Wackett L-P (2002) Mechanism and applications of Rieske non-heme iron dioxygenases. Enzyme and microbial technology. 31 577-587.