A treatment planning inter-comparison of proton and intensity modulated
photon radiotherapy
Antony J. Lomax
a,*, Thomas Bortfeld
b, Gudrun Goitein
a, Juergen Debus
b, Christine Dykstra
c,
Pierre-Alain Tercier
d, Philippe A. Coucke
e, Rene O. Mirimanoff
eaDepartment of Radiation Medicine, The Paul Scherrer Institute, CH-5200, Villigen PSI, Switzerland bForschungsschwerpunkt Radiologie, Deutsches Krebsforschungszentrum, Heidelberg, Germany
cSchool of Computing Science, Simon Fraser University, Vancouver, Canada dInstitute of applied Radiophysics, Lausanne, Switzerland
eDepartment of Radio-oncology, University Hospital of Lausanne, CHUV, Lausanne, Switzerland
Received 13 May 1998; received in revised form 12 December 1998; accepted 14 January 1999
Abstract
Purpose: A comparative treatment planning study has been undertaken between standard photon delivery techniques,b intensity modu-lated photon methods and spot scanned protons in order to investigate the merits and limitations of each of these treatment approaches.
Methods: Plans for each modality were performed using CT scans and planning information for nine patients with varying indications and lesion sites and the results have been analysed using a variety of dose and volume based parameters.
Results: Over all cases, it is predicted that the use of protons could lead to a reduction of the total integral dose by a factor three compared to standard photon techniques and a factor two compared to IM photon plans. In addition, in all but one Organ at Risk (OAR) for one case, protons are predicted to reduce both mean OAR dose and the irradiated volume at the 50% mean target dose level compared to both photon methods. However, when considering the volume of an OAR irradiated to 70% or more of the target dose, little difference could be shown between proton and intensity modulated photon plans. On comparing the magnitude of dose hot spots in OARs resulting from the proton and IM photon plans, more variation was observed, and the ranking of the plans was then found to be case and OAR dependent.
Conclusions: The use of protons has been found to reduce the medium to low dose load (below about 70% of the target dose) to OARs and all non-target tissues compared to both standard and inversely planned photons, but that the use of intensity modulated photons can result in similar levels of high dose conformation to that afforded by protons. However, the introduction of inverse planning methods for protons is necessary before general conclusions on the relative ef®cacy of photons and protons can be drawn. q 1999 Elsevier Science Ireland Ltd. All rights reserved.
Keywords: Proton therapy; Intensity modulated pholon radiotherapy; Comparative treatment planning
1. Introduction
Since the widespread introduction of computer tomo-graphic (CT) scanners and other three-dimensional (3D) imaging modalities, treatment planning has become an increasingly important aspect of radiotherapy. In many ways, progress in planning technology has run in parallel with, and in some cases has been the driving force behind, many of the advances in delivery hardware that are now entering clinical use. These advances mainly have the aim of improving delivery methods such that the high dose volume approaches the volume of the clinical target, thus reducing unnecessary dosage to healthy tissues. Such highly
conformal methods are now gaining acceptance in the clin-ical environment and in the near future are likely to become the routine treatment method for many indications.
Many of the proposed methods for improved localisation of the high dose volume centre either on the use of sophis-ticated planning and delivery methods and/or on the use of radiations which show improved dose localisation char-acteristics. In mega-voltage X-ray therapy, the use of asym-metric and dynamic wedges, irregularly shaped ®elds (i.e. using customised blocks or multi-leaf collimators) and the delivery of non-uniform intensity pro®les of the incident radiation using compensators have all contributed to reducing the treated volume. In parallel with these develop-ments, treatment planning systems have become corre-spondingly more elaborate, providing the radiation
oncol-0167-8140/99/$ - see front matter q 1999 Elsevier Science Ireland Ltd. All rights reserved. PII: S0167-8140(99)00036-5
ogist with many options for conforming the dose in three dimensions.
With the number of degrees of freedom now available in the planning of radiation therapy, it is perhaps inevitable that great interest is being shown in the optimisation of treatment plans. In recent years, such techniques have been used in the calculation of beam weights [30,35], for determination of wedge angles using dynamic wedges [42] or for the selection of beam directions [5,16]. However, perhaps the most promising of the optimisation techniques are that group which aim to modulate the cross-®eld ¯uence of the applied beams [4,17,20,38,39,50].
One of the early attempts at reducing treatment volumes came with the use of protons in radiotherapy, as proposed by Wilson [51]. Wilson recognised the clear physical advan-tage of the proton depth-dose characteristic over that of a photon beam, and this was used as the rationale to treat patients with protons beginning around the early 1960s. By the end of 1997, over 24 000 patients had been treated using protons at 21 sites world-wide, the majority at Massa-chusetts General Hospital using the original Harvard Cyclo-tron [44]. For the treatment of deep seated tumours with protons, all the currently operational facilities use the so called passive scattering method [3,22,23] that was ®rst developed at the Harvard Cyclotron. More recently, however, some groups have proposed the use of scanned particle beams for dynamic delivery [21,40], which can both improve dose conformation [48] and has the potential to deliver non-uniform ®elds in three-dimensions [9,28].
A body of literature predicts that the use of protons in some cases can provide considerable improvements in dose conformation when compared to conventional X-ray deliv-ery methods [24,31±34,45±47]. Such comparative treatment planning studies have commonly been used as a method of evaluating different treatment techniques and modalities (see, e.g. [15,19,36]) as well as in evaluating the usefulness of intensity modulated X-ray therapy in comparison with standard planning techniques and between different optimi-sation regimes [49]. We have previously reported on the results of a treatment planning intercomparison between protons and intensity modulated photons in a single case
of childhood Medulloblastoma [34]. However, to date, detailed comparisons of proton therapy with state-of-the-art intensity modulated X-ray techniques in a number of different sites and indications have not been performed. Here we present the results of a three-way treatment plan-ning inter-comparison between standard photons, intensity modulated photons and protons as applied to a total of nine cases of varying indication and anatomical site.
2. Materials and methods 2.1. Data collection and exchange
Three centres have been involved in the study: the Paul Scherrer Institute (PSI); the University Hospital of Lausanne (CHUV) in Switzerland and the German Cancer Research Centre (DKFZ) in Heidelberg. Each centre provided three cases for evaluation, listed in full with their indications in Table 1. The conversion of planning data between the different planning systems was performed at PSI and all data transfers were made using FTP over internet connections. Volumes of interest (VOIs) were de®ned at the originating institute and both the CT and VOI ®les were distributed to the various centres for plan-ning. All CT data were volumetric, with a maximum slice separation of 5 mm, and VOIs were de®ned in 3D on all the relevant slices. For the sake of simplicity, the target volumes were, in all cases, assumed to include a safety margin, and were thus considered to be planning target volumes as de®ned in ICRU 50 [18]. Three dimensional dose distribu-tions were calculated by each of the planning systems and were collected for evaluation at PSI using an in-house developed plan comparison package [26].
2.2. Planning methods
All standard photon plans were provided by either CHUV, using the DOSIGRAY planning system, or were planned using the VOXELPLAN system at either DKFZ or PSI [1,2]. By routinely available, we refer to the use of a limited number of beam ports, each of which can be
indi-Table 1
List of all the cases, their indications and plan descriptionsa
Case number Indication Photons IMRT photons Protons
1 Meningioma LL,RL,LPO 9 ®elds RL,S
2 Malignant melanoma A,LPO,RAO 9 ®elds A,RL 3 Klatskin tumour LL,RAO,RPO 9 ®elds RAO 4 Metastasising prostate carcinoma A,LL,RL 9 ®elds A
5 Cervix cancer LAO,RAO,LPO,RPO 9 ®elds 2 £ RAO,RPO 6 Chromophobic pituitary adenoma RL,LL,SPO 9 ®elds LL,LAO,SALO 7 Simulated thyroid carcinoma A,RL,LL 9 ®elds LAO,RAO
8 Acinus cellcarcinoma - 9 ®elds A,LL
9 Relapsing medulloblastoma - 9 ®elds P,LAO,LPO,RAO
aFor the photon and proton plans, the following nomenclature to describe ®eld incidences has been adopted: L, lateral; O, oblique; L, left; R, right; A,
vidually shaped but for which the beam intensity is ®xed or is modi®ed only by the use of ®xed or dynamic wedges. Intensity modulated photon treatment plans were optimised using a forerunner of the KonRad inverse planning program developed at DKFZ [4,8,41] which has been investigated dosimetrically [7] and is currently in clinical use at DKFZ, and, in a modi®ed form, at the Memorial Sloan Kettering Cancer Centre [25]. It is based on an iterative steepest descent optimisation technique, which considers
prescribed minimum and maximum dose constraints in the target as well as upper dose limits in organs at risk. DVHs constraints can also be de®ned [8], but this capability has not been used for the present investigation. In addition, so-called penalties are used to control the relative importance of these constraints. The dose is calculated using a simpli-®ed pencil beam algorithm in which the photon scatter kernel is assumed to be invariant with depth (using a simpli-®ed version of the technique described by Bortfeld [6]).
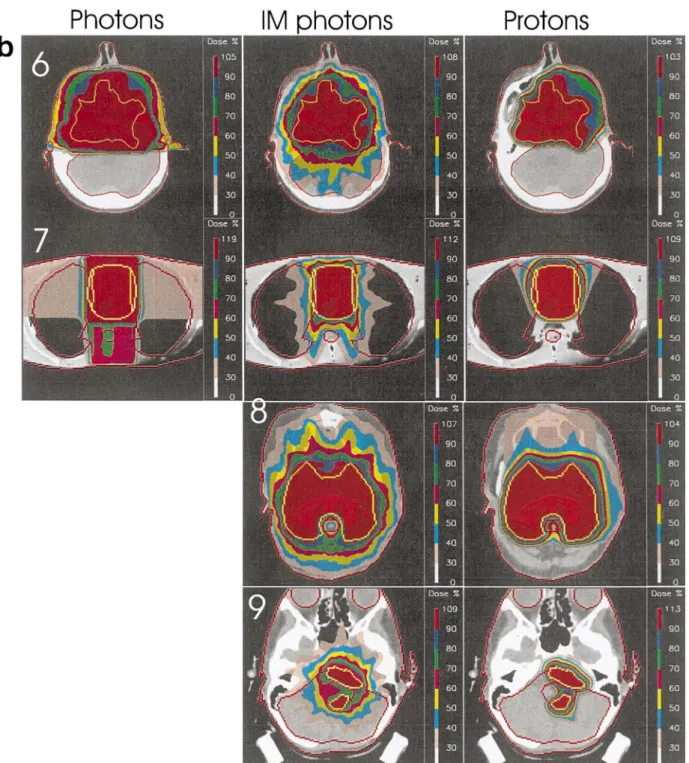
Fig. 1. (a) Central slices from each plan for cases 1±5. (b) Central slices from each plan for cases 6±9. Dose levels are as indicated in the colour bars on the right hand side of each image. Note, for cases 8 and 9, no standard photon plans were performed.
Tissue inhomogeneities can be considered through one-dimensional path length correction, but they are ignored in the present study, which uses an older implementation of the code. Although the inclusion of heterogeneity corrections would certainly alter the resultant IM matrices, we have assumed that the optimisation process would mostly compensate for these effects and we don't expect that the dose distributions would vary signi®cantly from those presented in this paper. For all the cases studied here, IM photon plans were calculated using nine evenly spaced ®eld directions (see Table 1).
All proton plans presented in this paper have been calcu-lated using a treatment planning system developed at PSI speci®cally for the delivery of proton therapy using spot scanning [27,40,43]. Although the clinical advantages of this method over the more widespread passive scattering approach are a matter of debate [14,48], it nevertheless provides the most ¯exible method of particle delivery for conforming the dose in all three dimensions. Dose calcula-tions are performed by taking into consideration all those Bragg peaks, deposited on a 5 mm matrix, which are inside or within 5 mm of the surface of the planning target volume. The relative weights of all these peaks are then calculated using a least squared minimisation technique [27]. However, in contrast to the photon technique, the optimisa-tion for all the proton plans presented here have been performed for individual ®eld directions only and with the single criteria of producing a relatively homogenous (^5± 10%) dose across the target volume. Critical organs are ignored by the optimisation process and multiple ®eld dose distributions were formed by the simple addition of the individually optimised ®elds. Thus, although optimised, the proton plans presented here are not IM plans in the commonly accepted sense of that term, and can more accu-rately be described as having been planned using conven-tional, forward planning techniques. For all the proton dose calculations, in-homogeneities along the beam direction were taken into account and lateral spread was modelled taking into account the effects of the initial phase space of the beam, nozzle-to-patient air gaps and multiple coulomb scattering within the patient.
3. Results
Example slices for each case are shown in Fig. 1a (cases 1±5) and Fig. 1b (cases 6±9). For each case, the standard photon plan is shown on the left, the intensity modulated photon plan in the middle and the proton plan on the right. Descriptions of each plan for each case are shown in Table 1, and the normal tissue constraints of individual OARs used by the IM photon optimisation are shown in Table 4. Note that for cases 8, 9, no standard photon plans have been performed. In all cases, the dose distributions have been normalised to the mean target dose delivered by each plan, and the doses have been coded using the colour
band-ing indicated to the right hand side of each image. The banding levels (as a percentage of the normalisation dose) indicate the transition level from one colour band to the next and in all cases have been equally spaced between 30 and 90% of the normalisation dose. The maximum displayed dose value indicates the maximum dose anywhere within the distribution.
In this section, we will ®rst present a dosimetric summary of all the cases, in the form of target coverage, integral dose estimates and doses to organs at risk (OAR) and follow this with more detailed studies of four cases of particular inter-est.
3.1. General results
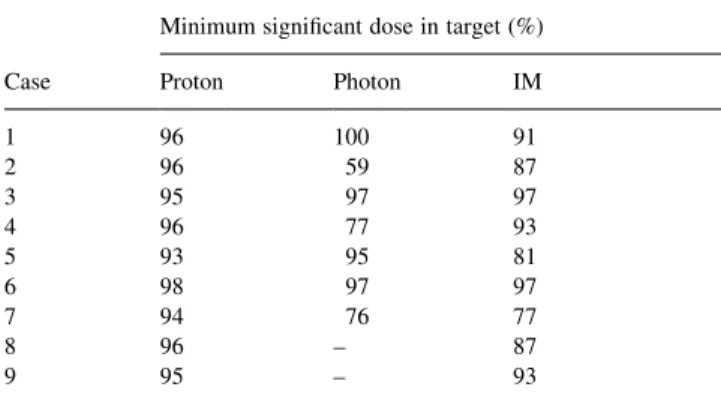
3.1.1. Target coverage and non-target tissue doses Tables 2 and 3 summarise some general results of the planning inter-comparisons. As a measure of the target coverage achieved by each planning method, we have calcu-lated the minimum signi®cant dose that the target receives from each plan. Within the target volume, we de®ne this to be the maximum dose level for which a connected region, of de®ned volume, exists within which all dose grid points are irradiated to this dose level or below. Thus, minimum signi®cant dose provides a measure of the magnitude of a cold spot of signi®cant size within the target volume [11]. In this work, the de®ned volume has been taken to be equiva-lent to the volume of a sphere of radius 0.75 cm (the ICRU de®nition of a hot spot in an OAR [18]).
From the cold spot analysis shown in Table 2 it can be seen that the proton plans generally provide good coverage of the target, with only one proton plan predicting a cold spot lower than 95% (case 5 with a minimum signi®cant dose of 93%). For both the standard and IM photon plans, the results vary somewhat, with three standard photon plans (worst case 59% cold spot for case 2) and ®ve IM photon plans (worst case 77% for case 7) having cold spots of less than 95%.
Table 3 provides estimates of the volume of non-target tissue irradiated to a dose level of 30% or more, which we use as a surrogate of the integral dose in order to
summar-Table 2
Minimum signi®cant doses to the targets of each case as a percentage of the mean target dose (for full description, see text)
Minimum signi®cant dose in target (%) Case Proton Photon IM
1 96 100 91 2 96 59 87 3 95 97 97 4 96 77 93 5 93 95 81 6 98 97 97 7 94 76 77 8 96 ± 87 9 95 ± 93
ise the dose delivered to all non-target tissues. In all cases, the photon and intensity modulated plans predict that a
higher volume of normal tissue will be irradiated to the 30% dose level than for the corresponding proton plan, with this volume being 1.2±4.8 times higher for the stan-dard photon plans and 1.0±4.5 times higher for the inten-sity modulated plans. The mean ratios over all cases for non-target tissue irradiation at the 30% level are 3.5 for the photon plans and 2.1 for the intensity modulated plans (Table 3).
3.1.2. Organ at risk (OAR) doses
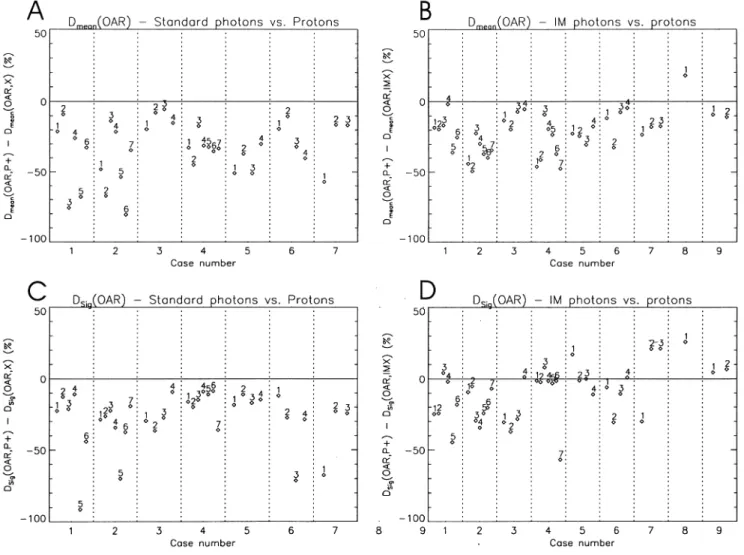
The predicted doses to all organs at risk for all the cases are summarised in Figs. 2 and 3. Fig. 2A,B shows, respectively, the difference in the mean dose predicted for each OAR of each case between the proton plan and the corresponding
standard photon plan (denoted as Dmean(OAR,P1) 2 Dmean
(OAR,X)) and the intensity modulated photon plan (denoted
as Dmean(OAR,P1) 2 Dmean(OAR,IMX)). The individual
OARs of each case are identi®ed numerically according to the assignments given in Table 4. As the differences between the proton and either photon plan is plotted, a dosimetric advantage in a particular OAR for the proton plan appears
Table 3
The volume (in cm3) of non-target tissue that would receive .30% of the
prescribed dosea
Volume (cm3) receiving .30% prescribed dose
Case Proton Photon IM 1 216 847 (3.9) 369 (1.7) 2 849 3348 (3.9) 3845 (4.5) 3 324 1567 (4.8) 593 (1.8) 4 2387 7759 (3.2) 6765 (2.8) 5 1563 4403 (2.8) 3374 (2.2) 6 366 1010 (2.8) 775 (2.1) 7 1039 3475 (3.3) 2090 (2.0) 8 792 ± 977 (1.2) 9 101 ± 100 (1.0) Mean ± 3.5 2.1
aFor the photon and intensity modulated plans, the volumes relative to
the proton plans are shown in brackets. Over all cases, the mean 30% volumes relative to the proton plans are shown in the last row.
Fig. 2. Differences between proton plans and standard (A,C) and intensity modulated (B,D) plans for mean (Dmean) and maximum signi®cant dose (Dsig),
as a point below the zero line, whilst a positive value indi-cates a dosimetric advantage for one or other of the photon plans. In both plots, the change in mean dose is expressed as a percentage of the mean target dose.
From Fig. 2A,B, it can be seen that in all but one OAR of one case, it is predicted that the use of protons would reduce the mean dose by up to 80 percentage points in comparison to standard photon planning techniques and by up to 50 percentage points compared to the intensity modulated plans. In only one OAR of one case (the brain stem for case 8) is the mean dose reduced through the use of intensity modulated photons. This particular case is studied in more detail below.
The mean dose to which an OAR is irradiated is propor-tional to the integral dose delivered to that organ. As such, this measure may only have direct relevance to organs that can be considered to have a parallel (or near parallel) architecture. As a measure of `hot spot' doses in the OARs, we have plotted in Fig. 2C,D the difference in
maximum signi®cant dose (Dsig(OAR)) between the proton
plan and either photon plan for each OAR. This concept is
exactly analogous to the cold spot (minimum signi®cant dose) analysis described above [11]. For OAR hot spot analysis, a volume equivalent to a sphere of radius 0.75 cm [18] or 5% of the OAR volume, whichever is the smal-lest, has been adopted.
As with the mean dose analysis, for no case are there any
OARs with a reduced Dsig resulting from standard photon
planning in comparison with the proton plan. When compared to the IM photon plan, 27 of the 38 OARs (70%) assessed over all the cases have reduced hot spot intensity through the use of protons, whereas in eight of the nine cases, the reverse is true, with the IM photon plans exhibiting reduced hot spot intensity in at least one OAR. Of these, cases 5,6,7,8 each have OARs for which the
Dsigis reduced by more than 10% of the mean target dose in
comparison with the proton plan. These cases will be studied in more detail below.
Although useful parameters for quantifying integral dose and hot spot intensity for individual OARs, both the mean and maximum signi®cant dose provide little indication of the dose-volume characteristics contained in the dose
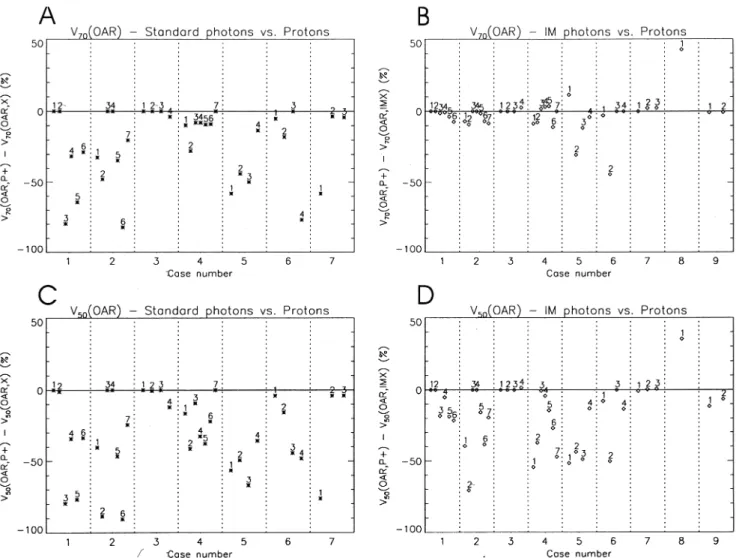
Fig. 3. Differences between proton plans and both standard (A,C) and intensity modulated (B,D) plans for the volumes of OARs irradiated to 50% or more (V50)
volume histograms (DVHs). In order to somewhat charac-terise the DVHs of the individual OARs, we have also plotted the volumes of each OAR that would receive 70%
(V70(OAR)) and 50% (V50(OAR)) of the mean target dose. In
Fig. 3, these results have been plotted in a similar fashion to Fig. 2. In all plots of Fig. 3, the difference in volume is expressed as a percentage of the total volume of each OAR. At the 70% dose level, the higher dose conformity result-ing from the use of protons compared to standard photon techniques is clearly demonstrated (Fig. 3A). In only one case are the volumes of all OARs receiving 70% dose or more comparable (case 3), whilst for all other cases, the
proton plans reduce V70 in the majority of OARs by as
much as 80% of the OAR volume (e.g. brain stem and femur in cases 1,2 respectively). At the 50% dose level,
the pattern is similar, with a generally larger improvement
through the use of protons, particularly in case 2, where V50
is reduced by over 90% of the total volume in two OARs (acetabulum and femur).
In contrast to the results for the standard photon plans, when comparing protons with IM photons, no general improvement at the 70% dose level is evident. The differ-ences between the plans are generally much less, and,
although the majority of OARs have a reduced V70 with
protons, in four cases (4,5,7,8), some OARs show a
reduc-tion in V70by as much as 40% for the IM photon plan (Fig.
3B). At the 50% dose level, the same comparison produces results similar to those for the standard photon plans, with a
reduction of V50for the majority of OARs through the use of
protons and only one OAR of one case showing a dosimetric advantage for the IM photon plan (the brain stem in case 8). 3.2. Selected case studies
In Figs. 2 and 3, we have attempted to summarise both doses and irradiated volumes of OARs such that the reader can have an overview of the characteristics of the different planning methods when applied to very disparate cases. However, to gauge fully the real clinical relevance of doses to particular OARs, a more detailed analysis is essen-tial. In this section, we have selected four cases of particular interest to be studied in more detail.
3.2.1. Case two
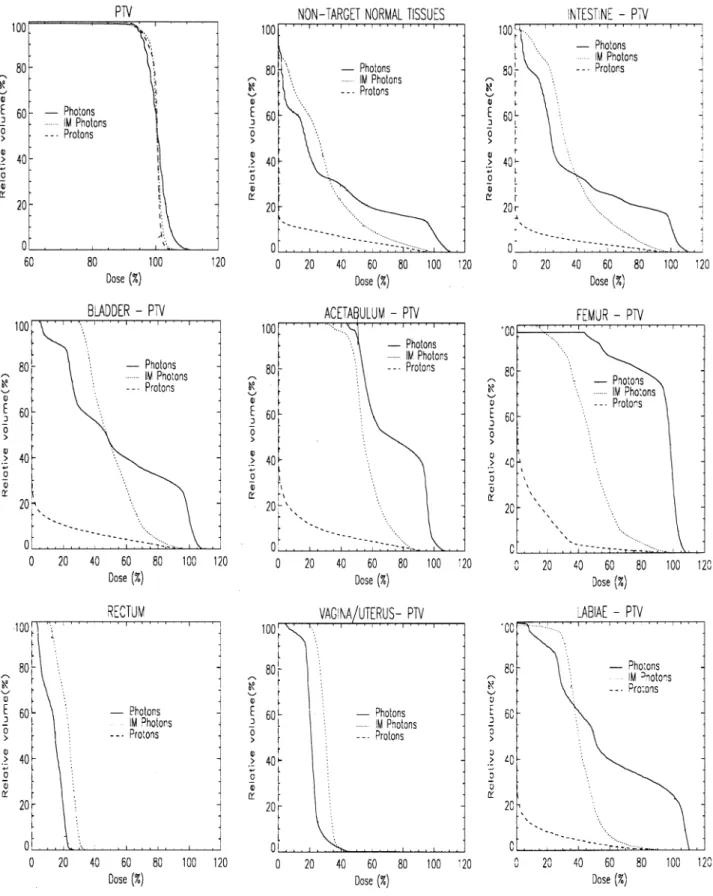
The ®rst case we discuss in detail is of a 64-year-old female with a malignant melanoma in the right lumbar region. The target volume is located in a super®cial location anterior to the bladder and right femoral head (Fig. 1a) and extends in the long axis from the upper pelvis to a third of the way down the right thigh. The calculated volume of the target is just under 1 liter (920 ccm) and the prescribed dose was 66.6 Gy. DVHs for all de®ned VOIs are shown in Fig. 4. For the anatomical VOIs, where necessary, the DVHs has been calculated with those parts of the target volume that partially overlap with the VOI removed.
All the DVHs for this case show a clear and substantial separation between the proton plan and either of the stan-dard or intensity modulated photon plans, indicating a signi®cant dosimetric advantage in the use of protons for all aspects of this case. In particular, the DVHs for the outline, represents the dose±volume characteristics for all the non-target tissues and graphically shows the four fold reduction of the volume of normal tissue irradiated to 30% (20 Gy) or more by the proton plan (already indicated in Table 2). For the OARs, the use of protons in this case could result in a drop of up to 30 Gy (45%) in the mean dose to the acetabulum compared to the intensity modulated plan, as well as reductions in ICRU hot spot intensity of up to 23 Gy (35%) in the case of the vagina. However, at about the 70% dose level (46 Gy) and above the irradiated volumes are similar for both the proton and IM photon plans.
Table 4
Numerical identi®ers of all OARs of all cases plotted in Figs. 2 and 3, together with the corresponding tolerance doses used for the IM photon plansa
Case number Oar number Oar description Tolerance dose (%)
1 1 Right eye 20
2 Left eye 20 3 Brain stem/pons 70 4 Whole brain
5 Left optic nerve 6 Right optic nerve
2 1 Bladder 65 2 Right acetabulum 65 3 Rectum 25 4 Vagina/uterus 30 5 Labiae 50 6 Right femur 7 Intestine 3 1 Spinal cord 55 2 Right kidney 35 3 Left kidney 35 4 Liver 4 1 Right kidney 20 2 Left kidney 20 3 Bladder 80 4 Total pelvis 5 Total abdomen 6 Vertebral body 7 Spinal cord 5 1 Rectum 65 2 Bladder 85 3 Large bowel 85 4 Total pelvis 6 1 Brain 2 Brain stem 60 3 Right eye 10 4 Right optic nerve 65 7 1 Spinal cord 10 2 Right lung 10 3 Left lung 10 8 1 Brain stem 40 2 Posterior fossa 9 1 Brain stem 60
aThe tolerance doses are expressed as a percentage of the mean target
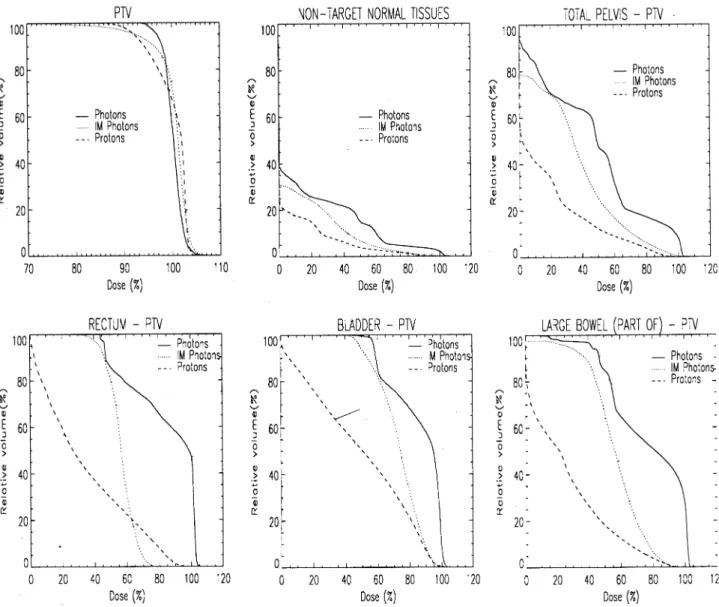
3.2.2. Case ®ve
This case is of a cervix carcinoma in a patient previously treated with three cycles of chemotherapy. The target volume
is situated close to the bladder and rectum with both struc-tures impressing into the de®ned target. As well as the target volume, VOIs of the rectum, bladder, portions of the small
bowel and the whole pelvic region have been de®ned. DVHs of all these structures are shown in Fig. 5.
For the target DVHs in Fig. 5, it can be seen that the IM photon plan has a shallower shoulder than either of the other plans, indicating some compromising of the target dose by this modality. In nearly all the OAR DVHs, a clear separa-tion between the proton and photon (both standard and IM) plans are seen. However, perhaps the most interesting feature of this set of DVHs is the overlapping of the proton and IM DVH curves above the 60% level for the rectum, indicating an improved high dose sparing of this organ by the IM photon plan. This overlapping is also seen in Fig. 3B as the single OAR appearing above the zero line for case 5. In Fig. 6, the proton and IM photon dose distribution are shown zoomed in the region of the target±rectum border. This ®gure clearly shows that in order to reduce the maxi-mum dose to the rectum, the intensity modulated plan, has in fact, compromised the dose to the target in the immediate vicinity of the rectal surface, such as to reduce the maximum
dose to that organ. This dose gradient is re¯ected in the larger volume of target under dosage seen in Table 2 (81% cold spot for the IM photon plan compared to 93% for the proton plan), as the majority of the dose less than 90% occurs along this border region of the target volume. For the proton plan, no such compromise has been made, resulting in improved target coverage but consequently to an increased dose to the rectal surface.
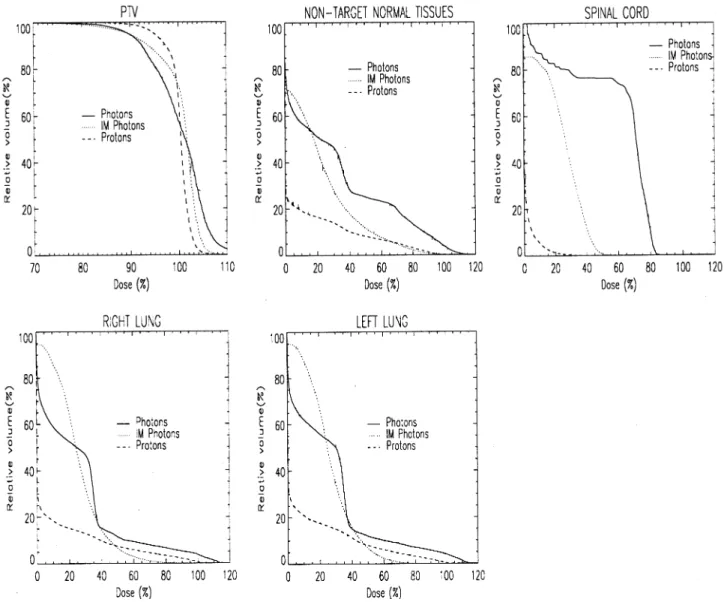
3.2.3. Case seven
This is a simulated case of a thyroid tumor, extending down into the mediastinum to the level of the mid-lung. The case was simulated on a rando phantom and VOIs for the target, both lungs and spinal cord were de®ned from CT slices taken of the phantom. The case was inspired by an actual case that had occurred in a clinic outside of this collaboration [13]. DVHs for all the de®ned VOIs are shown in Fig. 7. The target DVHs for both photon plans is clearly inferior to that of the proton plan, with substantial
Fig. 6. Dose distributions for the IM photon (left image) and proton (right image) plan for case ®ve, zoomed in the area of the target rectum boundary. The clearly reduced dosing to the rectal surface by the IM photon plan (between 60±80% of the target dose compared to 80±90% for the proton plan) has been achieved at the cost of target dose homogeneity in the neighbourhood of the rectum when compared to the proton plan.
compromising of the target dose indicated by the shallow shoulder and slow increase to the 100% volume, particularly for the IM photon plan. Again, this characteristic is re¯ected in the quanti®cation provided in Table 2.
For the OARs, the proton plan also shows a clear advan-tage in reducing the dose to the spinal cord (Fig. 7c). For mid to low doses, protons also considerably reduce the dose to both lungs. However, as seen in case 6 above, the crossing of the IM photon DVHs curve at the 50% dose level indicates improved high dose sparing by the use of IM photons. Again, this characteristic of the two DVHs is re¯ected in differences for the same OARs in Figs. 2 and 3 with all OARs being below the zero line (proton advantage) for the mean dose and the points for the two lung VOIs being above the zero
line (photon advantage) for the hot spot (Dsig) and V70
analy-sis.
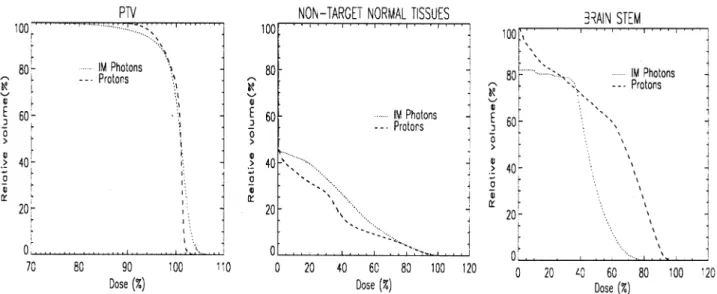
3.2.4. Case eight
The ®nal case is of a 45-year-old male presenting with an acinus cell carcinoma of the right sub-lingual gland. The tumour volume was relatively large (350 ccm) and partially wrapped around the brain stem (see Fig. 1b). DVHs for the target, non-target tissues and brain stem are shown in Fig. 8. Only proton and intensity modulated photon plans were performed for this case. The most signi®cant point of this case is the large separation demonstrated between the brain stem DVHs of the two plans. The IM photon plan demon-strates superior sparing of this organ at almost all dose levels, and particularly at the high (.50%) levels. Balanced against this is a marked compromising of the dose to the target volume, clearly seen in the target DVHs and quanti-®ed somewhat in Table 2.
4. Discussion
In the previous sections we have presented the results of
treatment planning comparisons on nine separate cases, covering a wide range of tumour types and sites. In this presentation, we have aimed to summarise as well as possi-ble the results of each of the plans, with the aim of providing some quantitative information from which the reader can draw conclusions as to the relative merits of standard photon, intensity modulated photon and proton treatments. Here we will discuss some points that can be concluded from this work and provide pointers as to the role of the different techniques and to their future development.
Over all the cases, it can be concluded that the proton plans in general provided a better coverage of the target than either of the standard or IM photon techniques (Table 2), in addition to signi®cantly reducing mean doses to OARs and the volumes of normal tissues and OARs irradiated to the 30 and 50% dose levels respectively (Table 3 and Fig. 3A,B). At the 70% dose level however, little difference overall was demonstrated between the volume of OARs irradiated by the proton or IM photon plans, whilst the comparative
analysis of OAR hot spots (Dsig) showed a strong case and
OAR dependency (Fig. 2B). The data presented in Figs. 2 and 3 show quantitatively what is clear qualitatively in the dose distributions of Fig. 1 that, the conformation of dose at the 70% dose level and above is essentially the same for both proton and intensity modulated photon plans, but that the lower dose `wash' to surrounding tissues is considerably reduced through the use of protons. In drawing conclusions from these observations though, two important points should be made.
Firstly, the clinical signi®cance of these results are a matter of some debate. It is clear that for some critical struc-tures, it is important to reduce the dose below prescribed tolerance levels in order to reduce the possibility of side effects, and it is clear that both photon IMRT and proton therapy can reduce OAR doses, and therefore the risk of complication, in comparison to the standard photon plans used in this analysis. However, the relevance of high dose
sparing in comparison to reduction of the mid-to-low doses depends heavily on the volume effect exhibited by each OAR. For supposed serially organised organs (such as the rectum in case 5), the comparable, and in some cases improved, sparing of some OARs at and above the tolerance dose in the IM photon plans compared to the corresponding proton plans indicates that a comparable reduction in the probability of complications to these types of organs is possi-ble using both modalities. On the other hand, the mid-to-low dose to large volumes of the lung in case 7, or to the intestine in case 2 may restrict the effectiveness of IM photons in these particular cases in comparison with protons. However, apart from some well studied organs, such as the spinal cord and lungs, the volume effect of organs is generally not well known. A case in point is the rectum, which is generally considered to be a serial organ (n 0:12 from Burman's ®tting of Emami's data [10,12, 29]), but which in recent work has been suggested to be a parallel organ similar in volume response to the lungs (n 0:9 [37]). If this latter value were correct, then the reduced mean dose to the rectum resulting from the proton plan in case 5 (Fig. 5) would in fact be the more signi®cant factor clinically, rather than the reduced high dose volume resulting from the IM photon plan. Clearly then, without a more accurate knowledge of the volume effect in such organs, it is very dif®cult to state even a relative ranking of intersecting DVHs. An interesting consequence of this uncertainty is that unless known other-wise, it is as well to reduce medium as well as high doses in all OARs as much as possible. As shown in this work, such a goal can generally be better achieved through the use of protons than through the use of either standard or IM photons. In particular, case 2 shows signi®cantly reduced dose to all OARs through the use of protons, perhaps suggesting that large, irregularly shaped targets may be a particularly good indication for this modality.
Secondly, it is necessary to determine which differences are due to differences in radiation quality, and which are due to differences in planning technologies. Take for example case 8. The differences in dose to the brain stem between the IM photon and proton plans are clearly signi®cant, but are in all probability dependent not on the relative characteristics of the radiation modality used, but on the relative sophisti-cation of the planning methods applied. In all the cases presented here, the proton plans have been calculated using a small number (maximum 4, see Table 1) of essen-tially homogenous ®elds (typically ^5±10% across each ®eld within the target volume), and in which no attempt has been made to include individual critical organs (such as the brain stem) into the optimisation process. In contrast, for the IM photon approach, the dose from a large number of different ®eld directions (nine in total) are calculated to be in-homogenous, and are optimised using dose constraints for both targets and critical structures. In this case, the abil-ity to de®ne dose limits to organs at risk, coupled with the additional degrees of freedom provided by intensity modu-lation from multiple ®eld directions, allows the photon
opti-misation procedure to balance the dose between the target and brain stem in a way that is not possible using the proton planning techniques used in this work. A similar conclusion can be reached for the rectum in case 5 (see Figs. 5 and 6). Thus, one must be extremely cautious in concluding that photons have an advantage over protons in these cases. This is probably not an advantage of photons over protons, but is more likely an advantage of inverse planning methods over what can be considered to be the forward planning methods used for the proton plans in this study.
In almost all cases presented here, protons provide an advantage over IM photons by reducing both the mean
dose and V50 for all OARs, and it is likely that much of
this reduced mid-to-low dose component stems from the advantageous physical characteristics of protons. However, a word of caution is also justi®ed regarding this observation. It is possible that through varying the parameters used in the photon optimisations, some of the lower doses to particular OARs could be further reduced. For instance, all IM photon plans presented in this paper were performed using a dose based optimisation based on the prescription of a single tolerance dose for each OAR (see Table 4). As described by Bortfeld [4], if a dose calculation point within an OAR has a dose below this de®ned tolerance, then this point is assigned a zero weight and plays no further role in the optimisation (unless in subsequent iterations the dose is raised above the tolerance dose once more). With such an optimisation regime, it is clear that there is no bene®t to reducing doses below the tolerance dose. Indeed, it is possi-ble that the volume of an OAR receiving dose below toler-ance is increased through the optimisation process. Such an effect can be seen clearly in the DVHs for the bladder and intestine in case 2 (Fig. 4). In each of these DVHs, the use of IMRT reduces the high dose volume delivered to these OARs in comparison to the standard photon plan, but increases the lower dose volumes.
This observation is reinforced in the analysis of case 7 (Fig. 7). Here the standard photon plan reduces the low dose volumes (,30% of the target dose) to the lungs more than the IM photon plan. In many ways, this case is similar to a test case discussed by Wang et al. for comparing the ef®cacy of dose and biologically based optimisation criteria in the calculation of intensity modulated ®elds [49]. In that work, they found that when using a single tolerance dose optimi-sation, little or no improvement could be gained over stan-dard planning techniques in the region of the lung. The results of this case reinforces this view somewhat. Wang et al. then showed that the use of biologically based cost functions had the ability to produce clinically more accep-table plans. Consequently, it is possible that for this case in particular, the use of alternative optimisation methods could result in an improved IM photon plan. Indeed, by the addi-tion of simple dose-volume constraints into the photon opti-misation code used here, it has recently been shown that the quality of plan in such circumstances can be much improved [8].
A ®nal comment should be made concerning overall inte-gral dose. It is clear from the results presented in Table 3 that the reduction of integral dose with protons is still signif-icant, even compared to IMRT techniques (an average reduction of just over two). Although it is true that the clinical relevance of low doses to large volumes is largely unknown (except perhaps in organs with a parallel or near parallel architecture), there are cases where a reduction in overall normal tissue dose may indeed be relevant. A typical case is with paediatric patients, where it is clearly desirable to reduce the dose load to normal tissue as much as possible. However, other areas where integral dose could be impor-tant are in repeat radiotherapy treatments or perhaps in radiotherapy adjuvant to chemotherapy or surgery, in all of which there is a need to preserve the viability of normal tissues. Indeed, although the clinical relevance of integral dose may be unknown in many cases, this does not neces-sarily imply that integral dose is benign.
5. Conclusions
In this work, we have found that the use of protons in radiotherapy could potentially provide both improved target dose homogeneity and reduced mean and mid-to-low doses to critical structures when compared to either standard or IM photon treatments. Although the clinical advantage of redu-cing such doses is not well understood in all cases, the use of radiation modalities with superior dose localisation charac-teristics to that of photons remain the only way of achieving this goal and as such will inevitably play a role in the future development of radiotherapy. At the 70% and above dose levels, the ability to spare organs at risk has been shown to be comparable for both IM photons and protons, and in three of the nine cases studied, we have demonstrated that the use of IM photons can provide signi®cant improved high dose sparing in some critical structures. However, in each of these cases we suggest that this improvement originates from comparing inversely planned photons against forward planned protons. For a true comparison, inverse techniques must also be applied in proton therapy. Indeed, the 3D loca-lisation of dose provided by the Bragg peak in principle provides an additional degree of freedom in which intensity can be modulated, and as such, may provide a method by which highly conformal doses can be constructed even in the most demanding of situations [28]. Consequently, a detailed comparison of inverse methods for both photons and protons is necessary to provide further insight into the relative roles of these modalities in radiation oncology.
References
[1] Bendl R, Pross J, Hoess A, Keller MA, Preiser K, Schiegel W. Virtuos ± a program for virtual radiotherapy simulation and veri®cation. In: AR Hounsell, JM Wilkinson, PC Williams, editors. XIth International
Conference on `The use of computers in radiation therapy', Manche-ster, 20±24 March, 1994. pp. 226±227.
[2] Boesecke R, Bauer B, Schiegel W, Schad L, Lorenz WJ. Medical workstation for radiation therapy planning. In: Bruinvis IA, editor. IXth International Conference on `The use of computers in radiation therapy, 1987. pp. 181±183.
[3] Bonnet DE. Current developments in proton therapy: a review. Phys. Med. Biol. 1993;38:1371±1392.
[4] Bortfeld T, Buerkelbach J, Boesecke R, Schiegel W. Methods of image reconstruction from projections applied to conformation radio-therapy. Phys. Med. Biol. 1990;35:1423±1434.
[5] Bortfeld T, Schlegel W. Optimisation of beam orientations in radia-tion therapy: some theoretical consideraradia-tions. Phys. Med. Biol. 1993;38:291±304.
[6] Bortfeld T, Schiegel W, Rhein B. Decomposition of pencil beam kernels for fast dose calculations in three-dimensional treatment plan-ning. Med. Phys. 1993;20:311±318.
[7] Bortfeld T, Boyer AL, Schiegel W, Kahier DL, Waldron TJ. Experi-mental veri®cation of multileaf modulated conformal radiotherapy. In: Hounsell AR, Wilkinson JM, Williams PC, editors. XIth Interna-tional Conference on `The use of computers in radiation therapy', Manchester, 20±24 March, 1994, pp. 180±181.
[8] Bortfeld T, Stein J, Preiser K. Clinically relevant intensity modulation optimisation using physical criteria. In: Leavitt DD, Starkschall G, editors. XIIth International Conference on `The use of computers in radiation therapy', Salt Lake City, 27±30 May, 1997. pp. 1±4. [9] Brahme A, Kallmann P, Lind BK. Optimisation of proton and heavy
ion therapy using an adaptive inversion algorithm. Radiother. Oncol. 1989;15:189±197.
[10] Burman C, Kutcher GJ, Emami B, Goitein M. Fitting of normal tissue data to an analytical function. Int. J. Radiat. Oncol. Biol. Phys. 1991;21:123±136.
[11] Dykstra C, Bortfeld T, Debus J, Lomax A, Harrop R, Schiegel W, Munkel G. Characterisation of dose distributions in radiation therapy plans. Radiother. Oncol. 1996;41:281±284.
[12] Emami B, Lyman J, Brown A, et al. Tolerance of normal tissue to therapeutic irradiation. Int. J. Radiat. Oncol. Biol. Phys. 1991;21:109± 122.
[13] Esik G, Bortfeld T, Bendel R, Nemeth G, Schiegel W. Inverse radio-therapy planning for a concave-convex PTV in cevical and upper mediastinal regions. Strahienther. Onkol. 1997;173:193±200. [14] Goitein M, Chen GTY. Beam scanning for heavy charged particle
radiotherapy. Med. Phys. 1983;10:831±840.
[15] Goitein M. The comparison of treatment plans. Sem. Radiat. Oncol. 1992;2:246±256.
[16] Gokhale P, Hussein EMA, Kuikani N. Determination of beam orien-tation in radiotherapy planning. Med. Phys. 1994;21:393±400. [17] Holmes TW, Mackie TR, Reckwerdt PI, Deasy JO. A prototype
inverse treatment planning algorithm for tomotherapy. In: Hounsell AR, Wilkinson JM, Williams PC, editors. XIth International Confer-ence on `The use of computers in radiation therapy', Manchester, 20± 24 March, 1994. pp. 62±63.
[18] ICRU-50, Prescribing, recording and reporting photon beam therapy. Bethesda, MD, 1993.
[19] Iain NL, Kahn MG, Graham MV, Purdy JA. 3D conformal radiation therapy: V. Decision-Theoretic evaluation of radiation treatment plans. In: Hounsell AR, Wilkinson JM, Williams PC, editors. XIth International Conference on `The use of computers in radiation ther-apy', Manchester, 20±24 March, 1994. pp. 8±9.
[20] Kallmann P, Lind BK, Brahme A. An algorithm for maximising the probability of complication free tumour control in radiation therapy. Phys. Med. Biol. 1992;37:871±890.
[21] Kanai T, Kanai K, Kumamoto Y, Ogawa H, Yamada T, Matsuzawa H. Spot scanning system for radiotherapy. Med. Phys. 1980;7:365± 369.
[22] Koehler AM, Schneider RJ, Sisterson JM. Range modulators for protons and heavy ions. Nucl. Instrum. Methods 1975;131:437±440.
[23] Koehler AM, Schneider RJ, Sisterson JM. Flattening of proton dose distributions for large ®eld radiotherapy. Med. Phys. 1977;4:297±301. [24] Lee M, Wynne C, Webb S, Nahum AE, Dearneley DA. Comparison of proton and mega-voltage X-ray treatment planning for prostate cancer. Radiother. Oncol. 1994;33:239±253.
[25] Ling CC, Burman C, Chui C, Kutcher GJ, Leibel SA, LoSasso T, Mohan R, Bortfeld T, Reinstein L, Spirou S, Wang XH, Wu Q, Zelefsky M, Fuks Z. Conformal radiation treatment of prostate cancer using inversely-planned intensity-modulated photon beams produced with dynamic multileaf coliimation. Int. J. Radiat. Oncol. Biol. Phys. 1996;35:721±730.
[26] Lomax A, Scheib S, Munkel G, Blattmann H. The comparison of spot scanning proton radiotherapy with conventional photon therapies. In: Hounsell AR, Wllkinson JM, Williams PC, editors. XIth International Conference on `The use of computers in radiation therapy', Manche-ster, 20±24 March, 1994. pp. 366±367.
[27] Lomax AJ, Pedroni E, Schaffher B, Scheib S, Schneider U, Tourovsky A. 3D treatment planning for conformal proton therapy by spot scan-ning. In: Faulkner K et al., editors. Proc. 19th L H Gray Conference, London: BIR publishing, 1999. pp. 67±71.
[28] Lomax A. Intensity modulation for proton radiotherapy, Phys. Med. Biol. 1999;44:185±205.
[29] Lyman JT, Wolbarst B. Optimisation of radiation therapy III: A method of assessing complication probabilities from dose-volume histograms. Int. J. Radiat. Oncol. Biol. Phys. 1987;13:103±109. [30] Mageras GS, Mohan R. Application of fast simulated annealing to
optimisation of conformal radiation treatments. Med. Phys. 1993;20:639±647.
[31] Miralbell R, Croweli C, Suit HD. Potential improvement of three dimensional treatment planning and proton therapy in the outcome of maxillary sinus cancer. Int. J. Radiat. Oncol. Biol. Phys. 1991;22:305±310.
[32] Miralbell R, Urie MM. Potential improvement of three dimensional treatment planning and proton beams in fractionated radiotherapy of large cerebral arteriovenous malformations. Int. J. Radiat. Oncol. Biol. Phys. 1993;25:353±358.
[33] Miralbell R, Lomax A, Borfeld T, Rouzaud M, Carrie C. Potential role of proton therapy in the treatment of paediatric medulloblastoma/ primitive neuroectodermal tumors: reduction of the supratentorial target volume. Int. J. Radiat. Biol. Phys. 1997;38:477±484. [34] Miralbell R, Lomax A, Russo M. Potential role of proton therapy in
the treatment of pediatric medulloblastoma/primitive neuro-ectoder-mal tumors: spinal theca irradiation. Int. J. Radiat. Biol. Phys. 1997;38:805±811.
[35] Mohan R, Mageras GS, Baldwin B, et al. Clinically relevant optimi-sation of 3D conformal treatments. Med. Phys. 1992;19:933±944.
[36] Munzenrider JE, Brown AP, Chu JCH, et al. Numerical scoring of treatment plans. Int. J. Radiat. Oncol. Biol. Phys 1991;21:147±163. [37] Nahum AE. The potential of normal-tissue radiobiology for the
physics of conformal therapy. In: Nahum A, Peacock J, editors. Tissue effects in radiotherapy: physics meets biology, Betchworth, UK, 14± 16 July, 1997.
[38] Niemierko A. Random search algorithm (RONSC) for optimisation of radiation therapy with both physical and biological end points and constraints. Int. J. Radiat. Oncol. Biol. Phys. 1992;23:89±98. [39] Niemierko A, Urie M, Goitein M. Optimisation of 3D radiation
ther-apy with both physical and biological end points and constraints. Int. J. Radiat. Oncol. Biol. Phys. 1992;23:99±108.
[40] Pedroni E, Bacher R, Blattmann H, et al. The 200 MeV proton therapy project at PSI: conceptual design and practical realisation. Med. Phys. 1995;22:37±53.
[41] Preiser K, Bortfeld T, Hartwig K, Schlegel W, Stein J. A new program for inverse radiotherapy planning. In: Leavitt DD, Starkschall G, editors. XIIth International Conference on `The use of computers in radiation therapy', Salt Lake City, 27±30 May, 1997. pp. 425±428. [42] Sherouse GW. Dose homogenisation using vector analysis of dose
gradients. In: Hounsell AR, Wilkinson JM, Williams PC, editors. XIth International Conference on `The use of computers in radiation therapy', Manchester, 20±24 March, 1994. pp. 248±249.
[43] Scheib S, Pedroni E. Dose calculations and optimisation for 3D conformal voxel scanning. Radiat. Environ. Biophys. 1996;31:251± 256.
[44] Sisterson J. Particles Newsletter 21 (Harvard cyclotron laboratory), January 1998.
[45] Slater JD, Slater JM, Wahien S. The potential for proton therapy in locally advanced carcinoma of the cervix. Int. J. Radiat. Oncol. Biol. Phys. 1992;22:343±348.
[46] Tatsuzaki H, Urie MM, Lingwood R. Comparative treatment plan-ning: proton versus X-ray beams against glioblastoma multiforme. Int. J. Radiat. Oncol. Biol. Phys. 1992;22:265±274.
[47] Tatsuzaki H, Urie MM, Willet CG. 3D comparative study of proton versus. X-ray radiation therapy for rectal cancer. Int. J. Radiat. Oncol. Biol. Phys. 1992;22:369±374.
[48] Urie MM, Goitein M. Variable versus ®xed modulation of proton beams for treatments in the cranium. Med. Phys. 1989;16:16. [49] Wang X, Mohan R, Jackson A, Leibel SA, Fuks Z, Ling CC.
Opti-misation of intensity modulated 3D treatment plans based on biolo-gical indices. Radiother. Oncol. 1995;37:140±152.
[50] Webb S. Optimisation of conformal radiotherapy dose distributions by simulated annealing. Phys. Med. Biol. 1989;34:1349±1370. [51] Wilson RR. Radiological use of fast protons. Radiology 1946;47:487±