Subjective Evaluation of the Audiovisual Spatial Congruence in the Case of
Stereoscopic-3D Video and Wave Field Synthesis
Cédric. R. Andréa,b,∗, Étienne Corteelc, Jean-Jacques Embrechtsa, Jacques G. Verlya, Brian F. G. Katzb,∗∗
aLaboratory for Signal and Image Exploitation (INTELSIG), Department of Electrical Engineering and Computer Science, University of Liège, Liège, Belgium.
bLIMSI-CNRS, Orsay, France. csonic emotion labs, Paris, France.
Abstract
While 3D cinema is becoming increasingly established, little effort has focused on the general problem of producing a 3D sound scene spatially coherent with the visual content of a stereoscopic-3D (s-3D) movie. The perceptual relevance of such spatial audiovisual coherence is of significant interest. In this paper, a subjective experiment is carried out where an angular error between an s-3D video and a spatially accurate sound reproduced through Wave Field Synthesis (WFS) is simulated. The psychometric curve is measured with the method of constant stimuli, and the threshold for bimodal integration is estimated. The impact of the presence of background noise is also investigated. A comparison is made between the case without any background noise and the case with an SNR of 4 dBA. Estimates of the thresholds and the slopes, as well as their confidence intervals, are obtained for each level of background noise. When background noise was present, the point of subjective equality (PSE) was higher (19.4◦instead of 18.3◦) and the
slope was steeper (−0.077 instead of −0.062 per degree). Because of the overlap between the confidence intervals, however, it was not possible to statistically differentiate between the two levels of noise. The implications for the sound reproduction in a cinema theater are discussed.
Keywords: spatial congruence, bimodal integration, stereoscopic video, Wave Field Synthesis, psychometric curve, background noise
1. Introduction
The present article addresses the question of the perceptual congruence between the sound and the image when the spectator in a cinema is presented with a 3D sound scene spatially coherent with the stereoscopic 3D (s-3D) scene. In essence, the depth perception in s-3D is created by presenting a different image to the two eyes. Both images in an s-3D pair are displayed on the cinema screen and all spectators thus look at the same pair of images. When one compares the visual perception of two spectators seated at different locations in the room, one finds, both geometrically and experimentally, that the objects of the scene displayed on the screen are rendered at different locations in the room (André et al.,2010).
The present paper considers the potential error in the angle between the sound and the image when presenting precise spatial sound through Wave Field Synthesis (WFS) in combination with s-3D video to spectators seated at different locations. The spectators evaluate the spatial coherence between a displayed virtual character and a repro-duced speech sound. The psychometric function, which relates the physical stimulus to the participants’ responses, is obtained in presence or absence of additional background noise.
∗Corresponding author. Tel: +32 (0) 4 366 59 42
∗∗Principal corresponding author. Tel: +33 (0) 1 69 85 80 80. Fax: +33 (0) 1 69 85 80 88
1.1. Subjective evaluation of the audiovisual congruence
When people are presented with a time-synchronous but spatially mismatched auditory-visual stimulus, they tend to perceive the sound coming from closer to the location of the visual stimulus, the so-called “ventriloquism” ef-fect (Thurlow and Jack,1973). This effect decreases with increasing angular difference between the positions of the sources (Jackson,1953).
Vision and audition give us information about the same objects as those we find in our surroundings. This infor-mation is integrated in the brain to form the percept of a single audiovisual object. Experiments previously conducted in laboratory conditions used an audiovisual stimulus consisting of a simultaneous pair of brief, simple, and arbitrary stimuli, such as an auditory beep and a visual flash. In this case,Alais and Burr(2004) have shown that a statistically optimal model approximates well the mechanism of bimodal integration. If each sensory estimate ˆSiis unbiased but
corrupted by a gaussian white noise with variance σ2
i, then the maximum-likelihood estimate (MLE) of the integrated
perception is ˆ S =X i wiSˆiwith wi= 1/σ2 i P j1/σ2j (1) Thus, the variance of an auditory-visual percept is given by
σAV2 = σ2 AσV2 σ2 A+ σV2 ≤ min (σ2 A, σV2) (2)
provided that the sensory noises are independent (Ernst and Banks,2002). In another experiment, Battaglia et al.
(2003) had to include a bayesian prior, thereby generalizing the MLE model, to accurately model the data from their auditory-visual localization task. In this work, the additional auditory ambient noise serves as a way to decrease the reliability of the auditory spatial information through an increase of σ2
A. The sensory integration should therefore rely
more on the visual stimulus, and the stimulus integration should be more resilient to the angular error between the sound and the image.
The magnitude of the auditory-visual integration has been found to depend on both spatial relations and temporal relations of the unimodal stimuli. The auditory-visual window of integration of arbitrary stimuli extends up to about 100 ms in time and 3◦ in azimuth angle (Lewald et al.,2001). It is centered around azimuth 0◦ in space (directly
in front), when the stimuli are co-located, and about 50 ms in time, when the auditory signal arrives after the visual signal (Slutsky and Recanzone,2001;Lewald and Guski,2003).Slutsky and Recanzone(2001) have shown that the effect of a temporal disparity on the spatial localization acuity is greatest when the spatial error between the sound and the image is below the (spatial) threshold of integration. However, this effect is not significant below a 50 ms time delay.
When the stimuli are more natural, i.e. carry meaningful information, such as for a speaking character, then the “unity assumption” must be taken into account. The unity assumption arises from properties shared by the unimodal stimuli (here sound and image) such as spatial location, temporal rate, size, shape (Welch,1999). The more numerous the common properties, the stronger the association of the stimuli. Conversely, the more numerous the conflicting cues, the weaker the integration.
Therefore, when more natural stimuli are used, such that the unity assumption holds, the (auditory-visual) bimodal integration is maintained at much higher angles of discrepancy than those obtained with arbitrary stimuli. Simply by letting the participants assume that the arbitrary stimuli had a common cause,Lewald and Guski(2003) increased the spatial window to about 12◦. The temporal window can also be enlarged. Using a speech stimulus,van Wassenhove
et al.(2007) obtained a 200 ms time window.
In Tab.1, the audiovisual apparatus of several recent experiments conducted on the association of image and sound are compared. The studies concerned with 3D sound all used Wave Field Synthesis (WFS) (Berkhout,1988) for the sound reproduction.
None of these previous studies addressed the problem of the s-3D video projection of a natural scene to multiple users. In addition, the effect of the auditory ambient noise level is investigated here. Because WFS reproduces a sound position independent from the listener position (Theile et al.,2003), the limit of audiovisual integration found here is also a measure of the sweet spot for accurate auditory-visual reproduction (André et al.,2012).
Table 1: Comparison between audiovisual apparatus used in published papers and in the present work.
Study Visual system Image Size (in.) Sound Content
Komiyama(1989) HDTV (16:9) 2D 72 mono Real (person)
de Bruijn and Boone(2003) Projector (4:3) 2D 100 WFS Real (person)
Melchior et al.(2003) Projector (16:9) 2D 163 WFS Real (person)
Melchior et al.(2006) HMDa(NAb) s-3D NAb WFS CGIc(abstract)
Present work Projector (4:3) s-3D 129 WFS CGI (character)
aHead-Mounted Display.
bthe diagonal field of view of the HMD was 31.5◦. cComputer-Generated Images. S1 S2 V1, A I V2 δ A0 δ0 d ρd
Figure 1: Illustration of variation in angular error between sound and image as a function of seating position. The spectator at S2watches the same punctual s-3D object as the spectator at S1, the ideal viewpoint, with an angular disparity in perceived position of δ. The compression of the audio depth (A0Iinstead of AI) allows one to reduce the angular error between the sound and the image (δ0< δ). The distance d is V
1I.
1.2. Audiovisual spatial coherence in s-3D video
As previously stated, the illusion of depth perception in s-3D cinema is created by presenting a different image to each eye, and the perceived location of displayed objects varies with the seating location of the spectator. In fact, only visual objects with a zero parallax, such that they are perceived as located at the screen plane, are consistently perceived among spectators. All other positions are not consistently perceived within the room. However, they are all perceived at directions that cross on the screen, at the intersection with the line between the spectator and the perceived object location (position I in Fig.1).
In Fig.1, two spectators at S1and S2look at the same s-3D pair of images displayed on a screen. We assume
that the pair of images contain one object and that the images are such that the spectator at S1, the ideal (correct)
viewpoint, perceives the object as being located at V1(behind the screen). As a result, the spectator at S2perceives
the object as being located at V2.
The seating location in the room is not the only factor that impacts the visual localization. The distance from the spectator to the perceived object location is also dependent on the spectator’s interocular distance, i.e. the distance between his/her two eyes (Évrard et al.,2011). The interocular distance mainly depends on ethnicity, gender, and age (Dodgson,2004). However, this factor is not considered in the present study.
Asde Bruijn and Boone (2003) stated in the case of 2D video, it is possible to limit the angular discrepancy between the sound and the image by pulling the audio sources towards the screen along the line between the visual object and the ideal viewpoint. At the same time, the audio gain is adjusted to produce the same sound level as the original source at the ideal viewpoint. This method is adapted here to s-3D video.
Given the positions of the visual object V1, the ideal viewpoint S1, and the screen, one can compute the positions
of the two points in the left and right images on the screen corresponding to the visual object (Évrard et al.,2011). The sound can be placed at a point A0anywhere along the line defined by S
ρdefined by
A0− V1= ρ(I− V1) (3)
where I is the intersection of the line and the screen. Therefore, ρ = 0 yields A0= V
1and ρ = 1 yields A0= I.
For a spectator seated at S2, the visual object appears at V2, resulting in an angular error δ between the sound and
the image if the sound is positioned at A = V1. When the sound is pulled closer to the screen, say at A0, the angular
error decreases for the spectator at S2, i.e. δ0 < δ. This is also illustrated in Fig.1. Note that this remains true when
the line S1V1is not perpendicular to the screen, as will be the case in this experiment. Provided that the sound level at
A0is adjusted to match the volume it would have produced from A, the audiovisual congruence should be maintained at S1. However, it is not possible to match the volume correctly for all positions as the acoustic distance attenuation is
a function of the distance squared. Positions between S1and the screen, where the proportion of the modified distance
to the original distance is larger, will have greater volume errors. 1.3. Objectives
In the present article, an experiment is conducted with naive spectators to evaluate the threshold of bimodal integration associated with the angular error between audio and video in the case of Wave Field Synthesis (WFS) and stereoscopic 3D (s-3D) video. A virtual scene consisting of a character in an apartment is chosen to simulate a cinema context. The impact of the presence of additional ambient noise is also investigated. The value of the thresholds with and without ambient noise is obtained through the measurement of the associated psychometric functions. According to the maximum-likelihood theory of sensory integration, it is expected that the psychometric function will have a slower decay associated with a higher threshold in presence of ambient noise. Audiovisual rendering is provided via the SMART-I2platform (Spatial Multi-user Audio-visual Real-Time Interactive Interface) (Rébillat et al.,2008,2009,
2012) (see Fig.3) using passive s-3D video and acoustic WFS. This virtual reality system provides its users with stable auditory and visual cues in a large rendering area. The psychometric functions are obtained in a yes/no experiment with the method of constant stimuli with and without ambient noise. This experiment aims at studying to what extent naive subjects perceive the inconsistency between the sound and the image when viewing s-3D contents. The second objective is to verify that ambient noise allows the subjects to maintain the auditory-visual stimulus integration at higher angles of error. The third objective is to verify that the compression of the audio space towards the screen is adequate for s-3D video display.
2. Method
2.1. Experimental design
In each session, three participants faced the right panel of the SMART-I2, used as the projection screen, and were
seated at a distance of 2 m (Fig.2). The first participant was seated at S1, facing the middle of the panel. The other
two were seated at S2 and S3, at 0.6 m and 1.2 m to the right of S1, respectively. A virtual character, the visual
stimulus, was rendered 1.5 m behind the screen, at 0.8 m to the left of S1. A speech signal, the auditory stimulus,
was rendered at five different positions along the line going through S1and the virtual character position, V1. These
positions are labelled A¬(closest to the screen) to A°(farthest from the screen). A®corresponds to the position of
the virtual character (V1), i.e. there is no audiovisual discrepancy for this sound position if the spectator is at S1. In
addition, a control position Ac is defined as the mirror image of A®with respect to the perpendicular to the screen
passing through S1. The different subscripts used to denote the audio and visual object positions underline that these
are independent. An ambient sound signal was rendered at positions Bg, over 4 m behind the farthest speech source position.
A total of 17 subjects took part in the experiment (14 men, 3 women, age 19 to 30 years old, Mean = 23.5, Std. Dev. = 3.2). They all worked at the LIMSI. They were naive as to the experiment and they were not financially compensated. All but one participant had previously seen at least one s-3D movie in a cinema. Twelve participants played 3D video games (but not necessarily in s-3D) at most once a month. Only five participants used spatialized audio systems more than once a month, and three of them were the only ones to use virtual reality systems. The subjects can therefore be considered as being naive with respect to the combination of audio and video technologies used here.
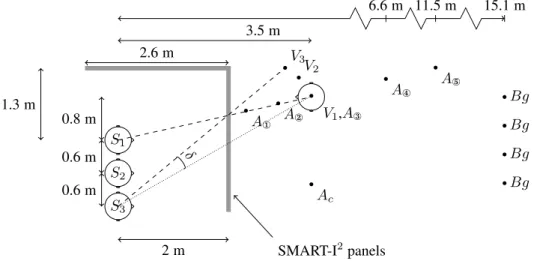
S1 S2 S3 Bg Bg Bg Bg V1,A® A° A¯ A A¬ Ac V2 V3 δ SMART-I2panels 2 m 2.6 m 3.5 m 0.8 m 1.3 m 0.6 m 0.6 m 6.6 m 11.5 m 15.1 m
Figure 2: Layout of the experimental setup with respect to the SMART-I2audio-visual panels (in gray). The S
i’s are the positions of the subjects. Viis the perceived position of the virtual character seen from Si. The Ai’s are the audio positions of the rendered speech, and the Bg’s are the audio positions of the rendered background ambience sound. The angle δ illustrates the angular separation between the perceived location of the character and a position of the rendered speech.
Table 2: Chosen values of ρ and the corresponding angles of error AVangle [deg] for each position Siin the layout of Fig.2.
A¬ A A® A¯ A° Ac
ρ 0.79 0.40 0.01 -2.07 -5.32 control
S1 0.0 0.0 0.0 0.0 0.0 26
S2 1.9 4.3 6.0 10.2 12.2 31
S3 2.9 6.9 9.9 17.4 21.2 34
The chosen experimental design was a within-subjects design with three factors: the sound position (six levels); the presence of background noise (two levels); and the repetition (four levels) (see Sect.2.4). The seat position is not a factor of the experimental design since, together with the sound position, it defines the angular error AVangle between the sound and the image, which is a continuous variable, in degrees [deg]. The presence of background noise background is coded as a binary variable, with the values BG and NOBG indicating presence and absence, respectively.
In the case of a yes/no experiment,Lam et al.(1999) shows that four points are enough to accurately estimate the psychometric function while keeping a low standard deviation on the parameters. These points are those where the positive answer rate is expected to be 12, 31, 69, and 84%. Thirty to fifty trials at each point should yield accurate estimates of the threshold and slope parameters. The stimulus values corresponding to these optimal sampling points were first estimated using the curve A in Fig. 4 ofKomiyama(1989). The four values that optimally sample this curve are 1.5, 6.6, 12.7, and 16.9◦. A pre-experiment with six subjects showed that slightly larger values were needed to
ensure that every subject could perceive an audiovisual discrepancy. The chosen values of ρ (where ρ is defined by Eq.3) and the corresponding values of the angle of error AVangle are given in Tab.2. These values were chosen as a compromise between being close to the optimal sampling values and ensuring that the SMART-I2was able to
correctly reproduce the sound source at the chosen location. The values of the angular error corresponding to each value of ρ and each position Sican be obtained from the geometry in Fig.2. Given the coordinates S1and V1and the
coordinates of the eyes of the viewer at S1, the projections Iland Irof V1in the left and right images can be obtained.
Then, the coordinates of V2and V3can be computed (Évrard et al.,2011). It is assumed that each viewer is facing the
2.2. Experimental setup
The present study was carried out using an existing system for virtual reality, called the SMART-I2(Rébillat et al.,
2008,2009,2012), which combines s-3D video with spatial audio rendering based on WFS.
The SMART-I2 system (Fig.3) is a high-quality 3D audiovisual interactive rendering system developed at the
LIMSI-CNRS in collaboration with sonic emotion1. The 3D audio and video technologies are brought together using two Large Multi-Actuator Panels (LaMAPs), each of size 2.6 m × 2 m, forming a “corner”, with the panels acting both as a pair of orthogonal projection screens and as a 24-channel loudspeaker array. The s-3D video is presented to the user using passive polarized technology, and 24 actuators attached to the back of each LaMAP allow for a WFS reproduction in a horizontal acoustic window corresponding to the s-3D video window. WFS (Berkhout,1988) is a sound field reproduction techniques that synthesizes the physical radiation properties of sound sources within an extended listening area (Rébillat et al.,2008). The 20 cm spacing between the actuators corresponds to an aliasing frequency of about 1.5 kHz, the upper frequency limit for a spatially correct wavefront synthesis, accounting for the size of the loudspeaker array, and the extension of the listening area (Corteel,2006).
The implementation of WFS used here is restricted to the synthesis of sound sources located in the horizontal plane (Corteel et al.,2012). Azimuth and distance localization accuracies of sound events in the SMART-I2 were
previously verified by perceptual experiments and are globally consistent with corresponding real life localization accuracies.
Rébillat et al.(2008) evaluated the azimuth localization accuracy of the WFS system in the SMART-I2. They
presented 17 virtual loudspeakers on a horizontal arc at 4 m from the listener. The loudspeakers were separated by 3◦. Participants had to determine the origin of a 150 ms white noise burst. The median angular error was always less
than 3◦, and the variability, measured by the half inter-quantile range, was between 3 and 4◦. These results are in line
with the literature. Verheijen(1998) performed a similar experiment with a WFS loudspeaker array, comparing the localization accuracy of virtual WFS sources and real sources. With a loudspeaker spacing of 22 cm, the mean RMS error was 3.2◦, with a standard deviation of the error of 1.4◦. This was only slightly higher than the results for real
sources, which were 2.6◦and 1◦, respectively.
The distance perception in the SMART-I2 was evaluated by Rébillat et al.(2012). Participants estimated the
distance to virtual sources in the auditory, visual, and auditory-visual modalities. Using two methods, visual target selection and blind-walking triangulation, results were in line with the literature on real auditory source distance perception (Zahorik et al.,2005). The perceived distance dpto the auditory targets was modeled by the curve dp= kdas
where dsis the simulated distance, and k and a are parameters of the model. The median values of k and a were
1.72± 0.09 and 0.33 ± 0.03, respectively. This was in line with the results of a review of 84 studies on auditory distance perception, where the average values for k and a were 1.32 and 0.54, respectively (Zahorik et al.,2005).
The software used to render the visual part of the experiment is MARC (Multimodal Affective and Reactive Characters2), a framework for real-time affective interaction with multiple characters (Courgeon and Clavel,2013). MARC features three main modules: facial expressions edition, body gesture edition, and real-time interactive ren-dering. MARC relies on GPU programming (OpenGL/GLSL) to render in real-time detailed models and realistic skin lighting (shadow casting, simulation of light diffusion through skin). The MARC architecture also provides a character lip-synch functionality based on a pre-analysis of the speech wave file. The integration of MARC in the SMART-I2is described in (Courgeon et al.,2010).
2.3. Audiovisual material
The visual material consisted of one MARC character (Simon) in a scene depicting an apartment (Fig.4). The point of view was chosen so that the character’s mouth was at the height of the SMART-I2’s actuators, to avoid any
vertical discrepancy. The scene was rendered at a 1:1 scale, i.e. life-size.
The audio material contained two signals. The first signal was the speech pronounced by the virtual character. There were two different five-second long sentences from two tales selected from a corpus (Doukhan et al.,2011). Whatever the sound position, the level of the stimuli was adjusted at 52 dBA RMS at S1.
1www.sonicemotion.com, last accessed: 2013/09/03.
C C C C C C 2.6 m 2 m * * * * S
Figure 3: Schematic view of the SMART-I2.J: WFS actuators, C: Infrared cameras, S: Subwoofer, ∗: Surround speakers. The WFS actuators and the screens are co-located in depth. The actuators are invisible to the viewers.
Figure 4: Photo of the experimental setup showing the three bar stools and a projected s-3D image.
The second signal was that of the background ambience. It was made up of several decorrelated recordings made on a street of New York City. The positions Bg of the virtual sound sources and the decorrelation of the signals prevented the subjects from localizing the position of the ambience. The level of the ambience was fixed at 48 dBA
RMS at S1. The speech and background ambience were loud enough relative to the ambient noise in the room (33 dBA
RMS). The SNR was therefore either 19 dBA (for NOBG) or 4 dBA (for BG).
The visual content was played continuously throughout the trial sessions, and the background ambient noise level was adjusted as a stimulus value.
2.4. Experimental task
In order to make efficient use of the installation and minimize total experimental time, up to three participants took part in each experimental session. Each participant sat successively at the three positions S1to S3(not necessarily in
this order). The participants were first provided with written instructions regarding the experiment. They wore passive linear polarizing s-3D glasses and received a Wiimote (the Nintendo Wii controller) as a reporting interface. There was no physical restriction on their head movement.
Each experimental session consisted of three consecutive blocks to allow for each participant to sit at the three different positions. Each block consisted of 48 trials for data collection, corresponding to six sound positions, two values of background level, and four repetitions of each combination. The first block started with a training session to make sure that the participants understood the task. This training alternated between two situations: sound at the correct position (A®) and sound at the control position (Ac). The order of the stimuli was randomized in each block.
Each value of the repetition factor was associated with one of two different speech sentences, alternating between the two. This was done to avoid monotony during the experiment. Each trial started with a five-second stimulus followed by a five-second period during which subjects answered the question “Is the voice coherent with the character’s position?” by pressing a button of the Wiimote. The number of repetitions was chosen to keep the experiment short (about 15 min per block, 60 min in total). The stimuli in each block were played in an automated manner, with the subjects being observed remotely. Five-minute rest periods were granted between each block.
2.5. Modeling of the psychometric function
When dealing with psychometric data, it is customary to use the following expression which relates the stimulus value x to the psychometric function ψ(x) (Wichmann and Hill,2001a)
ψ(x) = γ + (1− γ − λ)F (x; α, β) (4)
In the case of a yes/no paradigm such as in the method used here, the response ψ is the proportion of “yes” answers, and the parameters α and β determines the shape of the sigmoid curve F , which takes values in [0, 1]. γ is the guessing rate, which is a free parameter in a yes/no task, and λ is the lapse rate, which is the fraction of recordings where subjects respond independently of the stimulus level. The values of γ and λ are of secondary interest because they characterize the stimulus-independent behavior of the subjects.
Several expressions can be used for the sigmoid F . The logistic function is the default in psignifit, a maximum-likelihood estimation software (Wichmann and Hill,2001a). It is defined as:
F (x; α, β) = 1
1 + e−x−αβ
(5) It is assumed that the sigmoid curve F accounts for the psychological process of interest. However, the performance of the subjects is better understood in terms of the threshold at a certain performance level and the slope of the curve at the same point. With a yes/no paradigm, the threshold is taken as the point of subjective equivalence (PSE), which is the point where F hits 0.5 (Treutwein,1995). The threshold is therefore the stimulus value at which the subjects answer “yes” half of the time. The slope determines how strongly this judgment varies with the stimulus value. A large slope (in absolute value) means that the threshold separates clearly the stimuli into two categories. In this work, the stimulus value is the angular error between the sound and the image. As such, the design of the experiment results in a curve with a negative slope (see Figs.5and6for examples of the sigmoid curve). Therefore, subjects are more likely to answer “yes” for stimulus values below the threshold, and “no” for values above it. Note that we will always report the slope at the PSE.
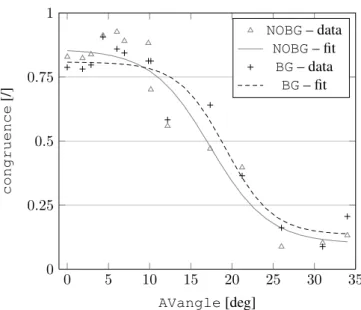
0 5 10 15 20 25 30 35 0 0.25 0.5 0.75 1 AVangle[deg] congruence [/] NOBG– data NOBG– fit BG– data BG– fit
Figure 5: Mean responses over all participants for each condition and associated psychometric functions.
3. Results
This section presents the results of the statistical analysis carried out on the answers from the participants. The answers “yes” and “no” are coded as 1 and 0, respectively. The mean score averaged over all participants is called congruence.
3.1. Panel performance and outliers detection
Our goal here is to analyze the participants’ responses and to evaluate their performance. As a starting point, the psychometric function was fitted using psignifit version 2.5.63(Wichmann and Hill,2001a). Since this tool allows fitting with respect to only one variable, the data was split according to each value of background (NOBG and BG).
By default, the parameters γ and λ (see Eq.4) were each constrained to be in the interval [0, 0.05]. But the algorithm gave results on the upper extremity of the interval. So this interval was increased to [0, 0.2] in order to obtain correct estimated values. The results are shown in Fig.5.
An unexpectedly high value was obtained for the largest value of AVangle (34◦). This value corresponded to the
control case at position S3. The proximity of both the source and the listener to the extremity of the panel was judged
to have played a role in this result. The data corresponding to this configuration was therefore discarded from the rest of the analysis to avoid an underestimation of the slopes.
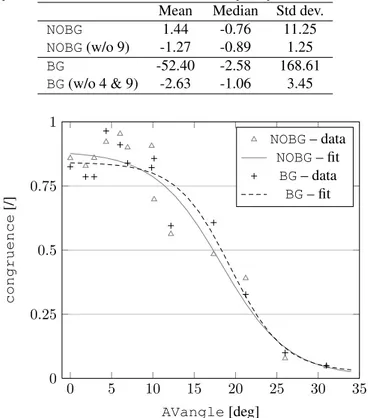
With the highest value of AVangle discarded, the performance of each participant was evaluated. The data for each participant was analyzed separately, and the corresponding fits were obtained using the same constraints on the curve parameters. In Tab.3, the normal parameter estimates of the distribution of β are given. This parameter is related to the slope of the psychometric curve at AVangle = α. The large standard deviation, as well as the difference between the means and the medians, suggested the presence of outliers.
A criterion based on the Median Absolute Deviation (MAD), less sensitive to the presence of outliers than the standard deviation, was used as an alternative to the more traditional standard deviation criterion (Leys et al.,2013). The MAD is defined as
MAD = b median i n βi− ˜β o (6) where ˜βis the median of the dataset, and b = 1.4826 is a coefficient linked to the assumed normality of the data. The threshold for rejecting a measurement was set at 3 (a very conservative value). A non-outlier value should therefore
Table 3: Normal parameter estimates of the distribution of β over participants for each level of background.
Mean Median Std dev.
NOBG 1.44 -0.76 11.25 NOBG(w/o 9) -1.27 -0.89 1.25 BG -52.40 -2.58 168.61 BG(w/o 4 & 9) -2.63 -1.06 3.45 0 5 10 15 20 25 30 35 0 0.25 0.5 0.75 1 AVangle[deg] congruence [/] NOBG– data NOBG– fit BG– data BG– fit
Figure 6: Mean responses over all participants for each condition and associated psychometric functions, discarding the outliers. lie in the range
˜
β− 3MAD < βi< ˜β + 3MAD (7)
In condition NOBG (MAD = 1.26), participant 9 was clearly an outlier with a β value of 44.83. In condition BG(MAD = 3.34), participant 9 was again an outlier (β = −162.06), and this was also the case for participant 4 (β = −689.21). In both cases, the associated threshold was above the considered range of AVangle. The data from participant 9 for BG and NOBG and the data from participant 4 for BG were not retained in the subsequent analysis.
In summary, the following data was discarded: the largest value of AVangle, the results from participant 4 for BG, and all the results from participant 9. The abnormal slopes obtained indicates that these two participants did not perform the task correctly.
3.2. Main analysis
Psychometric functions were fitted using psignifit after removing the outliers from the data. Confidence intervals were found by the BCabootstrap method implemented in the package psignifit, based on 10000
simu-lations (Wichmann and Hill,2001b). The fits corresponding to the two values of background, along with the data points, are plotted in Fig.6. The four parameters (α, β, γ, and λ) of the fits are given in Tab.4along with the deviance on each fit. The deviance is a measure of goodness-of-fit, a smaller value indicating a better fit for a given dataset.
The corresponding threshold and slope estimates (as well as their 95% confidence interval) are given in Tab.5. There is an overlap in the confidence intervals of both estimates. Hence, the presence of background noise did not yield a statistical difference between the estimates. Still, the threshold and slope estimates are larger in absolute value in presence of background noise.
Table 4: Parameter estimates from psignifit corresponding to the curves in Fig.6. NOBG BG α[deg] 18.3 19.4 β[deg−1] -4.0 -3.2 γ[/]a 0.009 0.025 λ[/]a 0.115 0.158 Deviance 34.7 24.5
aγand λ are dimension-less
quantities.
Table 5: Estimates of the point of subjective equality (PSE) and the slope of the psychometric curve at that point. Estimate Confidence interval
PSE [deg] NOBG 18.3 [16.8, 19.9]
PSE [deg] BG 19.4 [17.8, 21.0]
Slope [deg−1] NOBG -0.062 [−0.083, −0.046]
Slope [deg−1] BG -0.077 [−0.120, −0.054]
4. Discussion
4.1. General discussion
An increasing angular error AVangle between the sound position and the perceived character position decreased the reported congruence, i.e. the proportion of “yes” answers to the judgment of the spatial congruence between the sound and the image of the character. The presence of background noise increased both the point of subjective equivalence (PSE) and the absolute value of the slope of the psychometric curve. This means that the congruence was maintained at slightly higher angular separations and that the stimuli were separated more clearly into two categories. This effect, however, was not statistically significant.
The window of bimodal integration obtained in this experiment is far larger than those obtained with arbitrary stimuli. In Fig.6, the integration is close to maximum up to about 10◦. In particular laboratory conditions,
how-ever, humans are able to discriminate auditory-visual stimuli discrepant by only 1◦ (Perrott,1993). To the best of
our knowledge, no experiment available so far measured the bimodal minimum angle using WFS. However, data on the minimum audible angle obtained with WFS is available. Start(1997) measured the sound field produced by a single loudspeaker and a virtual source on a WFS loudspeaker array (24 loudspeakers each separated by 11 cm) with a KEMAR dummy head. The stimuli were broadband and band-limited white noises from 100 Hz to 8000 Hz, and from 100 Hz to 1500 Hz, respectively. Then, the recorded (binaural) signals were played to participants through headphones. A 2-AFC paradigm was used to evaluate the minimum audible angle (MAA) for each stimulus. No difference was found between the real and the virtual source, both for the broadband stimulus (MAA = 0.8◦) and the
band-limited stimulus (MAA = 1.1◦). Our experimental method differs from these measuring a minimum
discrim-inable angle in two ways: the stimuli is such that the unity assumption holds, and the participant is asked specifically to focus on the spatial coherence of the stimuli, without any particular previous training. The tasks measuring a minimum discriminable angle rather involves making a left/right judgment on the stimuli after extensive practice.
For angular errors above 10◦, the curve decreases rather sharply, crossing the PSE at 18.3◦and 19.4◦, for NOBG and
BG, respectively. Our results are in agreement with those found in the literature on multimedia perception. Combining an HDTV with ten monaural loudspeakers,Komiyama(1989) showed that non-expert listeners found an angular error of 20◦ acceptable. De Bruijn and Boone(2003) combined standard 2D video and Wave Field Synthesis (WFS) to
build a videoconferencing system. The participants seated off-axis rated as annoying discrepancies of 14◦ and 15◦
between the sound and the image. The thresholds obtained here fall within the range defined by these two references. With a setup similar to that of de Bruijn and Boone, Melchior et al. (2003) used the ITU-R 5 grade-impairment scale (ITU), which they scaled between 0 and 100. The threshold for a slightly disturbing angular error, measured as the 50% crossing on the psychometric curve, was between 5 and 7◦ for various audiovisual source positions.
However, the participants to this experiment were trained to detect small audiovisual discrepancies. Melchior et al.
(2006) considered an augmented reality system consisting of a Head-Mounted Display (HMD) with s-3D video and WFS. The same scale as used byMelchior et al.(2003) was used. It was not indicated in the study whether, or how, the subjects were trained. The reported threshold was approximately 4 to 6◦ (on-axis) and 6 to 8◦ (off-axis). We
argue that the results reported in the last two studies were obtained with participants that were not completely naive with respect to the localization task, which explains the lower thresholds. Nonetheless, it is interesting to note that the average performance of the participants in these experiments was around 90% in the reference case, when the sound matched the image. This is only slightly better than the value obtained here, i.e. around 80%.
4.2. Impact of the ambient noise level on the bimodal integration
The non-significant effect of the background ambient noise level can be explained by the relatively high SNR used in our experiment. Motivated by the cinema context, we chose to favor speech intelligibility over a high noise level. This resulted in an SNR that was too high to observe any significant degradation in sound localization.Lorenzi et al.(1999) found that subject localization accuracy remained unaffected by noise at positive signal-to-noise ratios (SNRs), with a signal level at 70 dB SP L. A similar conclusion was drawn byGood and Gilkey(1996), where the SNRs were relative to the subject detection threshold when both the signal and the masker were coming from the same speaker. The error in the left/right dimension increased only when the SNRs were negative. In an experiment using headphones,Braasch and Hartung (2002) found no difference in localization performance with and without a distractor in the frontal direction with 0 dB SNR (signal at 70 dB SP L). This conclusion was shown both in an anechoic and reverberant environment. All three studies showed that the accuracy of localization judgments decreased only when the SNR became negative.
The results fromLorenzi et al.(1999) also provide some insight on the localization performance which can be expected with more than one source present at a time. Indeed, the researchers tested three different locations of the masker: at the left, at the front, and at the right of the listener. At positive SNRs, the localization accuracy was independent of the masker location. It seems, therefore, that the level of the most important sound sources in the scene should always be superior to the level of less important sources in the background. This would guarantee the best localization performance of the important sources.
4.3. Audiovisual spatial and time coherence in a movie theater
In this section, the results are discussed in a cinema context. We consider a movie theater with the following dimensions: distance of 28 m between the side walls, distance of 30 m from the screen to the back wall, screen width of 12 m, first row at 6 m from the screen, ideal viewpoint (our origin of axes) at 18 m from the screen, equidistant from the side walls. Sound sources are reproduced at the intended position of the visual object through Wave Field Synthesis and are therefore perceived all over the room at the intended position.
The audiovisual source, V1in our example is obtained with a visual stimulus on the screen that has a parallax of
2 cm, so that the geometrical model used byÉvrard et al.(2011) is applicable. In Fig.7(a), the value of the angular error between the sound and the image is shown for all possible location in this theater when the parallax is positive (the source appears behind the screen). The angular error is the largest near the side walls and close to the screen. Because of the geometry, the values are always symmetric with respect to the line joining S1and V1. In Fig.7(c), the
value of the angular error resulting from a negative parallax is shown (the source appears in front of the screen). The angular error is increased with respect to the previous case. The largest values are still found at the same location. In Fig.7(d), the value of the angular error is shown when a positive parallax is combined with a 2 m shift to the right on the screen (the source still appears behind the screen). Compared to the first case, the value of the angular error still increases closer to the screen. Because the angle values are symmetric with respect to the S1V1line and the seats
are vertical lines in the figure, the largest values are found at the top of the figure. The magnitude of the error is comparable to that of Fig.7(a).
In Fig.7(b), the time delay perceived at each location with respect to the ideal viewpoint is also shown. These values fall in the temporal integration window found in the literature (Lewald and Guski,2003;van Wassenhove et al.,
2007).
In Fig.7(a), about 95% of the possible seating area of the cinema theater is below the threshold of 19.4◦. The
2 2 2 2 2 2 6 6 6 6 6 6 10 10 10 10 14 14 14 14 22 22 19 .4 19 .4 screen V1 S1 −10 −5 0 5 10 −10 −5 0 5 10 5 10 15 20
(a) Angular error [deg]
− 28 .2 −21 .1 − 21 .1 −14 − 14 −7 − 7 0.1 0 .1 7.2 7 .2 14 .3 14 .3 21 .4 21 .4 28 .5 28 .5 screen V1 S1 −10 −5 0 5 10 −10 −5 0 5 10 −20 −10 0 10 20 (b) Time delay [ms] 2 2 2 2 2 2 6 6 6 6 6 6 10 10 10 10 14 14 14 14 28 28 19 .4 19 .4 screen V1 S1 −10 −5 0 5 10 −10 −5 0 5 10 5 10 15 20 25
(c) Angular error [deg]
2 2 2 2 2 2 2 6 6 6 6 6 6 6 10 10 10 10 14 14 14 14 22 19 .4 19 .4 screen V1 S1 −10 −5 0 5 10 −10 −5 0 5 10 5 10 15 20
(d) Angular error [deg]
Figure 7: Layout of a movie theater with overlayed curves of(a),(c),(d)constant angular error and(b)time delay at each location compared to the ideal viewpoint S1, the origin of axis (dimensions in m). The audiovisual source V1is obtained with a visual stimulus on the screen that has a parallax of(a),(b)2 cm,(c)-2 cm, and(d)2 cm, combined with a shift of the stimulus 2 m to the right of the screen. The dashed line in(a),(c), and(d)corresponds to the threshold of 19.4◦in presence of background noise.
the impact of the time delay found in Fig.7(b), which is always below 50 ms in absolute value, should be minimal, according toSlutsky and Recanzone(2001). By comparison, the largest time delay in our experiment was 3.4 ms.
If still desired, one way to increase the sweet-spot for correct reproduction is to shrink the audio space towards the screen. The three congruence measures at the lowest stimulus values each correspond to a different seat and were obtained with the sound located at A¬, nearest to the screen. The reported feeling of congruence at these angles
of error was maximal and relatively independent of the participant position. This indicates that the method illustrated in Fig.1is adequate to improve the audiovisual congruence when accurate spatial sound is used in combination with s-3D images.
5. Conclusion
A study of the auditory-visual spatial integration of 3D multimedia content by naive subjects is presented. The audiovisual rendering was provided by a combination of passive stereoscopic 3D (s-3D) imaging and acoustic Wave Field Synthesis (WFS).
A subjective experiment was carried out where an angular error between an s-3D video and a spatially accurate sound reproduced through WFS was presented to naive subjects. Motivated by a cinema application, we chose a stimulus consisting of a talking character in an apartment scene. The psychometric curve was obtained with the method of constant stimuli, and the threshold of bimodal integration was estimated. After a five-second speech stimulus, subjects gave their answer to the question “Is the voice coherent with the character’s position?” The ambient noise level was varied as an independent variable with two levels. The point of subjective equivalence (PSE), where the subjects answered “yes” half of the time, was 18.3◦ when only the speech signal was present, and 19.4◦ when
additional ambient noise was present, with a SNR of 4 dBA. These values are much higher than the minimum audible angle obtained in particular laboratory conditions and reported in the literature. Differences in experimental design that lead to this result are discussed.
In addition to the slight threshold increase with ambient noise, an increase in the absolute value of the slope was observed. This means that the feeling of congruence was maintained at higher separation angles and that the stimuli were separated more clearly into two categories. These effects, however, were not statistically significant. We argue that this was because the SNR was too high to observe any significant degradation in sound localization.
The Wave Field Synthesis employed in the experiments offers optimum localization accuracy but employed a large, impractical number of loudspeakers (one every 20 cm) for a large installation. The results indicated that au-diovisual spatial congruency was obtained with rather large angular disparities (' 19◦). Practical 2D or 3D Wave
Field Synthesis applications consisting of sparse loudspeaker arrays, as described byCorteel et al.(2012), offer good, though non-ideal, localization accuracy over an extensive listening area. The limited localization error provided by such practical systems should therefore offer a similar level of audiovisual spatial congruency maintaining the benefits of Wave Field Synthesis (consistency of spatial impression over a large listening area, limited perception of individ-ual loudspeakers, power efficient rendering through the use of multiple loudspeakers for each source position) with a realistic installation complexity (once or twice the number of loudspeakers of today’s installations). Nonetheless, the method consisting of compressing the audio towards the screen was proven to be adequate when accurate spatial sound was used in combination with s-3D video.
Further studies should consider spatial congruence for audiovisual disparities in the vertical plane using either 3D Wave Field Synthesis and/or other 3D audio rendering techniques by simulating different characters at different heights. The audio-visual coherence evaluation of several concurrently active sources should also be studied. Acknowledgments
This work was performed in the course of a visiting researcher exchange of the first author at the LIMSI-CNRS. The authors thank all the volunteers who took part in the experiment, sonic emotion for providing the Wave 1 WFS rendering engine, and the anonymous reviewers for their constructive comments, which helped us to improve the manuscript. Special thanks are given to Matthieu Courgeon for time spent on the visual rendering in MARC. References
Alais, D., Burr, D., 2004. The ventriloquist effect results from near-optimal bimodal integration. Curr. Biol. 14, 257–262. doi:10.1016/j.cub. 2004.01.029.
André, C.R., Embrechts, J.J., Verly, J.G., 2010. Adding 3D sound to 3D cinema: Identification and evaluation of different reproduction techniques, in: Proc. 2ndInt. Conf. on Audio Language and Image Processing (ICALIP 2010), pp. 130–137. doi:10.1109/ICALIP.2010.5684993.
André, C.R., Rébillat, M., Embrechts, J.J., Verly, J.G., Katz, B.F.G., 2012. Sound for 3D cinema and the sense of presence, in: Proc. of the 18th Int. Conf. on Auditory Display (ICAD 2012), Atlanta, GA. pp. 14–21.
Battaglia, P.W., Jacobs, R.A., Aslin, R.N., 2003. Bayesian integration of visual and auditory signals for spatial localization. J. Opt. Soc. Am. 20, 1391–1397. doi:10.1364/JOSAA.20.001391.
Berkhout, A.J., 1988. A holographic approach to acoustic control. J. Audio Eng. Soc. 36, 977–995.
Braasch, J., Hartung, K., 2002. Localization in the presence of a distracter and reverberation in the frontal horizontal plane. I. Psychoacoustical data. Acta Acust. united with Acust. 88, 942–955.
de Bruijn, W.P.J., Boone, M.M., 2003. Application of Wave Field Synthesis in life-size videoconferencing, in: Audio Eng. Soc. Conv. 114. Corteel, É., 2006. On the use of irregularly spaced loudspeaker arrays for Wave Field Synthesis, potential impact on spatial aliasing frequency, in:
Proc. 9th Int. Conf. on Digital Audio Effects (DAFx’06), Montréal, Canada.
Corteel, É., Rohr, L., Falourd, X., NGuyen, K.V., Lissek, H., 2012. Practical 3-dimensional sound reproduction using Wave Field Synthesis, theory and perceptual validation, in: Proc. of the 11th French Congr. of Acoustics and 2012 Annu. IOA Meeting, Nantes, France. pp. 895–900. Courgeon, M., Clavel, C., 2013. MARC: a framework that features emotion models for facial animation during human–computer interaction. J.
Multimodal User Interfaces , 1–9. doi:10.1007/s12193-013-0124-1.
Courgeon, M., Rébillat, M., Katz, B.F., Clavel, C., Martin, J.C., 2010. Life-sized audiovisual spatial social scenes with multiple characters: MARC & SMART-I2, in: Proc. of the 5èmesJournées de l’AFRV, Orsay, France.
Dodgson, N.A., 2004. Variation and extrema of human interpupillary distance, in: Proc. of SPIE, San Jose, CA. pp. 36–46. doi:10.1117/12. 529999.
Doukhan, D., Rilliard, A., Rosset, S., Adda-Decker, M., d’Alessandro, C., 2011. Prosodic analysis of a corpus of tales, in: INTERSPEECH–2011, pp. 3129–3132.
Ernst, M.O., Banks, M.S., 2002. Humans integrate visual and haptic information in a statistically optimal fashion. Nature 415, 429–433. doi:10. 1038/415429a.
Évrard, M., André, C.R., Verly, J.G., Embrechts, J.J., Katz, B.F.G., 2011. Object-based sound re-mix for spatially coherent audio rendering of an existing stereoscopic-3D animation movie, in: Audio Eng. Soc. Conv. 131.
Good, M.D., Gilkey, R.H., 1996. Sound localization in noise: The effect of signal-to-noise ratio. J. Acoust. Soc. Am. 99, 1108–1117. doi:10. 1121/1.415233.
ITU, 2003. Recommendation BS.1284. General methods for the subjective assessment of sound quality. ITU-R.
Jackson, C.V., 1953. Visual factors in auditory localization. Q. J. Exp. Psychol. 5, 52–65. doi:10.1080/17470215308416626.
Komiyama, S., 1989. Subjective evaluation of angular displacement between picture and sound directions for HDTV sound systems. J. Audio Eng. Soc. 37, 210–214.
Lam, C.F., Dubno, J.R., Mills, J.H., 1999. Determination of optimal data placement for psychometric function estimation: A computer simulation. J. Acoust. Soc. Am. 106, 1969. doi:10.1121/1.427944.
Lewald, J., Ehrenstein, W.H., Guski, R., 2001. Spatio-temporal constraints for auditory-visual integration. Behav. Brain Res. 121, 69–79. doi:10. 1016/S0166-4328(00)00386-7.
Lewald, J., Guski, R., 2003. Cross-modal perceptual integration of spatially and temporally disparate auditory and visual stimuli. Cognitive Brain Res. 16, 468–478. doi:10.1016/S0926-6410(03)00074-0.
Leys, C., Ley, C., Klein, O., Bernard, P., Licata, L., 2013. Detecting outliers: Do not use standard deviation around the mean, use absolute deviation around the median. J. Exp. Soc. Psychol. 49, 764–766. doi:10.1016/j.jesp.2013.03.013.
Lorenzi, C., Gatehouse, S., Lever, C., 1999. Sound localization in noise in normal-hearing listeners. J. Acoust. Soc. Am. 105, 1810–1820. doi:10.1121/1.426719.
Melchior, F., Brix, S., Sporer, T., Roder, T., Klehs, B., 2003. Wave Field Synthesis in combination with 2D video projection, in: AES 24th International Conference.
Melchior, F., Fischer, J., de Vries, D., 2006. Audiovisual perception using Wave Field Synthesis in combination with augmented reality systems: Horizontal positioning, in: AES 28th International Conference.
Perrott, D.R., 1993. Auditory and Visual Localization: Two Modalities, One World, in: AES 12th International Conference, pp. 221–231. Rébillat, M., Boutillon, X., Corteel, É., Katz, B.F.G., 2012. Audio, visual, and audio-visual egocentric distance perception by moving subjects in
virtual environments. ACM Trans. Appl. Percept. 9, 19:1–19:17. doi:10.1145/2355598.2355602.
Rébillat, M., Corteel, É., Katz, B.F.G., 2008. SMART-I2: Spatial Multi-User Audio-Visual Real Time Interactive Interface, in: Audio Eng. Soc. Conv. 125.
Rébillat, M., Katz, B.F.G., Corteel, É., 2009. SMART-I2: “Spatial multi-user audio-visual real-time interactive interface”, A broadcast application context, in: Proc. of the 3DTV Conf., Potsdam, Germany. doi:10.1109/3DTV.2009.5069682.
Slutsky, D.A., Recanzone, G.H., 2001. Temporal and spatial dependency of the ventriloquism effect. Neuroreport 12, 7–10. pmid:11201094. Start, E.W., 1997. Direct Sound Enhancement by Wave Field Synthesis. Ph.D. thesis. TU Delft. The Nederlands.
Theile, G., Wittek, H., Reisinger, M., 2003. Potential Wavefield Synthesis Applications in the Multichannel Stereophonic World, in: AES 24th Int. Conf.
Thurlow, W.R., Jack, C.E., 1973. Certain determinants of the “ventriloquism effect”. Percept. Motor Skill 36, 1171–1184. doi:10.2466/pms. 1973.36.3c.1171.
Treutwein, B., 1995. Adaptive psychophysical procedures. Vision research 35, 2503–2522. pmid:8594817. Verheijen, E.N.G., 1998. Sound reproduction by Wave Field Synthesis. Ph.D. thesis. Delft University of Technology.
van Wassenhove, V., Grant, K.W., Poeppel, D., 2007. Temporal window of integration in auditory-visual speech perception. Neuropsychologia 45, 598–607. doi:10.1016/j.neuropsychologia.2006.01.001.
Welch, R.B., 1999. Meaning, attention, and the “unity assumption” in the intersensory bias of spatial and temporal perceptions, in: Cognitive Contributions to the Perception of Spatial and Temporal Events. Elsevier Science, pp. 371–387.
Wichmann, F.A., Hill, N.J., 2001a. The psychometric function: I. Fitting, sampling, and goodness of fit. Percept. Psychophys. 63, 1293–1313. pmid:11800458.
Wichmann, F.A., Hill, N.J., 2001b. The psychometric function: II. Bootstrap-based confidence intervals and sampling. Percept. Psychophys. 63, 1314–1329. pmid:11800459.
Zahorik, P., Brungart, D.S., Bronkhorst, A.W., 2005. Auditory distance perception in humans: A summary of past and present research. Acta Acust. united with Acust. 91, 409–420(12).


![Table 4: Parameter estimates from psignifit corresponding to the curves in Fig. 6. NOBG BG α [deg] 18.3 19.4 β [deg −1 ] -4.0 -3.2 γ [/] a 0.009 0.025 λ [/] a 0.115 0.158 Deviance 34.7 24.5](https://thumb-eu.123doks.com/thumbv2/123doknet/6019229.150339/11.892.265.638.409.496/table-parameter-estimates-psignifit-corresponding-curves-nobg-deviance.webp)

