i
La manipulation des ressources alimentaires et du
risque de prédation afin d’augmenter la
vulnérabilité du cerf de Virginie à la chasse
Mémoire
Nicolas Houde
Maîtrise en biologie
Maître ès sciences (M. Sc.)
Québec, Canada
© Nicolas Houde, 2016
ii
La manipulation des ressources alimentaires et du
risque de prédation afin d’augmenter la
vulnérabilité du cerf de Virginie à la chasse
Mémoire
Nicolas Houde
Sous la direction de :
Jean-Pierre Tremblay, directeur de recherche
Steeve D. Côté, codirecteur de recherche
iii
RÉSUMÉ
L’utilisation de l’espace par une proie herbivore est souvent modulée par le compromis entre l’acquisition de fourrage et l’évitement de la prédation. Nous avons testé l’effet de la manipulation de la disponibilité de fourrage et du ratio couvert forestier/ouverture sur l’utilisation de l’espace par le cerf de Virginie (Odocoileus virginianus) et sa vulnérabilité à la chasse sportive sur l’île d’Anticosti. Nos résultats ont démontré que l’utilisation de l’espace par le cerf et sa vulnérabilité à la chasse peuvent être modifiées par différentes composantes structurales de l’habitat. L’augmentation de la disponibilité de fourrage a entrainé une plus grande utilisation des prairies fertilisées par le cerf, tandis que la diminution du ratio couvert forestier/ouverture a augmenté sa vulnérabilité à la chasse. Ces résultats procurent des pistes de solutions pour les gestionnaires fauniques qui doivent à la fois réduire les dommages causés par les hautes densités de cerfs et satisfaire les chasseurs en maintenant un nombre élevé d’observation de cerfs.
iv
ABSTRACT
A trade-off between forage acquisition and predation avoidance often drives space use by prey herbivores. We tested the effects of manipulating forage production and residual forest cover on white-tailed deer (Odocoileus virginianus) space use and vulnerability to hunting on Anticosti Island. Our results demonstrated that deer space use and deer vulnerability to hunting could be modified by different structural components of the habitat. Forage productivity led to higher deer use of managed habitats, whereas decreased residual forest cover increased deer vulnerability to hunting. These results provide useful insights for wildlife managers who have to deal with conflicting goals such as maintaining hunter satisfaction with increased observations of deer while reducing deer densities which are
v
TABLE DES MATIÈRES
RÉSUMÉ ... iii
ABSTRACT ... iv
TABLE DES MATIÈRES ... v
LISTE DES TABLEAUX ... vii
LISTE DES FIGURES ... ix
LISTE DES APPENDICES ... xi
REMERCIEMENTS ... xiii
AVANT-PROPOS ... xviii
INTRODUCTION GÉNÉRALE ... 1
Objectifs, hypothèses et prédictions ... 3
CHAPITRE PRINCIPAL ... 4
Manipulating forage availability and predation risk to increase white-tailed deer vulnerability to hunters. ... 4 RÉSUMÉ ... 5 ABSTRACT ... 6 STUDY AREA ... 9 METHODS ... 10 Experimental design ... 10 Field fertilization ... 12
Forage production and quality ... 12
Hiding cover ... 13
Deer use of the experimental design... 13
Deer vulnerability to hunters ... 14
Body condition of harvested deer ... 14
Data analyses ... 15
Verification of postulates... 15
Effects of treatments ... 15
Experimental design vs. controls ... 16
vi
Forage production and quality ... 16
Deer use of the experimental design... 18
Deer vulnerability to hunters ... 20
Body condition of harvested deer ... 23
DISCUSSION ... 25
Forage availability ... 25
Residual forest cover ... 27
Managed vs. natural landscapes ... 27
MANAGEMENT IMPLICATIONS ... 28
ACKNOWLEDGMENTS ... 29
CONCLUSION GÉNÉRALE ... 30
Avantages et limites de notre étude ... 32
Réflexions économiques et environnementales ... 33
BIBLIOGRAPHIE ... 35
APPENDIX A ... 42
APPENDIX B ... 43
APPENDIX C ... 44
vii
LISTE DES TABLEAUX
Table 1. Effects of fertilization, year, and their interaction on forage production, foliar nitrogen (N) and neutral detergent fiber (NDF) concentrations in experimental fields on Anticosti Island, Québec, Canada. We conducted an experiment corresponding to a completely randomized block design with 16 experimental units in 4 blocks involving a 2-level treatment of fertilization (fertilized and unfertilized) over 2 years (2013, 2014). Forage was collected in 2 4-m2 exclosures per unit each fall. We performed analyses with general linear mixed models (GLMM) with blocks and exclosures as random factors and year as a repeated measure…... ... 21 Table 2. Effects of fertilization, residual forest cover, year, and their interactions on white-tailed deer use of the experimental design and on deer vulnerability to hunting in
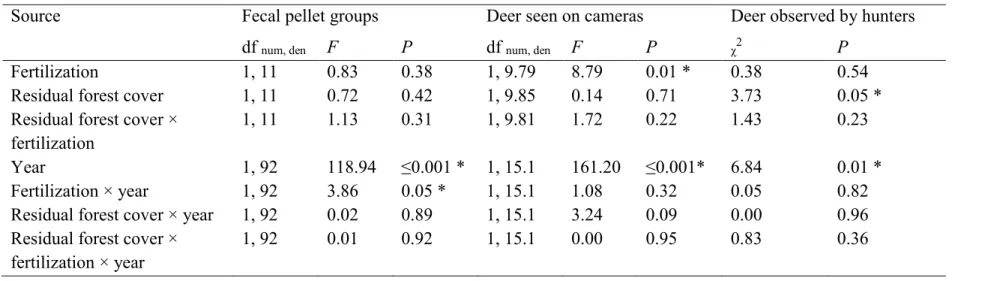
experimental fields on Anticosti Island, Québec, Canada. The experiment is a completely randomized block design with 16 experimental units in 4 blocks involving a 2-level treatment of fertilization (fertilized and unfertilized) and a 2-level treatment of residual forest cover (30-m and 60-m-wide forested strips) over 2 years (2013, 2014). Deer use was assessed using 6 fecal pellet group transects and 1 or 2 camera traps per unit. Deer use analyses were performed with general linear mixed models. Deer vulnerability to hunting was assessed using observations by hunters and analyzed with generalized estimating equations. ... …22 Table 3. Effects of harvest zone, year, sex, and their interactions on 6 indices of body condition of deer harvested (n=65) through recreational hunting on Anticosti Island,
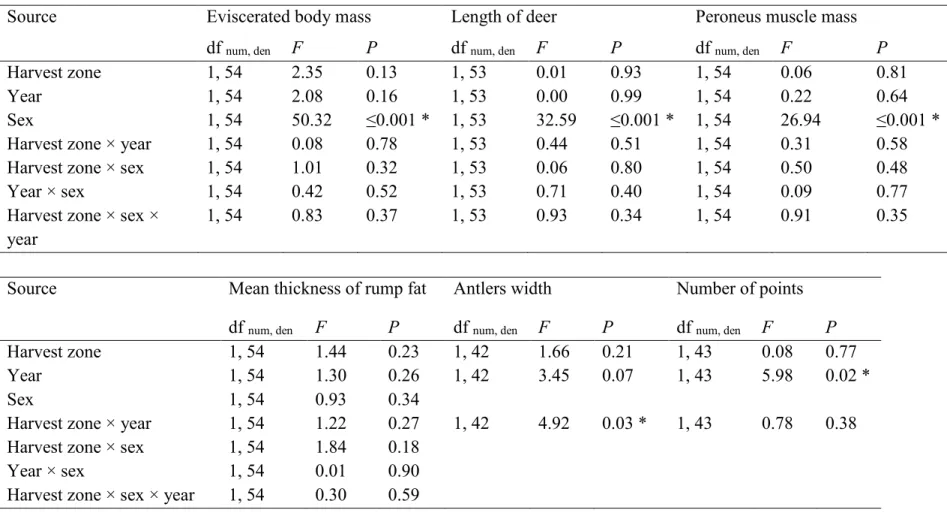
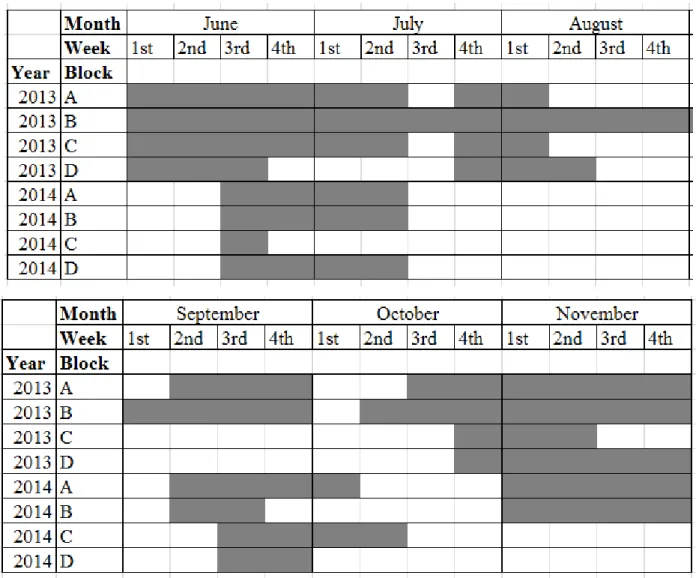
Québec, Canada in 2013 and 2014. Analyses were performed with generalized linear mixed models (GLMM) with harvest zone (experimental design or controls), year, sex, and their interactions as explanatory variables, and harvest date and deer age as covariates ... 24 Table A 1. Number of pictures taken per camera during periods for which all cameras within a block worked without technical problems and the number of deer seen within these periods. We set the camera traps to systematically trigger each 30 min during daylight from June to November……….…... 42 Table B 1. Periods for which all cameras within a block worked without technical problems for both years (grey cells) in experimental fields on Anticosti Island, Québec, Canada… 43 Table D 1. Mean forage production in g/m2 by species or functional groups depending on the combination of the fertilization treatment and the width of forested strips in
experimental fields on Anticosti Island, Québec, Canada. The 30 most abundant species or functional groups were American bracken (Pteridium aquilinum), aster (Aster ciliolatus, A.
viii
asprellum, G. triflorum), blueberry (Vaccinium angustifolium, V. myrtilloides), Canada
mayflower (Maianthemum canadense), Canadian bunchberry (Cornus canadensis), Canadian burnet (Sanguisorba canadensis), coltsfoot (Tussilago farfara, Petasites
palmatus), common dandelion (Taraxacum officinale), Creeping snowberry (Gaultheria hispidula), everlasting (Anaphalis margaritacea), false violet (Dalibarda repens), grasses
(Danthonia spicata, Calamagrostis canadensis, Bromus ciliates, Panic sp. and 8 other species), hawkweed (Hieracium pratense, Hieracium sp.), horsetail (Equisetum arvense, E.
scirpoides, E. variegatum), iris (Iris versicolor), Labrador tea (Ledum groenlandicum),
naked miterwort (Mitella nuda), pussytoes (Antennaria sp.), raspberry (Rubus idaeus, R.
pubescens), sheep laurel (Kalmia angustifolia), star flower (Trientalis borealis), strawberry
(Fragaria sp.), sweet gale (Myrica gale), thistle (Cirsium arvense, C. vulgare), threeleaf goldthread (Coptis trifolia), trailing arbutus (Epigaea repens), twinflower (Linnaea
borealis) and violet (Viola sp.)………... 45
Table D 2. Correlation matrix of the 4 treatment combinations and their mean forage production for the 30 most abundant species or functional groups in experimental fields on Anticosti Island, Québec, Canada. The 4 treatment combinations are fertilized fields and 30-m-wide forested strips (F30), fertilized fields and 60-m-wide forested strips (F60), unfertilized fields and 30-m-wide forested strips (U30), unfertilized fields and 60-m-wide forested strips (U60). ... 46
ix
LISTE DES FIGURES
Figure 1. a) Experimental design illustrating the 4 replicated experimental blocks and their respective control. Dotted lines mark the block assignation of each fertilized and
unfertilized units. Units with 60-m-wide forested strips have larger icons than units with 30-m-wide forested strips (not to scale). Black lines represent the network of trails between units. Blocks A and B are located 7 km east of blocks C and D. b) Picture of an
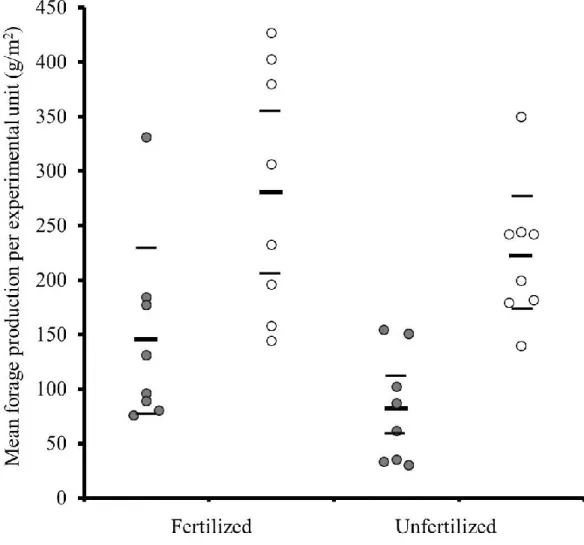
experimental unit in spring at year 1 of the study with the 4 10 × 200-m fields separated by 3 30-m-wide forested strips. c) Representation of all measurement procedures established in an experimental unit (not to scale): 2 2 × 2-m deer exclosures within open fields (rectangles in white area), 6 4 × 80-m fecal pellet group transects in forested strips (lines in grey area), and 1 or 2 camera traps within fields (triangles). ... 12 Figure 2. Forage production tended to be higher in fertilized fields than in unfertilized fields and it increased from year 1 (grey dots) to year 2 (white dots) in all experimental fields on Anticosti Island, Québec, Canada. Each dot represents the annual mean of 2 exclosures per experimental unit and the black horizontal bars represent the overall mean of every combination of fertilization and year with the 95% CI (thinner bars). ... 17 Figure 3. From year 1 (grey dots) to year 2 (white dots), the concentration of neutral
detergent fiber (NDF) significantly increased in unfertilized fields, but not in fertilized fields, on Anticosti Island, Québec, Canada. Each dot represents the annual mean of two exclosures per unit. Black bars represent the overall mean of every combination of
fertilization and year with the 95% CI (thinner bars). ... 18 Figure 4. The effect of fertilization changed from not significant in year 1 (grey dots) to a statistical trend in year 2 (white dots) with 44% more fecal pellet groups in fertilized units compared to unfertilized units on Anticosti Island, Québec, Canada. Each dot represents the annual mean of the 6 transects per experimental unit and the black bars represent the
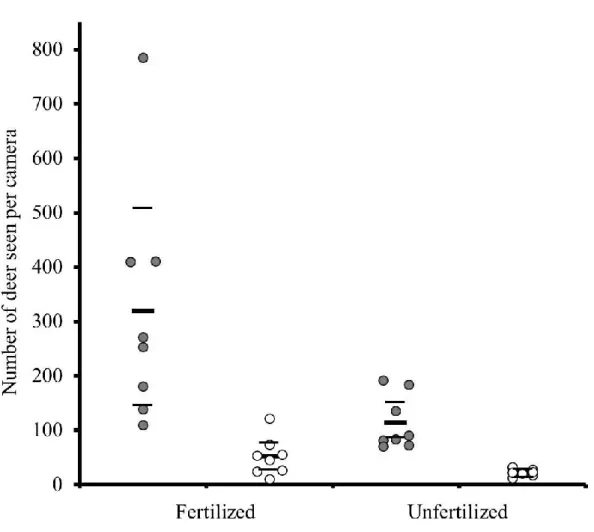
overall mean of every combination of fertilization and year with the 95% CI (thinner bars). ... 19 Figure 5. The number of white-tailed deer seen per camera was higher in fertilized fields than in unfertilized fields in both years on Anticosti Island, Québec, Canada. From year 1 (grey dots) to year 2 (white dots), the number of deer seen per camera declined in all experimental fields. Each dot represents the annual mean of 1 or 2 cameras per unit and the black bars represent the mean of every combination of year and fertilization with the 95% CI (thinner bars). The fertilization effect is maintained when removing the outlier. ... 20 Figure 6. Exemples d’organisation des prairies artificielles dans le paysage forestier. ... 33
x
Figure C 1. Mean forage production by species varied depending on year and fertilization treatment in experimental fields on Anticosti Island, Québec, Canada. The most abundant species or functional groups were grasses (Danthonia spicata, Calamagrostis canadensis,
Bromus ciliates, Panic sp. and 8 other species), American bracken (Pteridium aquilinum),
Canadian bunchberry (Cornus canadensis), blueberry (Vaccinium angustifolium, V.
myrtilloides), thistle (Cirsium arvense, C. vulgare), raspberry (Rubus idaeus, R. pubescens),
sweet gale (Myrica gale), hawkweed (Hieracium pratense, Hieracium sp.), coltsfoot (Tussilago farfara), Canadian burnet (Sanguisorba canadensis). ... 44
xi
LISTE DES APPENDICES
Appendix A. Number of pictures taken per camera during periods for which all cameras within a block worked without technical problems and the number of deer seen within these periods……….……….42
Appendix B. Periods for which all cameras within a block worked without technical problems for both years (grey cells) in experimental fields on Anticosti Island, Québec, Canada……….…………43 Appendix C. Mean forage production by species in g/m2 depending on year and
fertilization treatment in experimental fields on Anticosti Island, Québec, Canada………...…..44 Appendix D Mean forage production by species in g/m2 depending on the
combination of the fertilization treatment and the width of forested strips in experimental fields on Anticosti Island, Québec, Canada..45
xii
xiii
REMERCIEMENTS
Pendant les 3 dernières années, j’ai souvent dit que faire une maîtrise c’était comme courir un marathon. À vrai dire, je n’ai jamais couru de marathon dans ma vie alors je ne peux pas certifier l’exactitude de ma comparaison, mais j’imagine que la clé pour finir un marathon (comme pour une maîtrise) c’est de garder le rythme et d’éviter de s’arrêter trop longtemps. Maintenant que je vois la ligne d’arrivée, je peux dire que j’en ai parcouru du ‘milage’ et qu’il a fallu adapter mon pas de course aux différents types de terrain. Tout au long de la course, plusieurs personnes sont venues me donner des tapes dans le dos, des gorgées d’eau, des conseils techniques. Certaines personnes ont même fait des longs bouts de la course avec moi. Je me dois de remercier tous ces gens car l’épreuve aurait été bien plus difficile sans eux.
Un des meilleurs trucs que j’ai découvert pour faire un marathon, c’est de s’entourer de marathoniens d’expérience. Je dois remercier mon directeur Jean-Pierre Tremblay et mon codirecteur Steeve D. Côté qui m’ont ‘tapé la trail’ et montré le chemin à de multiples reprises. Quel duo complémentaire vous formez vous deux! Premièrement, Jean-Pierre, tu es un excellent scientifique mais encore plus important, tu es un être humain exceptionnel! Toujours intéressé par mes découvertes et mes questionnements, tu as l’incroyable faculté de remettre les choses en perspective afin de faire ressortir le positif. Dans ton travail scientifique, tu te sers de cette capacité à changer d’angle de vue et cela te permet de rebondir sur de nouvelles idées. Proactif, tu es quelqu’un qui vit dans le mouvement, alors que ta pensée trotte toujours quelques mètres en avant. Tu es un athlète inspirant avec qui j'ai eu le plaisir de courir! Deuxièmement, Steeve, tu es sans aucun doute une sommité dans ton domaine de recherche. On comprend bien vite en te regardant aller que ta rigueur, ta ténacité, ton esprit vif, à la fois méthodique et fonceur t’ont permis de te rendre au sommet. Avec tes nombreux encouragements prodigués tout au long de ma maîtrise, tu m’auras sans doute transmis un peu de ta ténacité et de ta rigueur. Malgré ton horaire chargé, tu restes une personne accessible et disponible pour les autres. Tu ne m’as jamais refusé ton aide et tu es toujours prêt pour un brin de jasette. Finalement, ta confiance en soi est si grande qu’elle jaillit sur les autres et l'on se sent bien entouré en ta compagnie. Avec Jean-Pierre et Steeve, je commencerais demain un pentathlon et je n’aurais aucun doute sur mes chances de réussir.
xiv
Le duo Tremblay-Côté a perdu un gros morceau lors du départ de la professionnelle de recherche Sonia de Bellefeuille. J’ai eu la chance de bénéficier de sa présence pendant les deux premières années de ma maîtrise. Sonia, tu as tellement accompli de travail pour nous! Je ne t’en dois pas une, mais une centaine de mille! Tu veillais sur nous comme sur tes enfants. Tu as un cœur énorme et je te remercie pour tout ton amour.
Une autre force du duo Tremblay-Côté est leur habileté à choisir des étudiants sociables, coopératifs, croyants à l’entraide et à la force de l’union. À mon arrivée à Québec, j’étais très heureux d’être invité à un souper chez Sabrina et Julien ou à une bière chez Alexandre et Chrystel. Je ne connaissais presque personne à Québec et j’étais bien content que le labo Tremblay-Côté ait une vie sociale si active. De plus, les gens du labo ne sont pas avares en conseils et à plusieurs reprises, j’ai pu compter sur eux pour une pratique de présentation ou un avis sur mes analyses statistiques. Merci aux gens du labo qui ont été là depuis le début de mon marathon et qui m’ont souvent supporté : Michael Bonin, Émilie Champagne, Amélie Drolet, Julien Hénault Richard, Mael Le Corre, Patrick Morissette, Sabrina Plante. Merci à tous les autres étudiants du labo qui ont commencé ou terminé leur propre marathon depuis le début du mien : ne lâchez pas, vous êtes tous et toutes des super marathoniens en devenir! Un gros merci aussi à Amélie Drolet qui est l’instigatrice de ma maîtrise, celle qui m’a mis en contact avec Jean-Pierre et Steeve. Sans toi, j’aurais raté toute une expérience. J’en suis énormément reconnaissant!
Ma maîtrise a nécessité plusieurs mois de collecte, de saisie et de traitement de données. Je n’aurais pas réussi cette tâche sans l’aide de nombreux assistants de recherche. Premièrement, merci aux gens avec qui j’ai partagé le travail de terrain : Jonathan Bonin Bourgault, Milène Courchesne, Aimée Benoist-Chénier, Antoine Daignault, Isabelle Bradette, Damien Chassagne, Mathieu Lagrange. Le travail de terrain est la partie du marathon que j’ai préférée et ce fut un réel plaisir de vivre cette partie en votre compagnie! Le camp de la rivière Chaloupe a été vivant et joyeux pendant quelques semaines grâce à vous. Merci aussi à l’armée de ‘visionneux’ de photos : Maxime Brousseau, Sarah-Claude Lachance, Pauline Portal, Joannie Beaupré, Véronique Chabot, Vanessa Audet-Giroux, Guillaume Otis et Benoit Paradis. Un merci tout spécial à Christiane D’Élia, la maître incontestée du visionnement de photos, qui a visionné plus de 500 000 photos à elle seule!
xv
Christiane, je te souhaite un énorme succès dans tous tes projets! Merci aussi à Katherine Vandal Lenghan et Guilaume Otis pour le broyage de la végétation.
Comme je le disais plus tôt, la partie que je préfère dans un marathon-maîtrise est le travail de terrain. J’ai eu la chance de faire mon terrain dans un petit coin isolé de l’île d’Anticosti avec une poignée d’irréductibles ‘‘Chaloupiens’’. L’équipe qui travaille au secteur Chaloupe de la pourvoirie Safari Anticosti est connue depuis longtemps pour être une équipe originale et colorée. Il n’y a aucun doute là-dessus! Les guides de chasse de la rivière Chaloupe sont littéralement des personnages plus grands que nature. J’ai eu la chance de les côtoyer pendant 2 automnes et de m’imprégner de leur imaginaire. Pendant 3 mois, à chaque année depuis des décennies, ces hommes issus de la classe moyenne abandonnent leur maison et leur routine pour emmener les riches à la chasse dans un territoire où ils sont les rois de la forêt et où la chance d’abattre le plus gros mâle passe par leur talent et leur savoir. Ils sont des amants de la nature, des amateurs de sensations fortes, des hommes fiers de leurs connaissances qui ne s’apprennent pas dans les livres mais qui s’acquièrent tranquillement au fil du temps. J’ai été un témoin privilégié de ce petit monde en dehors du temps, paradis de chasse et de nature sauvage, secret bien gardé. Merci à Raymond Parent, Michel Quévillon, Bruno Martel, Kim Lacroix, Christian Blaquière, Normand Morissette, Doug, Maxime, Martin, François et Berthier. Je vais me souvenir longtemps de chacun de vous. Merci à toute l’équipe de Safari Anticosti qui a rendu ce projet possible : l’ancien patron Guy Lefebvre, directeur des opérations Guy Boudoul, Samuel Boudreau, Louise Poulin, les cuistots Martin, Samuel, Géraldine, les femmes de chambre Lisette, Pascale, Francine, les hommes à tout faire Joël et Jacques, le mécano et tous ceux que j’ai oubliés.
Merci aussi aux 181 chasseurs qui ont bien voulu participer à mon étude. Un gros merci à la gang de ‘patients’ qui venaient à la fin octobre et qui m’incluaient dans leur semaine comme si j’étais un des leurs. C’était vraiment apprécié, ça m’a fait chaud au cœur. Merci à tous les autres qui me racontaient leur histoire de chasse ou d’autres sortes d’histoires. Merci à ceux qui m’invitaient pour une bière, un verre de vin ou de fort. Merci à ceux qui m’ont invité à souper. Merci surtout pour votre temps et votre générosité. Je n’ai pas grand-chose à vous fournir en retour, autre que de mener à terme ce projet et de vous offrir ma gratitude.
xvi
L’île d’Anticosti est un endroit unique au monde de par son côté insulaire, sa géologie et son hydrologie particulières, ainsi que sa faune et sa flore grandement modifiées suite à l’introduction du cerf de Virginie. Les gens qui habitent le petit village de Port-Menier contribuent au charme inoubliable de cette île. Gaétan Laprise, Danièle Morin, Joël Malouin, Bianca Chénard, Aimée Benoist-Chénier et Stefan Tremblay; sans vous, mon séjour sur l’île et celui de tous les étudiants de la Chaire n’auraient pas été aussi mémorables. Gaétan et Danielle, j’ai rarement vu des gens aussi passionnés dans ma vie. Sciences, culture, sports, politique; tous les sujets sont intéressants lorsque l’on est en votre compagnie. Un grand merci pour tout ce que vous faites pour la Chaire et pour votre île magnifique. Je me souviendrai toujours de l’auberge de la Pointe-Ouest, de la fabrication de pâté de foie de cerf et des décomptes de saumons dans l’est de l’île. Joël et Bianca, je vous remercie pour tous les précieux services que vous m’avez rendus. Votre bonne humeur contagieuse et votre accueil chaleureux font de vous des gens d’une grande valeur, avec qui il fait bon être. Finalement, Aimée et Stefan, mes pots anticostiens. Vous nous avez accueillis, moi et les autres étudiants, comme des vieux amis. Vous nous avez invités dans vos partys et dans vos soupers! Vous nous avez fait visiter l’île, manger du bon homard, boire du bon vin. Vous nous avez fait goûter à la belle vie façon anticostienne! Merci les Anticostiens! Vous me manquez!
Je garde pour la fin les remerciements aux gens de mon entourage qui m’ont épaulé dans mon quotidien en dehors de l’université. Merci à mes colocs François Bergeron, Marie-Michèle Gagnon, Renaud Brissonneau, Geneviève Suzanne, Gabrielle Durand. Merci à vous et vos amis de m’avoir accueilli dans votre cercle social. Vous apportez beaucoup de joie, de plaisir et de divertissements dans ma vie. Vous êtes toujours sociables, détendus, amicaux. Il fait bon vivre en votre compagnie. Longue vie à vous dans votre nouvelle demeure avec les marmots et les poules!
Finalement, merci à mes parents Benoît Houde et Micheline Houde Vigneau. Vous êtes sans conteste mes deux plus grands modèles de vie. Tout en respectant ma soif d’autonomie, vous avez toujours été et serez toujours derrière moi pour m’épauler. Vous êtes mes entraîneurs dans un marathon encore plus grand que celui de la maîtrise. Vous êtes d’excellents conseillers, plein d’amour et de sagesse. Si je peux dire que mon directeur et mon codirecteur sont différents et complémentaires, il n’y a nul doute que je puisse dire la
xvii
même chose à votre sujet. Vous formez tout un duo! Malgré vos différends, je crois que vous avez des valeurs très fortes qui vous soudent l’un à l’autre; des valeurs comme l’entraide, le respect et l’amour des autres. Je serai toujours fier d’être votre fils. Je vous aime.
Je terminerai ce marathon de remerciements par ma douce Anick Ford. Anick, tu es pour moi comme un cadeau que je déballe tranquillement, peut-être même éternellement. Je ne suis rendu qu’au chou et au petit ruban qui fait le tour de la boite et déjà, j’ai fait de si belles découvertes. Je suis toujours épaté devant le contraste entre tes airs angéliques et rêveurs, et ta force de caractère qui te propulse sans cesse vers l’avant, même dans l’adversité. Je te trouve inspirante dans ton ouverture face aux autres et dans ton amour d’autrui. Je suis bien chanceux de vivre ma vie à tes côtés.
xviii
AVANT-PROPOS
Ce mémoire de maîtrise comprend l’insertion d’un article scientifique. L’étudiant Nicolas Houde est l’auteur principal de cet article et son directeur Jean-Pierre Tremblay ainsi que son codirecteur Steeve D. Côté sont coauteurs. Jean-Pierre Tremblay et Steeve Côté sont deux chercheurs et professeurs au département de biologie de l’Université Laval. Steeve D. Côté est titulaire de la Chaire de recherche industrielle CRSNG en aménagement intégré des ressources de l'Île d'Anticosti et il est un chercheur affilié au Centre d’études nordiques (CEN). Jean-Pierre Tremblay et Nicolas Houde sont aussi affiliés à la Chaire de recherche industrielle de l'Île d'Anticosti et au CEN.
L’article présenté dans ce mémoire n’a pas encore été soumis à un journal scientifique. Suite à la révision des commentaires des examinateurs du mémoire, l’article révisé et corrigé sera soumis au ‘Journal of Wildlife Management’.
Les coauteurs ont effectué l’élaboration du projet avec le partenaire industriel, la conception du dispositif expérimental, la recherche du financement pour le salaire de l’étudiant et les dépenses en lien avec le projet, la supervision de l’étudiant et l’approbation finale du mémoire.
L’étudiant a quant à lui effectué la proposition de recherche, la prise de données sur le terrain, le traitement et l’analyse statistiques des données, la rédaction du mémoire et la présentation du séminaire de maîtrise.
1
INTRODUCTION GÉNÉRALE
Depuis les dernières décennies, plusieurs régions du monde connaissent une hausse drastique des populations de cervidés (Côté et al. 2004, Danell et al. 2006). L’augmentation d’habitats productifs générée par l’expansion des pratiques sylvicoles et agricoles, le déclin des populations de grands prédateurs et la diminution de l’effort de chasse sont parmi les principales causes de l’augmentation des populations de cervidés (Côté et al. 2004). Cette hausse drastique des populations de cervidés entraine des problèmes d’ordre économique, écosystémique et social. Par exemple, le broutement des cervidés endommage les récoltes des agriculteurs et les plantations forestières, ce qui engendre des pertes économiques pour ces secteurs d’activités (Gill 1992). Les accidents routiers causés par des cervidés, la transmission de zoonoses telles que la maladie de Lyme et la perturbation des communautés végétales et animales sont d’autres préoccupations auxquelles les gestionnaires fauniques doivent répondre (Groot Bruinderink et Hazebroek 1996, Davidson et Doster 1997, Côté et al. 2004).
La chasse sportive est une technique traditionnellement utilisée pour contrôler les populations de cervidés, quoique son efficacité à diminuer les populations abondantes soit mise en doute (Brown et al. 2000). Cette pratique a l’avantage d’être peu coûteuse et simple à appliquer pour les gestionnaires fauniques, en plus d’être généralement bien acceptée socialement (Nugent et Choquenot 2004). Aussi, la chasse sportive engendre des retombées économiques élevées puisqu’elle est pratiquée par de nombreux adeptes (Doerr et al. 2001). Toutefois, les intérêts des intervenants associés à la chasse sportive peuvent être en opposition avec ceux d’autres partis puisque les chasseurs préconisent dans bien des cas un maintien des populations abondantes de cervidés (Sharp et Wollscheid 2009).
Pour les chasseurs, la qualité de l’expérience de chasse augmente en fonction du nombre et de la condition corporelle des gibiers vus et abattus (Gigliotti 2000, Miller et Graefe 2001). Afin de favoriser ces paramètres, différents aménagements de l’habitat ont été mis à l’essai, tels que les prairies artificielles. Celles-ci sont des ouvertures aménagées en zones boisées permettant l’émergence des plantes pionnières afin d’attirer et de nourrir le gibier. La prémisse derrière de tels aménagements est que l’utilisation de l’espace par une proie est modifiée par les composantes structurales de l’habitat et que la manipulation de ces composantes structurales peut entraîner une plus grande utilisation de cet habitat par le
2
gibier et ainsi augmenter sa vulnérabilité à la chasse (Miller et Marchinton 1995, Foster et al. 1997). Bien que cette idée d’attirer le gibier en aménageant son habitat soit séduisante pour les chasseurs et les gestionnaires fauniques, peu d’expériences scientifiques ont vérifié l’effet de la manipulation des composantes structurales de l’habitat sur l’utilisation de l’espace par le gibier et sur sa vulnérabilité à la chasse (Riginos 2015).
L’utilisation de l’espace par une proie est souvent modulée par le besoin d’acquérir la ressource alimentaire et celui d’éviter la prédation; deux besoins essentiels qui peuvent être en conflit (Verdolin 2006). Par exemple, dans un milieu ouvert avec une grande abondance de plantes pionnières, la proie peut satisfaire son besoin d’alimentation mais l’absence de couvert forestier l’expose à la prédation (Johnson et al. 1995, Massé et Côté 2009). Dans de tels cas, la proie doit évaluer ces deux besoins conjointement et elle est souvent contrainte d’effectuer un compromis entre les bénéfices de l’acquisition de nourriture et les coûts associés au risque de prédation (Brown 1988). Par exemple, suite à la réintroduction du loup gris (Canus lupus) dans le parc de Yellowstone, le wapiti (Cervus canadensis) a délaissé les milieux ouverts, riches en nourriture pour les milieux fermés où il est mieux protégé contre les attaques du loup (Hernández et Laundré 2005).
Les prairies artificielles conviennent bien à l’étude du compromis entre l’acquisition de nourriture et le risque de prédation puisqu’il y est possible de manipuler conjointement 1) la quantité et la qualité du fourrage à l’aide d’engrais appliqués sur les prairies et 2) la détection du gibier par les prédateurs avec différentes superficies de couvert forestier entre les prairies. La manipulation de ces deux paramètres permet de vérifier si l’utilisation des prairies artificielles est déterminée par les bénéfices de l’acquisition de fourrage, les coûts associés au risque de prédation ou le compromis entre les deux. La fertilisation du sol à l’aide d’azote, phosphore et potassium peut augmenter la quantité et de la qualité du fourrage et donc augmenter les bénéfices de l’acquisition de fourrage (Månsson et al. 2009). L’augmentation du rapport couvert forestier/ouverture contribue à dissimuler la proie face aux prédateurs, et donc à diminuer les coûts associés au risque de prédation (Lima et Dill 1990, Tufto et al. 1996).
En plus de modifier l’utilisation de l’espace par le gibier, l’aménagement de prairies artificielles peut également moduler la condition corporelle du gibier et sa vulnérabilité à la chasse. Certaines études sur le cerf élaphe (C. elaphus) ont démontré que la condition
3
corporelle et la taille des bois des mâles abattus à la chasse pouvaient être augmentées par l’acquisition d’une plus grande quantité et qualité de fourrage (Putman et Staines 2004). De plus, la création d’ouvertures en milieu fermé améliore la visibilité pour les chasseurs ce qui peut augmenter la vulnérabilité du gibier à la chasse (Lebel et al. 2012, Milner et al. 2014).
Objectifs, hypothèses et prédictions
Afin de comprendre comment l’aménagement de prairies artificielles modifie l’utilisation de l’espace par le gibier, la qualité du gibier et sa vulnérabilité à la chasse, nous avons mis en place un dispositif expérimental à grande échelle, constitué de prairies artificielles pour la chasse au cerf de Virginie (Odocoileus virginianus). Le dispositif est situé sur l’île d’Anticosti (Québec, Canada), un vaste territoire de 7,943 km2 avec une densité élevée de cerfs de Virginie dépassant 20 cerfs/km2 localement, aucun prédateur naturel et une forte compétition pour les ressources alimentaires (Côté et al. 2008, Simard et al. 2010). La chasse au cerf de Virginie y est une activité économique majeure qui a lieu du mois de septembre au mois de décembre. Les prairies artificielles ont été mises en place dans l’est de l’île d’Anticosti dans une zone brûlée par un feu de forêt en 1982 et maintenant régénérée densément en épinettes blanches (Picea glauca). Nous avons testé l’hypothèse que l’utilisation des prairies par le cerf de Virginie est modulée par le compromis entre l’acquisition de fourrage et l’évitement de la prédation, ce qui se traduirait par une plus grande utilisation des prairies fertilisées avec une plus grande superficie de couvert forestier entre elles. Nous avons aussi prédit que cette plus grande utilisation par le cerf se traduirait par une plus grande vulnérabilité du cerf à la chasse sportive. Finalement, nous avons comparé les prairies artificielles avec des zones témoins, sans aménagement, situées à proximité. Nous avons prédit que l’aménagement de prairies artificielles entraînerait une plus grande utilisation par le cerf des habitats aménagés, une amélioration de la condition corporelle et une augmentation de la vulnérabilité des cerfs à la chasse sportive.
4
CHAPITRE PRINCIPAL
Manipulating forage availability and predation risk to increase white-tailed deer vulnerability to hunters.
Nicolas Houde(1, 2, 3), Steeve D. Côté (1, 2, 3), and Jean-Pierre Tremblay (1, 2, 3),
(1) Département de biologie de l'Université Laval, (2) Chaire de recherche industrielle CRSNG en aménagement intégré des ressources de l'île d'Anticosti, (3) Centre d'études nordiques
5
RÉSUMÉ
Un compromis entre l’acquisition de fourrage et l’évitement de la prédation contrôle souvent l’utilisation de l’espace des herbivores. La manipulation des composantes structurales de l’habitat telles que le fourrage et le couvert forestier peut moduler ce compromis. L’idée de manipuler l’utilisation de l’espace par une proie est attirante pour les gestionnaires fauniques et les intervenants du milieu de la chasse désireux de modifier les densités de proie et d’augmenter la vulnérabilité du gibier à la chasse. Nous avons tenté de moduler le compromis entre l’acquisition de fourrage et l’évitement de la prédation effectué par le cerf de Virginie (Odocoileus virginianus) sur l’île d’Anticosti au moyen de prairies artificielles dans lesquelles nous avons manipulé la production végétale (prairies fertilisées ou non fertilisées) et le couvert forestier résiduel (bandes forestières entre les prairies d’une largeur de 30 ou 60 m). Dans cet écosystème avec une haute densité de cerfs, aucun prédateur naturel et une rareté de la ressource alimentaire de bonne qualité, les relevés de fèces et les pièges photographiques ont démontré une plus grande utilisation par le cerf des prairies fertilisées. Le couvert forestier résiduel n’a pas modifié l’utilisation par le cerf, ce qui suggère que l’utilisation des aménagements était principalement conditionnée par les bénéfices du fourrage, plutôt que par les coûts de la prédation. Toutefois, la vulnérabilité du cerf à la chasse a augmenté avec la diminution de la largeur des bandes forestières : les chasseurs ont vu plus de cerfs/heure dans les prairies avec des bandes forestières de 30 m que dans les prairies avec des bandes forestières de 60 m. Le fait que les chasseurs n’aient pas détecté la différence d’utilisation de l’espace entre les prairies fertilisées et non fertilisées suggère que la vulnérabilité à la chasse et l’utilisation de l’espace peuvent être modulées par différentes composantes structurales de l’habitat. Ces résultats procurent des pistes de solutions pour les gestionnaires fauniques qui doivent satisfaire les chasseurs avec une augmentation de la vulnérabilité du cerf à la chasse, tout en réduisant les dommages causés par les hautes densités de cerfs.
6
ABSTRACT
A trade-off between forage acquisition and predation avoidance often controls space use by herbivores. The manipulation of structural components of the habitat, such as forage and forest cover may modulate this trade-off. The idea of manipulating space use of herbivores is appealing for wildlife managers and hunting outfitters that aim to locally modify herbivore densities and increase their vulnerability to hunting. We attempted to modulate the trade-off between forage acquisition and predation avoidance of white-tailed deer (Odocoileus virginianus) on Anticosti Island (Québec, Canada) using experimental hunting fields varying in forage production (fertilized or unfertilized fields) and residual forest cover (30 or 60-m-wide forested strips between fields). In this system with high deer density, no natural predator and limited forage, fecal group surveys and camera traps demonstrated greater deer use of fertilized fields. Residual forest cover did not impact deer use, suggesting that use of the experimental fields was mainly driven by the benefits of foraging compared to the costs of avoiding predation. Deer vulnerability to hunting, however, differed with residual forest cover: hunters saw more deer/hour in the fields separated by 30-m-wide forested strips compared to the fields separated by 60-m-wide forested strips. The fact that hunters did not detect the difference in deer use between fertilized and unfertilized fields suggests that deer vulnerability to hunting and deer use could be modulated by different structural components of the habitat. These results provide useful insights for wildlife managers that have to deal with conflicting goals such as maintaining hunter satisfaction with high observation rates of deer while reducing the negative impacts of high deer densities.
7
INTRODUCTION
For prey herbivores, space use is often determined by the need to acquire forage in opposition with the need to avoid predation (Verdolin 2006). Foraging may enhance vulnerability to predators by reducing vigilance and increasing the use of risky habitats (Brown 1999). Alternatively, predator avoidance may limit prey to habitats where forage acquisition is suboptimal. To resolve this dilemma, prey must assess these 2 contrasting needs concurrently by making a trade-off between the benefits of forage acquisition and the costs of avoiding predation (Brown 1988). Several biotic and abiotic variables may modify this trade-off over space and time, challenging ecologists in their understanding of space use by prey herbivores. A major advantage of improving our knowledge of the trade-off between forage acquisition and predation avoidance is ultimately to manipulate space use and vulnerability to predation of prey herbivores.
The structural components of habitat patches such as forest cover and soil properties modify forage acquisition and predation risk (Mysterud and Østbye 1999, Edwards et al. 2004). Forest cover conceals prey from predators, but cover also hinders the growth of shade-intolerant plants and the lack of light can reduce forage quantity, quality and diversity (Tufto et al. 1996, Mysterud and Østbye 1999). On the other hand, open habitat patches generally produce a greater quantity of forbs and grasses than forested patches but they also increase prey detectability (Johnson et al. 1995, Massé and Côté 2009). Productive open patches often have fast nutrient cycles (Nitschke et al. 2015) that increase the concentration of nutrients in the forage (Edwards et al. 2004, Riginos 2015). In principle, prey herbivores should use habitats with structural components that allow them to make the most advantageous trade-off between forage acquisition and predation avoidance (Lima and Dill 1990, Kauffman et al. 2007).
Fluctuations in the abundance of predators, prey, and forage also have the potential to alter the trade-off between forage acquisition and predation avoidance (Potvin et al. 2000, Wolff and Horn 2003, Riginos 2015). A decline in the abundance of large predators occurred in several regions over the last decades and relaxed predation on many cervid populations (Côté et al. 2004). In combination with other factors such as agricultural and forestry activities, this decline in predator populations led to dramatic increases in several cervid
8
populations (Côté et al. 2004). In the absence of predators, some prey expand their foraging activities to forage-rich habitat patches formerly considered risky (Laundré et al. 2001). At high herbivore density, the abundance of forage can decrease after increased competition for food resources and lead herbivores to forage in normally avoided habitat patches (White et al. 2001). In a system with high competition for forage acquisition and low predation risk, it has been demonstrated that these 2 environmental conditions can modify the trade-off for space use by increasing forage acquisition and reducing anti-predator behavior (Massé and Côté 2009).
Sport hunting has been for many decades a socially acceptable, cost-efficient, and a common management tool to control cervid populations (Brown et al. 2000). Now that broad regions experience high density of cervids, the efficiency of hunting to reduce density is questioned (Warren 2011, Simard et al. 2013). New habitat management practices have arisen over the past decades. They are based on the observations that structural components of a habitat can mediate the trade-off for space use and that habitat modifications could modify deer use and vulnerability to hunting (Miller and Marchinton 1995, Foster et al. 1997). For example, forage supplementation using food plots (Smith et al. 2007) and silvicultural practices such as prescribed fires (Edwards et al. 2004), clear-cutting (Lyon and Jensen 1980) and thinning (Heikkilä and Härkönen 2000) are aimed at increasing production and quality of forage to enhance herbivore density or to attract herbivores to specific patches. Combining these practices with fertilization can further increase nutrient uptake by plants and the production of high-quality forage (Månsson et al. 2009). The fragmentation of continuous forest blocks into smaller forested patches with openings could create an advantageous trade-off with increased forage access in open patches near protective forest cover (Lyon and Jensen 1980, Tufto et al. 1996). From the hunter’s point of view, forage supplementation can also improve body condition, antlers size and the density of trophy males (Putman and Staines 2004), while forest openings enhance visibility and accessibility to hunting grounds that can increase harvest probability (Lebel et al. 2012, Milner et al. 2014). Although manipulating the trade-off for space use through habitat modifications is an attractive concept for hunters and wildlife managers, few empirical studies have tested it (but see Riginos 2015).
9
We established a network of experimental hunting fields within densely forested areas on Anticosti Island (Québec, Canada), a predator-free island with ≥20 deer/km2 locally and a high competition for forage (Côté et al. 2008, Simard et al. 2010). Sport hunting occurs during from September to December and is the major economic activity of the island. Our general objective was to assess the effect of habitat modifications on white-tailed deer (Odocoileus virginianus) space use, vulnerability to hunting and body condition. Within the experimental hunting fields, we attempted to manipulate forage production and quality through fertilization of fields and predation risk through various widths of forested patches between fields. We hypothesized that deer space use is modulated by the trade-off between forage acquisition and predation avoidance. We postulated that fertilization would increase forage production and quality and that wider patches of forest between fields would increase cover and reduce visibility for hunters (Ball et al. 2000, Lebel et al. 2012). We predicted that high production and quality of forage would increase forage acquisition benefits and lead to a higher use of riskier habitats. We also predicted that this higher deer use would increase deer vulnerability to hunting. Unmodified forested habitats located near the experimental hunting fields were used as controls. We posited that deer use and vulnerability to hunting would be higher in the experimental fields than in the forested areas and that deer harvested in the experimental fields would have higher body condition and larger antlers than deer harvested in the forested areas.
STUDY AREA
The experiment was conducted on the lands exploited by Safari Anticosti Outfitter (49°17’N, 62°32’W) located in the eastern part of Anticosti Island, in the Gulf of St. Lawrence, Québec, Canada. This 7,943 km2 island has a sub-boreal maritime climate characterized by cool summers and long mild winters with abundant snowfall (annual average for 2013 and 2014 = 414 cm [Environment Canada 2016]). The average temperature near the study area was 17.7° C in July and –10.9° C in January (Société de protection des forêts contre le feu 2015). The topography of the island is a low plateau of calcareous rocks (average elevation = 126 m) intersected by several canyons (Copper and Long 1998).
10
Boreal forest on the island belongs to the eastern part of the balsam fir (Abies balsamea)-white birch (Betula papyrifera) bioclimatic domain, characterized by a dominance of balsam fir, white spruce (Picea glauca), and black spruce (P. mariana) (Saucier et al. 2009). Selective deer browsing on balsam fir seedlings combined with natural disturbances has initiated a progressive conversion of balsam-fir-dominated stands into white-spruce-dominated stands (Barrette et al. 2014). The most palatable deciduous species of trees and shrubs normally found in this region, such as white birch, mountain maple (Acer spicatum), and red-osier dogwood (Cornus stolonifera), have also become scarce due to deer browsing (Pimlott 1963, Potvin et al. 2003, Tremblay et al. 2005). The soil at the study site has a thin layer of organic matter with low levels of nitrogen (N; 2 ± 1 g/kg [95% CL]), phosphorus (P; 4 ± 1 mg/kg), and potassium (K; 104 ± 11 mg/kg) concentrations in the first 10 cm of the mineral horizon (see methods below), as often observed in coniferous forests (Jerabkova et al. 2006, Rosén et al. 2011).
METHODS
Experimental design
In summer 1982, a forest fire burned 75 km2 of the lands exploited by Safari Anticosti Outfitter. By 2012, thick white spruce-dominated stands with approximately 75% canopy cover density regenerated on this burned site to an average height of 2.5 m, greatly limiting access and reducing visibility for hunters. In 2012, we created 38 km of trails and fields with a forestry mulching machine (Twister C12560, C.M.I. Mulching Inc, St-Cyrille-de-Wendover, Canada) removing trees and grinding all aboveground vegetation. We established 16 experimental units within a completely randomized block design (4 replicated blocks of 4 units each, totalizing ca.14 km2; Fig. 1a). In each experimental unit, we created 4 parallel fields of 200 × 10 m with a residual forested strip between each field (Fig. 1b). Experimental units were established >460 m apart, a distance greater than the mean radius of the summer home range of a female white-tailed deer on Anticosti Island (365 ± 27 m) to limit deer space use to one unit (Massé and Côté 2009). In each experimental unit, we tested a factorial combination of two treatments: 1) presence or absence of field fertilization, and 2) various forest cover between fields (30 or 60-m-wide residual forested strips). For each block, we selected an unmanaged area with the same
11
dimensions as the experimental units as a control, without creation of fields or fertilization. Unmanaged control units were located in the burned area, >800 m from the experimental units to avoid overlaps between controls and experimental units within a deer home range (Fig. 1a).
b)
a)
b)
12
Figure 1. a) Experimental design illustrating the 4 replicated experimental blocks and their respective control. Dotted lines mark the block assignation of each fertilized and unfertilized units. Units with 60-m-wide forested strips have larger icons than units with 30-m-wide forested strips (not to scale). Black lines represent the network of trails between units. Blocks A and B are located 7 km east of blocks C and D. b) Picture of an experimental unit in spring at year 1 of the study with the 4 10 × 200-m fields separated by 3 30-m-wide forested strips. c) Representation of all measurement procedures established in an experimental unit (not to scale): 2 2 × 2-m deer exclosures within open fields (rectangles in white area), 6 4 × 80-m fecal pellet group transects in forested strips (lines in grey area), and 1 or 2 camera traps within fields (triangles).
Field fertilization
In fall 2012, we collected a composite sample of mineral soil in each experimental unit and analyzed total N through combustion at 1350° C (TruMac CN Elemental Analyzer, LECO Corporation, St-Joseph, MI; Carter 1993), and P and K concentrations with a Mehlich III extraction and a spectrophotometry analysis (Mehlich 1984). We adjusted the quantity of fertilizer based on the nutrient requirements of grasses and legumes forage (Association des fabricants d’engrais du Québec 1999). In spring 2013, we applied a pelleted mixture of N, P, and K according to an 8-22-25 ratio, at a rate of 450 kg per hectare. We performed fertilization with a spreader (85 lb Tow Spreader, Agri-Fab, Inc., Sullivan, IL) mounted on an all-terrain vehicle. No seeds were sown; native herbaceous pioneer species such as Canadian bunchberry (Cornus canadensis) and dwarf raspberry (Rubus pubescens) naturally recolonized the fields.
Forage production and quality
We estimated forage production in 2013 and 2014 using 2 2 × 2-m deer exclosures per experimental unit (Fig.1c). We installed exclosures in June 2013 at two random locations among the 4 fields of each unit, restricting the number of exclosures per field to one and positioning them >2 m from the forest edge. In October 2013 and 2014, we clipped all aboveground vegetation in 2 30 × 30-cm quadrats inside each exclosure, at 30 cm from the fence to limit edge effects. We changed quadrat locations the second year to avoid clipping vegetation that was clipped the first year. Vegetation was dried at 50° C until constant mass, sorted by species, and weighted in milligrams (AE-200, Mettler Toledo, Mississauga,
13
Canada). We used the mean of the 2 quadrats per exclosure in g/m2 as an estimate of forage production. To assess forage quality, we pooled the vegetation of the two quadrats and submitted the material to a macro-Kjeldahl extraction with flow injection analysis for foliar N concentration (Parkinson and Allen 1975). We estimated neutral detergent fiber (NDF; hemicellulose, cellulose, and lignin) following Goering and Van Soest (1970; A200, Ankom Technology, Macedon, NY). We used foliar N and NDF concentration as proxies of forage quality.
Hiding cover
To assess the relationship between the width of forested strips (30 or 60 m) and predation risk, we estimated hiding cover, defined as potential for concealment. We selected 15 random locations at the edge of the 3 forested strips of each experimental unit. We measured the distance between a fixed observer standing at these locations and a person walking with an orange vest through the forested strip until the observer could no longer see the vest (adapted from Mysterud 1996). We evaluated the distance between both participants with a rangefinder (Scout 1000 ARC, Bushnell, Overland Park, KS) and used these sight distances as estimates of hiding cover. All observations were performed by the same person.
Deer use of the experimental design
During 2013 and 2014, we measured deer use of the experimental and control units with fecal pellet group surveys. We randomly positioned 6 4 × 80-m strip transects per unit among the 3 forested strips (Fig 1c). We cleared transects of all fecal pellet groups in June. In October, we counted the fecal pellet groups deposited. A group of fecal pellets consisted in a dung or an accumulation of more than 15 pellets within a 10-cm-radius plot (Marques et al. 2001). We maintained the same transect locations in 2013 and 2014. We did not use distance sampling because the detection rate of fecal pellet groups was constant within a strip transect (Buckland et al. 2005).
We also used camera traps as a proxy of deer use of the experimental units. In June 2013 and 2014, we dispatched 24 cameras (Trophy Cam, Bushnell, Overland Park, KS) among treatments and blocks, resulting in 1 or 2 cameras per unit (Fig 1c). Within a unit, we randomly located cameras 110 cm above ground at the end of 1 of the 4 fields with no more than 1 camera per field. We adjusted the cameras to systematically trigger every 30 min
14
during daylight from June to November (Hamel et al. 2013). We assured a same sampling effort for each treatment combinations by selecting periods for which all cameras within a block worked without technical problems (from 42 to 168 days). We used the number of deer seen per camera within these periods as estimates of deer use (Appendices A and B).
Deer vulnerability to hunters
During fall 2013 and 2014 respectively, we monitored the observations of deer by 98 and 83 volunteer hunters both inside and outside the experimental design to estimate deer vulnerability to hunting. We tracked the movements of hunters using Global Positioning System (GPS) devices (eTrex ® 20x, Garmin International, Inc., Olathe, KS) at a rate of one location per minute. After each hunting period, hunters were interviewed to validate their itinerary and record the number, sex, and location of observed deer with a possibility of shooting. We used the number of deer seen per hour as a measure of deer vulnerability to hunting (Lebel et al. 2012). We recorded the date, hunter age, and years of experience as a deer hunter on the island and elsewhere. We detailed weather conditions prevailing during the hunt, using data provided by a weather station located ca.12 km from the experimental design (Société de protection des forêts contre le feu 2015). We noted air temperature, peak wind speed, and presence/absence of rain, ground frost, and snow on the ground.
Body condition of harvested deer
To assess the effect of the experimental fields on the body condition of deer, we performed body measurements on mature deer (≥2.5-years-old) harvested by the monitored hunters in 2013 (30 males, 8 females) and 2014 (19 males, 8 females). We assigned each deer to a harvest zone considering that deer harvested at <460 m from an experimental unit were using the experimental design (n=30) and deer harvested elsewhere in the burned area were controls (n=35). We weighed dressed body mass (without viscera) with a spring scale (± 0.25 kg) and measured the length of deer from the tip of the snout to the tip of the tail. We measured the thickness of the rump fat at 5 and 10 cm from the base of the tail (Simard et al. 2014). We weighed the peroneus muscle with a Pesola scale (±0.5 g; Pesola AG, Baar, Switzerland) as an index of muscle mass (Crête et al. 1993). We measured the exterior width of the antlers at the widest point and tallied the number of points exceeding 2.5 cm. We assessed deer age using counts of cementum layers in incisor teeth (Hamlin et al. 2000).
15
Data analyses
Verification of postulates.–– We examined the effects of fertilization, year, and their
interaction on forage quality and on the square root of forage production using general linear mixed models (GLMM; PROC MIXED) with blocks and exclosures as random effects. We used year as a repeated measure with a heterogeneous compound symmetry (csh) structure because the variance was not the same for both years (Wolfinger 1996). We analyzed the effect of residual forest cover on the square root of sight distance in the forested strips with a GLMM using blocks and each measurement locations as random factors. We postulated that sight distance would be reduced as the width of the forested strips increases, but our results demonstrated that mean sight distance was not significantly different in the 30-m-wide strips (36 ± 5 m; 95% CL) compared to the 60-m-wide strips (31 ± 5 m; F 1, 3 = 1.43, P = 0.32).
Effects of treatments.–– We used GLMM to analyze the effects of fertilization, residual
forest cover, year, and their interactions on 1) the square root of fecal pellet groups and 2) the logarithm of the number of deer observed on cameras. We used 1) blocks and transects, and 2) blocks and cameras, respectively, as random factors. We used year as a repeated measure for both models. We performed a posteriori mean comparisons using least square mean differences (LSMEANS statement) when required. We compared the number of deer seen per hunter-day between year and treatment combinations using generalized estimating equations (GEE; PROC GENMOD) taking into account the repeated measures by a same hunter. We modeled the repeated effect with the independent type of correlation matrix considering that all measures from the same hunter were independent. We used a negative binomial distribution, the logarithm of hours spent hunting in a day as an offset variable (Agresti 1996) and the hunter information (age and hunting experience on the island and elsewhere), weather conditions, and date as covariates. To reduce redundancy between covariates, we performed 2 principal component analyses (PCA). First, the 3 hunter characteristics were substituted by a single component explaining 66% of the variance between these covariates. Second, the 5 weather conditions were replaced by 2 components explaining 73% of their variance: the first component represented temperature and presence/absence of snow and ground frost, the second discriminated between rainy and
16
windy days. Few deer were harvested directly in the experimental units (n=17) preventing us from relating body condition to fertilization and residual forest cover.
Experimental design vs. controls.–– We compared the abundance of fecal pellet groups
between experimental units and controls, combining the variables fertilization and residual forest cover into one explanatory variable with 5 levels (4 treatment combinations + control). Year and its interaction with this 5-level variable were also explanatory variables. We used blocks and transects as random factors and year as a repeated measure. We analyzed the effects of the experimental design on deer vulnerability using the number of deer seen per hunter-day in the experimental design and in the control zones with GEE. We used observation zone (experimental design vs. control), year and their interaction as explanatory variables. Again, we used a negative binomial distribution, the independent matrix for repeated measures, the logarithm of hours spent hunting in a day as an offset variable and date, hunter information and weather conditions as covariates. The covariate date did not respect the homogeneity of slopes, thus the interaction date × year × observation zone was kept in the model and used as a covariate (Quinn and Keough 2002). Finally, we assessed the effects of harvest zone (experimental design vs. control), year, sex, and their interactions on the 6 indices of body condition using a GLMM with harvest date and deer age as covariates (PROC MIXED). All data were checked for normality of errors and homoscedasticity. Degrees of freedom were calculated with the Kenward-Roger approximation for GLMM. We performed all analyses with SAS 9.4 (SAS Institute Inc., Cary, NC).
RESULTS
Forage production and quality
Forage production tended to be higher in the fertilized fields (213 ± 56 g/m2; 95% CL; raw data) than in the unfertilized fields (152 ± 38 g/m2) and it increased from 114 ± 40 g/m2 in year 1 to 251 ± 44 g/m2 in year 2 (Fig. 2; Table 1). Foliar concentration of N was not affected by fertilization, year or their interaction (fertilized units = 1.1 ± 0.1% vs. unfertilized units = 1.1 ± 0.1%, year 1 = 1.1 ± 0.1% vs. year 2 = 1.2 ± 0.1%; Table 1). NDF concentration of dried forage significantly increased from year 1 to year 2 in unfertilized fields (F1, 29.4 = 16.86, P = <0.001), but not in fertilized fields (F1, 28.4 = 1.80, P = 0.19; Fig.
17
3; Table 1). Similarly, total grasses production also increased in unfertilized fields from year 1 (17.4 g/m2) to year 2 (67.9 g/m2; Appendix C). Except for blueberry (Vaccinium
angustifolium, V. myrtilloides), and American bracken (Pteridium aquilinum) that appeared
to be more abundant in fertilized than unfertilized fields, forage composition was similar between treatment combinations (Appendix D).
Figure 2. Forage production tended to be higher in fertilized fields than in unfertilized fields and it increased from year 1 (grey dots) to year 2 (white dots) in all experimental fields on Anticosti Island, Québec, Canada. Each dot represents the annual mean of 2 exclosures per experimental unit and the black horizontal bars represent the overall mean of every combination of fertilization and year with the 95% CI (thinner bars).
18
Figure 3. From year 1 (grey dots) to year 2 (white dots), the concentration of neutral detergent fiber (NDF) significantly increased in unfertilized fields, but not in fertilized fields, on Anticosti Island, Québec, Canada. Each dot represents the annual mean of two exclosures per unit. Black bars represent the overall mean of every combination of fertilization and year with the 95% CI (thinner bars).
Deer use of the experimental design
Fertilization had no effect on the number of fecal pellet groups deposited in year 1 (F1, 23.4 = 0.00, P = 0.97), but in year 2 fertilized units (379 ± 65 groups/ha) tended to have more fecal pellet groups than unfertilized units (263 ± 49 groups/ha; F1, 9.51 = 3.79, P = 0.08; Fig. 4; Table 2). There was no significant difference in the number of fecal pellet groups between controls (416 ± 80 groups/ha) and experimental units (544 ± 60 groups/ha; F4, 13.1 = 1.77, P = 0.20) in both years. A significant reduction in fecal pellet groups occurred in the experimental units and in the controls from year 1 (719 ± 76 groups/ha) to year 2 (283 ± 33 groups/ha; F1, 139 = 206.02, P = ≤0.001).
In both years, there were more deer observed per camera in fertilized units (185 ± 109 deer) compared to unfertilized units (68 ± 31 deer; Fig. 5; Table 2). The number of deer seen per
19
camera significantly declined from 216 ± 99 deer in 2013 to 37 ± 15 deer in 2014 (Fig. 5; Table 2). Both indices of deer use showed no effect of residual forest cover with 122 ± 101 deer seen per camera and 572 ± 90 fecal pellet groups/ha in units with 30-m-wide strips and 132 ± 71 deer seen per camera and 515 ± 80 fecal pellet groups/ha in units with 60-m-wide strips (Table 2).
Figure 4. The effect of fertilization changed from not significant in year 1 (grey dots) to a statistical trend in year 2 (white dots) with 44% more fecal pellet groups in fertilized units compared to unfertilized units on Anticosti Island, Québec, Canada. Each dot represents the annual mean of the 6 transects per experimental unit and the black bars represent the overall mean of every combination of fertilization and year with the 95% CI (thinner bars).
20
Figure 5. The number of white-tailed deer seen per camera was higher in fertilized fields than in unfertilized fields in both years on Anticosti Island, Québec, Canada. From year 1 (grey dots) to year 2 (white dots), the number of deer seen per camera declined in all experimental fields. Each dot represents the annual mean of 1 or 2 cameras per unit and the black bars represent the mean of every combination of year and fertilization with the 95% CI (thinner bars). The fertilization effect is maintained when removing the outlier.
Deer vulnerability to hunters
Hunters observed more deer/hour in fields separated by 30-m-wide forested strips (1.47 ± 0.05 deer/hour) than in the fields with 60-m-wide forested strips (0.96 ± 0.03 deer/hour; Table 2). Fertilization had no effect on the number of deer/hour seen per hunter. There was no significant difference in the number of deer/hour observed by hunters between controls and the experimental design (χ2 = 0.09, P = 0.77). The number of deer/hour observed in the controls and in the experimental design significantly decreased from 1.17 ± 0.01 deer/hour in year 1 to 0.50 ± 0.01 deer/hour in year 2 (χ2 = 4.98, P = 0.03).
21
Table 1. Effects of fertilization, year, and their interaction on forage production, foliar nitrogen (N) and neutral detergent fiber (NDF) concentrations in experimental fields on Anticosti Island, Québec, Canada. We conducted an experiment corresponding to a completely randomized block design with 16 experimental units in 4 blocks involving a 2-level treatment of fertilization (fertilized and unfertilized) over 2 years (2013, 2014). Forage was collected in 2 4-m2 exclosures per unit each fall. We performed analyses with general linear mixed models (GLMM) with blocks and exclosures as random factors and year as a repeated measure.
Source Forage production Foliar N concentration NDF concentration
df num, den F P df num, den F P df num, den F P
Fertilization 1, 27.3 3.38 0.08 1, 13.3 0.20 0.66 1, 28.8 1.06 0.31
Year 1, 30 127.06 ≤0.001* 1, 29.4 2.90 0.10 1, 29 15.26 ≤0.001 *
Fertilization × year 1, 30 1.11 0.30 1, 29.4 0.32 0.57 1, 29 4.24 0.05 *
22
Table 2. Effects of fertilization, residual forest cover, year, and their interactions on white-tailed deer use of the experimental design and on deer vulnerability to hunting in experimental fields on Anticosti Island, Québec, Canada. The experiment is a completely randomized block design with 16 experimental units in 4 blocks involving a 2-level treatment of fertilization (fertilized and unfertilized) and a 2-level treatment of residual forest cover (30-m and 60-m-wide forested strips) over 2 years (2013, 2014). Deer use was assessed using 6 fecal pellet group transects and 1 or 2 camera traps per unit. Deer use analyses were performed with general linear mixed models. Deer vulnerability to hunting was assessed using observations by hunters and analyzed with generalized estimating equations. For this analysis, we used a negative binomial distribution and the logarithm of hours spent hunting in a day as an offset variable.
Source Fecal pellet groups Deer seen on cameras Deer observed by hunters
df num, den F P df num, den F P χ2 P
Fertilization 1, 11 0.83 0.38 1, 9.79 8.79 0.01 * 0.38 0.54
Residual forest cover 1, 11 0.72 0.42 1, 9.85 0.14 0.71 3.73 0.05 *
Residual forest cover × fertilization
1, 11 1.13 0.31 1, 9.81 1.72 0.22 1.43 0.23
Year 1, 92 118.94 ≤0.001 * 1, 15.1 161.20 ≤0.001* 6.84 0.01 *
Fertilization × year 1, 92 3.86 0.05 * 1, 15.1 1.08 0.32 0.05 0.82
Residual forest cover × year 1, 92 0.02 0.89 1, 15.1 3.24 0.09 0.00 0.96 Residual forest cover ×
fertilization × year
1, 92 0.01 0.92 1, 15.1 0.00 0.95 0.83 0.36
23
Body condition of harvested deer
Harvest zone (experimental design vs. controls) or the interactions between harvest zone and the other explanatory variables had no effect on eviscerated body mass (51 ± 4 kg vs. 48 ± 3 kg in the experimental design and controls, respectively), body length (184 ± 5 cm vs. 183 ± 4 cm), peroneus muscle mass (109 ± 9 g vs. 107 ± 7 g), mean thickness of rump fat (1.67 ± 0.29 cm vs. 1.60 ± 0.23 cm), and the number of points (6.4 ± 0.8 vs. 5.9 ± 0.8; Table 3). Antlers width was similar between harvest zones in year 1 (39 ± 5 cm vs. 37 ± 4 cm; F1, 42 = 0.45, P = 0.51), but larger in the experimental design (37 ± 5 cm) than in controls in year 2 (29 ± 5 cm; F1, 42 = 5.51, P = 0.02).