Using the classification model of an electronic nose to assign unknown
malodours to environmental sources and to monitor them continuously
J. Nicolas, A.-C. Romain, V. Wiertz, J. Maternova, Ph. AndréDepartment of Environmental Monitoring, Fondation Universitaire Luxembourgeoise (FUL), Avenue de Longwy, 185 B 6700-Arlon, Belgium
Abstract
The paper provides some considerations resulting from measurements with electronic noses around real sources of malodour in the environment: compost facilities, printing houses, paint shops, waste water treatment plants, rendering plants, settling ponds of sugar factories. The study aims at supplying the concrete information requested by the final user in the field: either a warning signal when the malodour level exceeds some given threshold value, the identification of the source of an odour detected on site, or on-line identification and monitoring of an odour in the field. Very simple instruments are used, either in the laboratory or directly in the field, with a home-made portable e-nose, based on tin oxide sensors. Even with such simple operating
conditions, the classification results with DA and PCA are fairly good. The classification functions calibrated with the statistical procedure, on the basis of the learning phase, are used to recognise and to monitor a given malodour. This odour is sometimes mixed with other odorous interferences in the field. The observations reveal some features useful in the frame of the development of a field detector. © 2000 Elsevier Science S.A. All rights reserved.
Keywords: Electronic nose; Real malodours; Field monitoring
1. INTRODUCTION
Various economic activities are the cause of odour-release in the atmosphere, becoming pollution sources in the surroundings.
The aim of discriminating and monitoring environmental odours in the field seems an interesting challenge for electronic noses, right in the line of their general strategy of odour analysis. However, the number of real size projects that can be pointed out is rather small. The problem is really a hard venture which should practically be solved only for some specific applications rather than for all-purpose recognition of environmental odours (landfill sites, wastewater treatment plants, piggeries, paper or sugar factories, breweries,... ).
Very few studies are devoted to environmental applications in the field [1-5]. All of them are restricted to the identification of very specific odours, chiefly at the emission, just near the source. The majority of them apply the electronic nose to the detection of hazardous compounds or of olfactive nuisance in the agricultural and the breeding sectors.
The scientific articles generally show the graphical results of the model calibration step, which consist commonly of two-dimensional scatterplots identifying some groups of different odours. Using the calibrated classification model to recognise unknown odour sources is less usual and, anyhow, such prediction is seldom reported for field application.
Although the continuous monitoring of environmental odours in the field looks like a challenge with respect to laboratory utilisation, the actual results in that area are promising and the potential of applications is enormous. To become a reality, the use of electronic nose in the environment first has to overcome some obstacles, such as • the understanding and the control of the influence of ambient parameters (temperature, humidity) [6],
• the improvement of sensors sensitivity and noise reduction in order to be able to detect the very low concentration levels of odorous compounds in the atmosphere,
• the identification of main environmental odours by typical signatures, in various operating conditions and non-constant odour intensity.
For 5 years, the department "Environmental Monitoring" of FUL has been trying to assess the ability of a detector based on the electronic nose principle to discriminate between some environmental odours, if possible, directly in the field and to monitor them continuously. Such an approach should aim at a better understanding of odour release, by relating it to the process that caused the emission. But the most interesting challenge of the continuous monitoring of malodour in the field is the real time control of odour abatement techniques.
2. MATERIALS AND METHODS
All tests are made with arrays of tin oxide gas sensors (Figaro Engineering) but with very simple configurations: from a simple electronic board used in the field, with the sensors in static contact with ambient air, to a home-made detector more similar to a commercial electronic nose, for lab use.
The laboratory system consists of an array of 12 sensors placed in a chamber operating with a suitable hardware to maintain a gas-flow through the chamber. A computer-controlled data logger measures the sensor signals, as well as the temperature and the humidity of the chamber. The reference air (dry odourless air bubbling into saturated salt solution) and the gaseous sample lead alternately into the chamber [6-8].
The "mobile detector" is composed of a very simple electronic board on which eight tin oxide sensors are soldered, and of a battery-powered heating power supply. The sensors are simply in static contact with the ambient odorous air. The measurements are made with a portable data logger in the field after 30 min of stabilisation, and several times during the test period.
Another very simple device consisting of four sensors is placed in a shelter for several months in the field. Continuous measurement of sensor signals as well as meteorological parameters are made.
For each device, appropriate gas sensors are chosen for their ability to detect common odour pollutants: e.g. sensors having high sensitivity to air contaminants (TGS800, TGS880), to water vapour (TGS883, TGS2180), to combustible gas (TGS813, TGS842, TGS610), to toxic gases (TGS824, TGS825), or to solvents (TGS822, TGS2181, TGS2620). For all sensors, a 5-V voltage is applied to the heater resistance.
The drift of the sensor signals is not measured since no calibration with standard gas is carried out. However, no significant long-term drift is observed during the experimental period for the raw value of the sensor resistance (for the 12-sensor array) measured in the presence of the reference air. Some slight upward or downward trends can be detected, but they are always negligible with respect to the short-term noise: the zero-drift is thus negligible.
Field experiments are conducted at seven different locations where typical malodours are generated.
The sampling device or the mobile detector is always put in the vicinity of the source, at a location where the technician smells the odour. The measurements are conducted in various climatic and operating conditions. Five of the seven sources are used to validate the odour recognition principle in the field, either with the lab instrument or with the mobile detector (between March and October 1998). These are: a printing house, a paint shop in a coachbuilding, the fresh sludge aerobic treatment work in a waste water treatment plant, the oven of a rendering plant and the sheltered compost deposit area of urban waste composting facilities.
The sixth site is a landfill, where samples of odorous ambient air are collected in Tedlar® bags and later analysed with the lab instrument (September 1998). On that location, the origin of unpleasant odours are • either biogas, of which the major component is odourless methane, but also containing very odorous trace components,
• fresh refuse,
• clinker from waste incinerators, generating a pungent odour, • or, sometimes, leachates, when they are not collected.
The last source is the settling pond of a sugar factory which is investigated with the four-sensor array in a continuous way for 3 months (spring 1998).
Further discussion mainly exploits the results of either principal component analysis (PCA) or discriminant analysis (DA), both from the software package Statistica. PCA is an unsupervised method. As it does not make any prior assumption about the membership of an observation to a given class, it is essentially used to appraise
the performance of the system to recognise an odour. DA is a supervised method. It is mainly used in a second step, to build a classification model which will be applied for the identification of unknown odours. From the results of previous works, both PCA and DA were proved to be suitable methods for our needs.
In all cases, the input variable for each sensor is (1 - Rnor), where Rnor is the resistance of the sensor normalised
over all the sensor responses Ri: Rnor
The expression (1 - Rnor) varies in the same direction as the gaseous concentration. It is worth
noting that the used variable does not refer to the base-line (sensor resistance in odourless air), according to previous results [7,8].
3. RESULTS AND DISCUSSION
The genesis of the present study was the successful classification of the odours coming from 59 samples collected in the vicinity of the first five sources (printing house, paint shop, waste water, rendering and composting) and analysed with the 12-sensor lab instrument [7,8].
Surprisingly, the test of various pre-processing data algorithms pointed out that the best classification
performance was reached with a parameter free from the reference base-line obtained with pure air. Such finding is particularly valuable in the frame of the development of a field detector: the use of pure reference air could be avoided (i.e., the use of expensive and heavy gas bottle or high performance filters), as long as the sensors are allowed to periodically regenerate in the presence of ambient air. Moreover, the classification remained relevant even with varying ambient parameters (climate, exact localisation of the sampling apparatus,...), as long as sampling and learning were carried out under many different parameter conditions, and not under particular ones for a given source. These results encouraged us to go further towards the definition of a portable instrument based on the findings issued from the lab experimentation.
The present study tries to supply the concrete information requested by the final user in the field.
For the operator of the malodorous process, the first type of information should be a warning signal when the odour level increases beyond a given threshold.
To test the feasibility of such object, the data set built on the basis of the 12-sensor responses of the lab
instrument to the 59 odours sampled in Tedlar® bags in the vicinity of the five sources (16 from printing house, 11 from the rendering plant, 10 from waste water, 10 from composting and 12 from the paint shop) is filled out with 59 additional measurements on the same 12 sensors under the influence of odourless air (air from the laboratory). A total of 118 samples are thus proposed to the 12-sensor array. For one observation, and for each sensor, the signal considered for further data processing is (1 - Rnor), above defined, and recorded after
stabilisation time in the gas atmosphere (about 15 min in our case) [8]. The results of the PCA on the 118 observations in the plane of the first two factors, which represent 93% of the variance, clearly exhibit two groups. The first one includes exactly all the observations in the air, and the second one includes all the
observations near the sources, except for two "waste water" points. Indeed, for those two samples, the odour was less pronounced than the one of other days. The boundary between "Odourless" and "Odorous" thus seems to correspond to an odour intensity threshold, that may be related to the sensitivity of the sensors.
For subsequent DA on the same data set, it is a priori specified that the 59 observations on the odorous samples are in the group "Odorous" and that the other 59 must fall in the group "Odourless". With DA, all the
observations are well-classified in the corresponding group, using only one discriminant function. Then that function is validated with 81 new observations, unknown to the model: 47 from the five odorous sources and 34 from pure air. All of them are measured in June and July 1999, i.e., at least 8 months after the first experiment. Only four observations (two from "waste water" and two from "rendering") are mis-classified by the calibrated discriminant model.
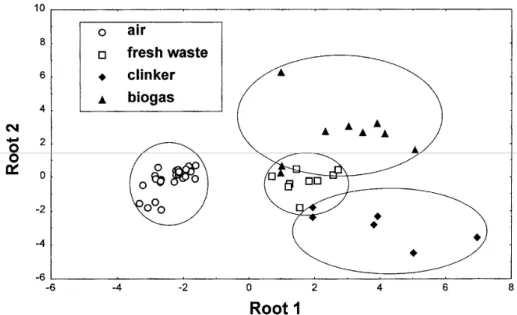
When the operator is warned of the presence of an odour, he may want to identify its origin: that is a second type of information that the instrument should supply. For that purpose, the laboratory instrument is used on 24 samples collected in the atmosphere on the same landfill site. During the sampling time, the technician tries to identify the odour with his nose. He recognised the biogas odour nine times, the clinker odour six times and the
fresh waste odour nine times (these observations correspond to the same number of samples subsequently analysed in the lab). The 24 groups of responses to the 12 sensors constitute the input data set of a DA, together with 27 additional measurements made on pure air. Fig. 1 shows the DA results in the plane of the first two discriminant functions (roots). The first root of the calibrated model separates well the odorous samples from the air ones. The second root distinguishes, rather well, the different odour sources. Such results are preliminary: future works will focus on the same application directly in the field, with a mobile detector aimed at detecting and identifying in real time the various odours generated in the landfill.
Anyhow, such test with the eight-sensor mobile detector has already been carried out for four of the five sources mentioned above (i.e.,: waste water, printing shop, paint shop in the coachbuilding and compost), and for background air, at different locations in the field, far from the sources. The test aims at the on-line identification of the odour, which is a third possible requirement for the final user of the malodour detector.
During a preliminary learning phase corresponding to 10 different days, with different climatic conditions, the mobile detector is utilised at the various locations. The result of this is a total of 77 sets of responses to the eight sensors (14 for each of the four odour sources, and 21 for the background air), which is used as input data set for DA.
Fig. 1. Results of a DA on the e-nose responses to 24 samples collected on a landfill site and 27 samples of
odourless air.
As a rule, the DA procedure supplies two kinds of functions: the discriminant functions (roots), which provide the separation among groups, typically in one- or two-dimensional space, and the classification functions, used to assign a new case into one of the known groups [9]. The latter functions are used here to identify the odour in the field. The five resulting classification functions are linear combinations of the eight signals: they lead to classification scores which are computed for each of the five groups and can be used directly to classify cases. A case is classified into the group for which it has the highest classification score. During the validation phase, the same mobile detector is moved to various spots around a given source and, at each sampling time of the data logger, the data from the sensor signals are inserted into each previously calibrated classification function to develop a classification score for each group. Figs. 2 and 3 show the graphical evolution of the five calibrated classification functions when the detector is moved around respectively in the print shop and in the waste water treatment plant.
The scaling of the horizontal time axis is unessential: it shows only that the mobile detector is continuously moving away from the source.
Fig. 2 shows that the classification function corresponding to the printing shop has, effectively, the highest value when the detector is in the printing shop, but it suddenly drops when the detector is moved outside the shop, and increases again when the technician moves back inside. As expected, the classification function characterising the outside atmosphere is the "background" one.
Fig. 2. Evolution of the DA classification functions, resulting from the learning phase with five sources, when the
portable detector is moved around in the coachbuilding.
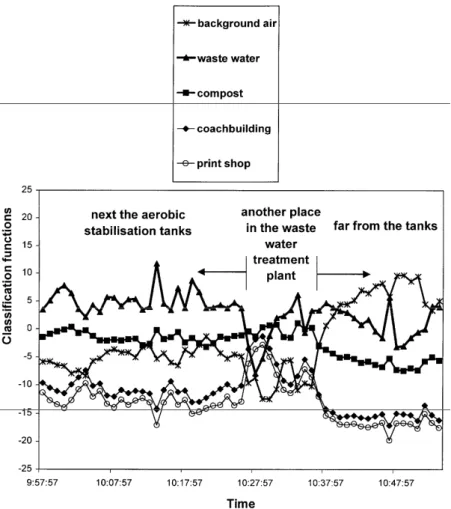
A similar observation is made in the waste water treatment plant (Fig. 3). This time, the "waste water"
classification function, calibrated for the fresh sludge aerobic treatment work, is actually above the others when the detector is near the stabilisation tanks. The instrument confuses the waste water odour with the compost one when it is shifted towards the other units of the water treatment. It completely loses the waste water odour and recognises the "background" when it is moved away far from the source.
Thus, a simple tin oxide sensor array, operating without controlled gas-flow, but with suitable preliminary training, allows a coarse qualitative recognition of a malodour source among other ones in the field.
Nevertheless, such qualitative recognition is sometimes insufficient for the operator who needs the quantitative assessment of the malodour concentration. The ability of DA classification functions to measure the odour intensity has been proven in the field, in the coachbuilding. Fig. 4 shows the evolution of the value of the classification function corresponding to the paint shop when the mobile detector is moved away from the paint spraying towards the outside. Of course, the signal of each sensor of the array decreases when the gas
concentration decreases. But here, the monitored value is actually the global response of the sensor array to the paint shop odour, i.e., the classification score computed from the previously calibrated classification function valid for paint shop. That means that it is mainly sensitive to the given odour and thus, it should decrease when at a distance from the source even if another odour influences the sensor signals, as far as the latter is known by the system.
Fig. 3. Evolution of the DA classification functions, resulting from the learning phase with five sources, when the
portable detector is moved around in the waste water treatment plant.
Fig. 4. Evolution of the DA classification function corresponding to the paint shop when the portable detector is
moved away from the paint shop spraying towards the outside.
Such finding is essential to the spirit of the advance towards a continuous monitoring of malodours in the field. Preliminary results are promising: they show that the classification model could be used to assign, continuously, malodours to environmental sources, which should be the main goal of a portable instrument. In spring 1998, a four-sensor array was placed in a permanent shelter near the settling pond of the sugar factory. An empirical algorithm, which is based on the linear combination of the four-sensor signals and corrected by the values of the
temperature and the humidity of the ambient air, was able to pinpoint some "odour events" during the day. One of them, around 9:00 a.m., was validated by the observation: it corresponded to the daily partial emptying of the pond, involving the stirring of the water and the release of malodours. However, other such "odour events" could not be further validated by the comparison with the human nose. Future works must go in that direction.
4. CONCLUSION
The various tests conducted in the field with home-made electronic noses, with very simple configurations, lead to very promising results. They point out the specifications of a portable instrument. That instrument is able to predict an unknown odour in the environment and to monitor it continuously, on the basis of the classification model calibrated during the learning phase.
The study gives some first solutions to the problems that the final user generally meets to control the odour generation from a process. It foresees some corresponding concrete applications.
• the system should be able to give a warning signal when a malodour level exceeds some given threshold: typical application is the activation of odour abatement systems;
• the results of the learning phase also allow the identification of the actual origin of the odour on site, aiming particularly at the research of the source responsible for the annoyance;
• using classification functions in the field leads to the on-line identification of the odour, which should be applied to the detection of the rise of the particular odour in the background, in order to better control the process;
• valuing the classification function corresponding to a given malodour should also lead to the on-line
assessment of its concentration: one application is the estimation of the extent of the dispersion area of the odour, and thus, the assessment of the degree of annoyance;
• monitoring continuously such classification function, together with meteorological parameters, allows the detection of particular "odour events", related to particular climatic conditions.
Finally, the lessons drawn from the study could be used as pieces of advice for the development of a field e-nose usable to detect and to monitor environmental malodours:
• unlike conventional gas detectors, a field e-nose should supply a global array response vector for each complex odour, and not separate sensor signals;
• for environmental use, there is no need for a very accurate response: a rough detection is sufficient for most applications;
• consequently, there is no need for operating conditions as restrictive as laboratory electronic nose ones, • on the contrary, in the field, the sensor responses can be influenced by the ambient temperature and by the air movement: the design of the portable instrument should take those interferences into account;
• however, the air humidity does not influence dramatically the odour recognition, as long as many different humidity conditions are included in the learning phase for a given odour.
Such conclusions are promising, but further works are still needed before reaching the final goal and to point out the boundaries of the method.
• More measurements on the same sources must be performed to be sure that the recognition of the malodorous source is not biased by interfering parameters, such as the air temperature or the gas concentration.
• Validation of the e-nose results by the comparison with human perception is essential to confirm the first trends.
• A periodical calibration with suitable gas mixture is needed to assess the span drift of the sensor signals and to take it into account in the classification algorithm.
References
[1] K.C. Persaud, S.M. Khaffaf, P.J. Hobbs, R.W. Sneath, Assessment of conducting polymer odour sensors for agricultural malodour measurements, Chem. Senses 21 (1996) 495-505.
[2] P.J. Hobbs, T.H. Misselbrook, B.F. Pain, Assessment of odours from livestock wastes by a photoionization detector, an electronic nose, olfactometry and gas chromatography-mass spectrometry, J. Agric. Eng. Res. 60 (1995) 137-144.
[3] R.M. Stuetz, R.A. Fenner, G. Engin, Assessment of odours from sewage treatment works by an electronic nose, H2S analysis and olfactometry, Water Res. 33 (1999) 453-461.
[4] J.W. Gardner, W.E. Gardner, The role of electronic nose in condition monitoring, Insight 39 (1997) 865-869. [5] R. Relia, P. Siciliano, Air quality monitoring by beans of sol-gel integrated tin oxide thin films, Sens.
Actuators, B 58 (1999) 283-288.
[6] A.C. Romain, J. Nicolas, Ph. André, In situ measurement of olfactive pollution with inorganic
semiconductors: limitations due to the influence of humidity and temperature, Semin. Food Anal. 2 (1997) 283-296.
[7] J. Nicolas, A.C. Romain, V. Wierts, J. Maternova, Ph. André, Utilisation élémentaire d'un réseau de capteurs Sn02 pour la reconnaissance d'odeurs environnementales, Eurodeur99, Paris, 15-18 June, 1999.
[8] A.C. Romain, J. Nicolas, V. Wiertz, J. Maternova and Ph. André. Use of a simple tin oxide sensor array to identify five malodours collected in the field. Accepted for publication in Sensors and Actuators B.
[9] B.G. Tabachnick, L.S. Fidell, Using Multivariate Statistics, 3rd edn., Harper Collins College Publishers, New York, 1996, 879 p.
Biographies
Jacques Nicolas is an engineer in physics. He received his PhD degree in Surface Physics in 1977 from the
University of Louvain, Belgium. In 1979, he joined Fondation Universitaire Luxembourgeoise (FUL) in Arlon, Belgium where he worked first on Solar Energy. He is currently the leader of the department "Environmental Monitoring" at FUL and he gives lectures in the field of environmental parameter measurement. His main research interest is the development of odour and indoor air pollution detectors usable in the field.
Anne-Claude Romain graduated with a degree in Chemical Sciences from the University of Liège (Ulg,
Belgium) in 1992. She received her Master's degree in Environmental Sciences from the Fondation Universitaire Luxembourgeoise (FUL, Arlon, Belgium) in 1993. Since 1995, she has been a researcher at the same university (FUL) and has been working on the development of a malodour detector.
Véronique Wiertz graduated from the University of Louvain (Belgium) in 1994 and is an engineer in chemistry
and agricultural industries. From 1994 to 1997, she worked in the same university in the field of Solid State Physics and she was an assistant for practical works of students in engineering. Since 1998, she has been working in Fondation Universitaire Luxembourgeoise (Arlon, Belgium). Her current research work aims at the development of a mobile malodour detector usable around landfills.
Jindra Maternova received an MSc degree in Chemistry from the Charles University (Prag) in 1973, and PhD in
Heterogeneous Catalysis from the Czechoslovak Academy of Sciences in 1978. In 1996, she received her Master's degree in Environmental Sciences from the Fondation Universitaire Luxembourgeoise in Arlon, Belgium. She has been working in the same university since 1998. Her current research interest includes the monitoring of indoor air quality.
Philippe André graduated with a degree in Work Engineering from the University of Louvain (UCL, Belgium) in
1983. He received his PhD degree in Environmental Sciences from FUL in 1993. He has been involved with research projects in the field of energy management of buildings (including solar energy) for more than 10 years. Currently, his main research interest concerns the development and application of innovative control algorithms applied to the use of renewable energies with some applications to landfill management.