3D Geovisualization
Identification of the best 3D viewpoint within
building models
By
Romain Neuville
Thesis submitted for the fulfillment of the degree of Doctor of
Philosophy in Sciences
December 2019
Université de Liège Faculté des Sciences Département de Géographie
iii This dissertation has been approved by
Prof. Dr. Roland Billen Co-director of research
Prof. Dr. Jacynthe Pouliot Co-director of research
The doctoral committee is composed of
Prof. Dr. Roland Billen Université de Liège, Belgium
Prof. Dr. Maria Giulia Dondero Université de Liège, Belgium
Prof. Dr. Pierre Hallot Université de Liège, Belgium
Prof. Dr. Jacynthe Pouliot Université Laval, Canada
The jury is composed of
Prof. Dr. Roland Billen Université de Liège, Belgium
Prof. Dr. Sidonie Christophe IGN-France, France
Prof. Dr. Arzu Çöltekin FHNW, Switzerland
Prof. Dr. Maria Giulia Dondero Université de Liège, Belgium
Prof. Dr. Pierre Hallot Université de Liège, Belgium
Prof. Dr. Jacynthe Pouliot Université Laval, Canada
This dissertation was carried out at the geomatics unit of the University of Liège, from October 2015 to December 2019.
v
Abstract
Geospatial data visualization, known as geovisualization, often provides great support in the comprehension of the geographic information. For instance, geovisualization is fully integrated in urban planning, from the exploratory phase (e.g., for facilitating the diagnosis of areas where something needs to be done) to the monitoring stage (e.g., for evaluating dynamics phenomena). Initially carried out in 2D, this process increasingly extents to the third dimension as a way to enhance the visual perception of the surrounding world, which is fundamentally 3D. However, this shift is not without pitfalls, both in the graphical design of 3D model and the viewpoint selection. To promote the use of the third dimension, it is therefore essential to propose new strategies that facilitate this transition. As a result, this thesis intends to contribute to 3D geovisualization field development via the first proposal that aims to formalize its process into a knowledge network including both an expression (i.e., visual stimuli) and content plan (i.e., semantic world). Following this formalization effort, we realized that moving to the 3rd dimension strengthens the role of the viewpoint, especially in order to enhance the visualization techniques relevance in achieving visual targeted purposes. Indeed, as the camera is no longer simply oriented in a classic top-down direction (which is usually the case in 2D), the point of view needs now to be configured; and, due to the 3D graphical representation, this configuration is complex, in particular because occlusion issues are inevitable. This is why this research mainly tackles the best 3D viewpoint selection issue via a geocomputational method that
vi
automates and optimizes its identification within 3D scene. Note that specific attention has been carried out to incorporate the solution into a global semantic driven visualization process. Eventually, the proposal is validated through the development of an experimental framework that aims to evaluate our solution for a given visual selectivity task: visual counting. For that purpose, an empirical test has been conducted with experts in the form of interviews using an online questionnaire.
vii
Résumé
La visualisation de données géospatiales, connues sous le terme de géovisualisation, est généralement d’un grand soutien dans la compréhension de l’information géographique. A titre d’exemple, la géovisualisation est pleinement intégrée au sein de la planification urbaine, depuis l’étape exploratoire (e.g. pour faciliter le diagnostic du territoire) jusqu’à l’étape de surveillance (e.g. dans l’évaluation des phénomènes dynamiques). Initialement opéré en 2D, ce processus s’étend de plus en plus à la troisième dimension afin d’améliorer, entre autre, la perception du monde environnant, fondamentalement 3D. Cependant, ce passage n’est pas exempt d’écueils, à la fois dans la conception graphique du modèle 3D et le choix du point de vue à adopter. Afin de promouvoir l’utilisation de la troisième dimension, il est dès lors essentiel de proposer de nouvelles stratégies qui facilitent cette transition. En conséquence, cette thèse souhaite contribuer au développement de la géovisualisation 3D au travers d’une première proposition visant à formaliser son processus et ce, sous la forme d’un réseau de connaissances incluant à la fois un plan de l’expression (i.e. les stimuli visuels) et un plan du contenu (i.e. le monde sémantique). Suivant cet effort de formalisation, nous nous sommes rendus compte que le passage à la troisième dimension renforce le rôle du point de vue, en particulier afin d’améliorer la pertinence des techniques de visualisation à accomplir des objectifs visuels donnés. En effet, puisque la caméra n’est plus simplement orientée selon une direction « top down » (ce qui est généralement le cas en 2D), le point de vue devient un paramètre configurable; et en raison de la représentation graphique 3D,
viii
cette configuration est relativement complexe, essentiellement parce que les problèmes d’occlusion sont inévitables. C’est la raison pour laquelle cette recherche se focalise essentiellement sur le problème de la sélection du meilleur point de vue 3D au travers d’une méthode géoinformatique qui automatise et optimise son identification au sein de la scène 3D. Notez qu’une attention spécifique a été portée afin d’incorporer cette solution au sein d’un processus global de visualisation à base sémantique. Finalement, notre proposition est validée au travers du développement d’un cadre expérimental visant à évaluer notre solution pour une tâche visuelle donnée de sélectivité : le comptage visuel. A cet effet, un test empirique a été conduit auprès d’experts sous la forme d’interviews utilisant un questionnaire en ligne.
ix
Acknowledgements
This thesis is the achievement of four years, during which I had the privilege to be supported by several people.
Four years ago, my supervisor, Professor Roland Billen, gave me this great opportunity to carry out this doctorate. Since the beginning, he truly assisted me with enthusiasm and guided me with patience. I sincerely thank him for his time and his knowledge that allowed me to progress in my work life.
After a year, Professor Jacynthe Pouliot is become my co-supervisor. Expert in the 3D visualization of geospatial data, she shared her expertise and gave me lots of constructive comments. Moreover, my internship at the Université Laval was extremely instructive and will remain a wonderful adventure of my life, both professional and personal.
From the beginning, I also received great support from Professor Pierre Hallot and his opening to additional application domains helped me to broaden my vision about my work. With her expertise in the semiotics field, Professor Maria Giulia Dondero allowed me to put this thesis into a broader context of the visual language.
I would also like to express my sincere thanks to Professor Jean-Paul Donnay for his valuable advice in this thesis formulation, his attentiveness and all the support offered to achieve this thesis under the best possible conditions.
x
I would like to thank Professor Yves Cornet as well for the extensive discussions about the practical issues that I met throughout this thesis. He devoted invaluable time and was always available to answer any of my questions.
Thanks to the whole geomatics unit of the University of Liège, especially to Marc Binard for his continued support in the IT aspects, and Anna Poletto for her help in the administrative follow-up.
I would also to sincerely thank my colleagues and friends Cécile Deprez, Gilles-Antoine Nys and Florent Poux for their good mood, their listening and their help during these four years.
Thanks to my entire family for their presence and their unconditional support.
Thanks to all people that I met during this thesis and thanks to all those who contributed to my personal development and my happiness.
xi Our point of view determines our perception.
xiii
Table of Contents
ABSTRACT... V RÉSUMÉ ... VII ACKNOWLEDGEMENTS ... IX TABLE OF CONTENTS ... XIII LIST OF TABLES ... XIX LIST OF FIGURES ... XX
CHAPTER 1 - INTRODUCTION ... 29
1.1 CONTEXT ... 31
1.2 PROBLEMATICS ... 35
1.2.1 Graphical inconsistency issue ... 35
1.2.2 3D viewpoint selection issue ... 37
1.3 RESEARCH QUESTIONS ... 41
1.4 RESEARCH OBJECTIVES ... 43
1.5 RESEARCH METHODOLOGY ... 44
1.6 CONTRIBUTIONS OF THIS WORK ... 45
1.7 THESIS ORGANIZATION ... 46
CHAPTER 2 - 3D GEOVISUALIZATION FORMALIZATION ... 51
2.1 PREFACE ... 53
2.2 ABSTRACT ... 53
2.3 INTRODUCTION ... 54
xiv
2.4.1 Definition ... 57
2.4.2 Graphics ... 58
2.4.3 3D Environment Settings ... 62
2.4.4 Enhancement techniques ... 63
2.5 VIRTUAL 3DCITY MODELS ... 63
2.5.1 Definition and Benefits ... 63
2.5.2 Semantic Driven Visualization ... 65
2.6 KNOWLEDGE NETWORK CONFIGURATION ... 68
2.6.1 Introduction ... 68
2.6.2 Mathematical Framework ... 70
2.6.3 Illustration with Static Retinal Variables and 3D Environment Parameters for Selectivity Purposes ... 74
2.7 EXAMPLES OF KNOWLEDGE NETWORK APPLICATION ... 81
2.7.1 Application Chart ... 81
2.7.2 Dynamic WebGL Application ... 83
2.7.3 OGC Symbology Encoding Extension ... 86
2.8 DISCUSSION AND CONCLUSIONS ... 90
CHAPTER 3 - 3D VIEWPOINT MANAGEMENT ... 95
3.1 PREFACE ... 97
3.2 ABSTRACT ... 97
3.3 INTRODUCTION ... 98
3.3.1 3D Geovisualization and Urban Planning ... 98
3.3.2 3D Occlusion Management Review... 100
3.4 METHODOLOGICAL FRAMEWORK ... 103
xv 3.4.2 Camera Settings ... 106 3.5 VIEWPOINT MANAGEMENT ... 109 3.5.1 Introduction ... 109 3.5.2 Method... 110 3.6 NAVIGATION ... 118 3.6.1 Introduction ... 118 3.6.2 Method... 119
3.7 ILLUSTRATION TO THE VIRTUAL 3DLOD2CITY MODEL OF BRUSSELS ... 122
3.7.1 Web Application ... 122
3.7.2 Urban Indicator ... 124
3.7.3 Viewpoint Management Algorithm ... 125
3.7.4 Flythrough Creation Algorithm ... 128
3.7.5 Conclusion ... 129
3.8 DISCUSSION ... 130
3.8.1 Viewpoint Management Algorithm Complexity ... 130
3.8.2 Advantages ... 131
3.8.3 Limitations and Perspectives ... 132
3.9 CONCLUSIONS ... 135
CHAPTER 4 - EXPERIMENTAL STUDY ... 139
4.1 PREFACE ... 141
4.2 ABSTRACT ... 141
4.3 INTRODUCTION ... 142
4.3.1 Context ... 142
xvi
4.3.3 Case study and research questions ... 146
4.3.4 Software architecture ... 149 4.4 EXPERIMENTATION DESIGN ... 151 4.4.1 Empirical approach ... 151 4.4.2 3D Building model ... 152 4.4.3 Online questionnaire ... 154 4.5 RESULTS ... 159 4.5.1 Participants’ profile ... 159
4.5.2 Statistical Analysis: Overview ... 160
4.5.3 Is a 3D viewpoint based on the maximization of 3D geometric objects’ view area more accurate for the selectivity task of a set of objects within a virtual 3D building model compared to the default combined software points of view? ... 160
4.5.4 Does a 3D viewpoint based on the maximization of 3D geometric objects’ view area enhance the user’s certainty when visually selecting a set of objects within a virtual 3D building model compared to the default combined software points of view? ... 163
4.5.5 Does a 3D viewpoint based on the maximization of 3D geometric objects’ view area make the selectivity task of a set of objects faster within a virtual 3D building model compared to a given default software point of view? 165 4.5.6 Do the user’s attributes (background training, decision-making level, and experience in 3D visualization) influence the usability of the 3D viewpoint that maximizes the 3D geometric objects’ view area inside the viewport? ... 167
xvii
4.6 DISCUSSION ... 167
4.6.1 Back to the research questions ... 167
4.6.2 3D viewpoint in the 3D geovisualization process ... 169
4.6.3 Limitations and perspectives ... 170
4.7 CONCLUSIONS ... 172
CHAPTER 5 - BACK TO THIS RESEARCH ... 177
5.1 PREFACE ... 179
5.2 REFLEXIVE FEEDBACK ... 179
5.2.1 Chapter 2 - 3D Geovisualization ... 179
5.2.2 Chapter 3 - 3D Viewpoint Management ... 181
5.2.3 Chapter 4 – Experimental study ... 182
5.3 PERSPECTIVES ... 184
5.3.1 How to model and visualize 3D topological relationships? ... 184
5.3.2 How to benefit from the viewpoint management algorithm within the 3D data acquisition process? ... 196
5.3.3 How to use deep learning to automatically extract features that define the viewpoint optimality? ... 197
5.3.4 How to take advantage of the viewpoint management algorithm to produce visual cues that assist navigation and interaction within geovirtual environments visualized through stereoscopic vision? ... 198
5.3.5 How to use the viewpoint management algorithm to assist a multi-LODs graphical representation of virtual 3D city models? ... 199
CHAPTER 6 - CONCLUSIONS AND RECOMMENDATIONS ... 205
xviii
6.2 BACK TO THE RESEARCH OBJECTIVES ... 207
6.2.1 Formalizing the 3D visualization process of geospatial data ... 207
6.2.2 Proposing a theoretical and operational solution to the 3D viewpoint selection issue in order to enhance the visualization of the underlying semantic information ... 208
6.2.3 Evaluating the proposal for a given visual task related to the selectivity purpose. ... 208
6.3 BACK TO THE RESEARCH QUESTIONS ... 209
6.4 CONTRIBUTION TO KNOWLEDGE ... 210
6.5 FUTURE RESEARCH ... 211
BIBLIOGRAPHY ... 217
APPENDIX 1 – ONLINE QUESTIONNAIRE RESULTS ... 253
APPENDIX 2 – ONLINE QUESTIONNAIRE STATISTICAL ANALYSES ... 271
1–ANALYSIS OF THE VISUAL COUNTING ACCURACY VIA AN EXACT BINOMIAL TEST (SOFTWARE R) ... 271
2–ANALYSIS OF THE USERS’ CERTAINTY VIA A CHI-SQUARED TEST (SOFTWARE R) ... 274
3–ANALYSIS OF THE VISUAL COUNTING SPEED VIA AN ONE-WAY ANOVA TEST (SOFTWARE R) ... 277
xix
List of Tables
Table 1 : State-of-the-art of static retinal variables defined over the last fifty years ... 59
Table 2 : Interpretation tasks of static retinal variables (Bertin, 1967). 61 Table 3 : Sets and operators definition ... 69
Table 4 : Taxonomy of 3D occlusion management techniques based on (Elmqvist & Tsigas, 2007) ... 101
Table 5 : Example of outputs provided by the viewpoint management algorithm. For each viewpoint, the algorithm stores the ratio of visible pixels per object and the total sum... 116
xx
List of Figures
Figure 1 : Example of overlapping situations in the Netherlands. The 2D cadastral map shows its limits in the graphical representation of the complex estate property, from (Biljecki et al., 2015) ... 33
Figure 2 : Yearly irradiation sum (expressed in kWh/m2/year) for building points at the Technical University of Munich campus and surrounding buildings, from (Willenborg et al., 2018) ... 34
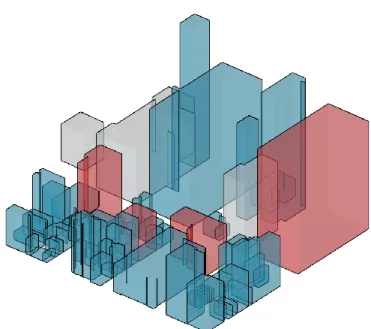
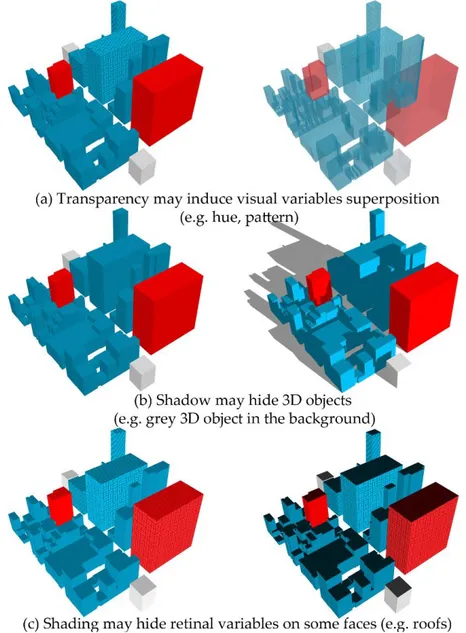
Figure 3 : The application of transparency (as an occlusion management technique) induces a visual superposition of hue among the geometric objects (building features of a virtual 3D LOD1 city model of New York provided by the Technical University of Munich). ... 36
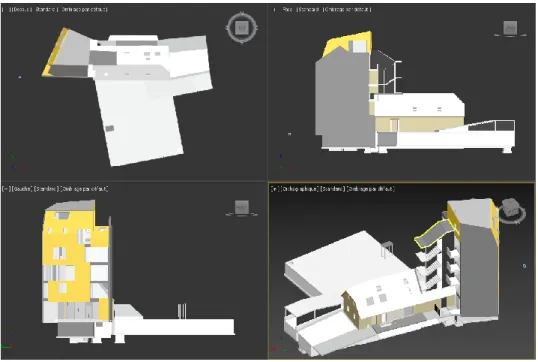
Figure 4 : Multiple viewports of a 3D building (up, front, left and at 45°) provided by Autodesk® and visualized through Autodesk® 3ds Max.. 38
Figure 5 : Projection distorter: multi-perspective view of a virtual 3D city model, from (Lorenz et al., 2008) ... 39
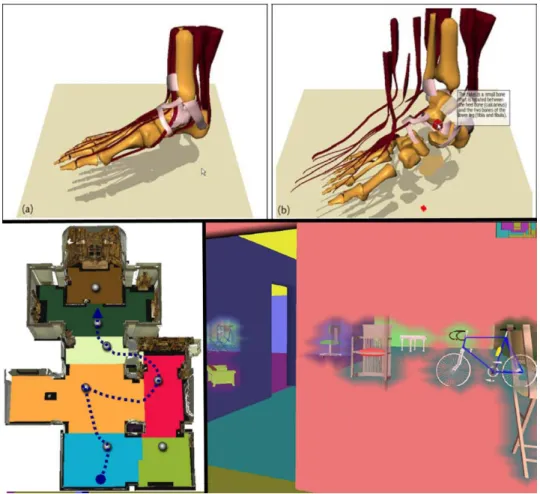
Figure 6 : Interactive exploder of a 3D foot model on the upper image, from (Sonnet et al., 2004); tour planner within a 3D church model on the lower left image, from (Andujar et al., 2004); and virtual X-Ray (dynamic transparency) on the lower right image, from (Elmqvist et al., 2007) ... 40
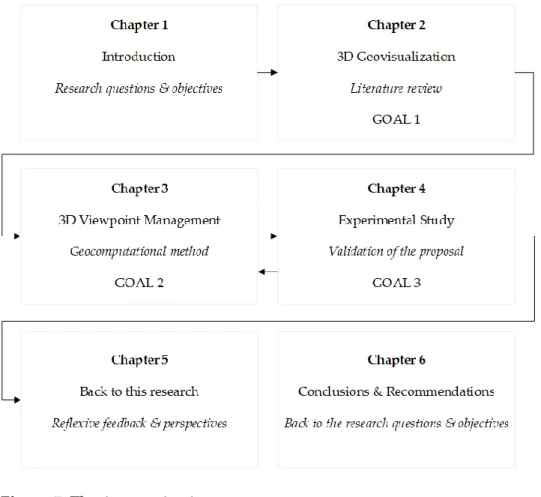
Figure 7 : Thesis organization ... 48
Figure 8 : Key components of 3D geovisualization ... 58
Figure 9 : Part of a virtual 3D LOD1 city model of New York (building features) provided by the Technical University of Munich and visualized with ArcGlobe ... 65
xxi
Figure 10 : Consequences between a set of static visual variables and 3D environment settings ... 77
Figure 11 : Incompatibilities among a set of static visual variables and 3D environment settings ... 78
Figure 12 : Incompatibilities between pattern and grain for selectivity purpose ... 79
Figure 13 : Potential incompatibilities between a set of visual variables and 3D environment settings. ... 80
Figure 14 : An application chart (extension version of (Neuville et al., 2017)) for assisting the visualization of selectivity purpose of virtual 3D city models. Static visual variables are categorized into three classes: visibility (vis.), appearance, and geometry (geom.). ... 83
Figure 15 : A dynamic WebGL application for assisting the visualization process of 3D geospatial data. Multiple views of the 3D model (times t1 to t3) are shown to highlight the visualization process. 85
Figure 16 : A warning window to inform users against potential incompatibilities. ... 86
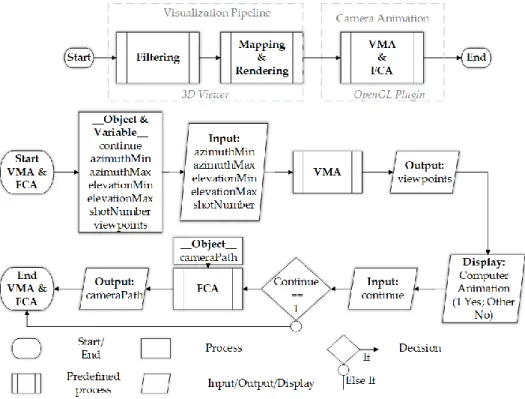
Figure 17 : 3D geovisualization process including an automatic computer animation (ISO 5807). VMA: viewpoint management algorithm; FCA: flythrough creation algorithm. ... 104
Figure 18 : The virtual camera settings: camera position, camera orientation, focal length, and vision time ... 108
Figure 19 : Hidden faces increase within perspective projections (left) versus parallel projections (right) when moving to camera position 2. 109
xxii
Figure 20 : Sampling of viewpoints to be processed for visualizing randomly selected buildings around Madison Square Park (virtual 3D LOD1 city model of New York). Five hundred viewpoints (black) are equally distributed between 0 and 90 degrees of elevation. The selected buildings spatial bounding box is represented in blue and its center in green. ... 112
Figure 21 : Example of numerical image to be processed. Selected buildings are displayed in different grey levels; additional buildings are in black ... 114
Figure 22 : A visibility sphere. Viewpoints in black do not allow an
overview of all objects of interest (red buildings). The other points of view are categorized with an equal interval ranking method. ... 117
Figure 23 : An automatic camera path for exploring a set of objects of interest (red buildings) within the virtual 3D city model of New York. Successive viewpoints are displayed in black. The 3D model overview starts at position 1 and turns clockwise. Then, the camera moves to the best global viewpoint (position 2) before visualizing local points of view (3, 4, 5, and 6). The 3D geospatial model and OOIs’ bounding boxes and their center are respectively displayed in yellow and blue. Note that the camera orientation shifts to the OOIs’ bbox center (blue) when moving to the global viewpoint. ... 120
Figure 24 : A web application developed as a 3D viewer and including the viewpoint and flythrough creation algorithms (Viewpoint and Animation tabs). The Mapping and Rendering tabs assist the 3D geovisualization process. ... 123
xxiii
Figure 25 : A virtual 3D LOD2 city model of the European Quarter (Brussels). The subway and railway stations are colored from yellow to red, respectively for small to large areas of influence. ... 125
Figure 26 : Viewpoints in black do not allow an overview of all stations. The other points of view are categorized with an equal interval ranking method. ... 126
Figure 27 : The best global viewpoint for the whole set of railway and subway stations. ... 127
Figure 28 : The best local viewpoints for the whole set of railway and subway stations. Optimally viewed stations are highlighted in green. 128
Figure 29 : An automatic camera path for exploring the railway and subway stations within the virtual 3D LOD2 city model of Brussels (European quarter). The time flow is displayed with a hues gradient, from white to red. ... 129
Figure 30 : A full RESTful web application managing 3D viewpoint ... 134
Figure 18: A 3D viewpoint and its components: camera position,
orientation, focal length, and vision time from (Neuville et al. , 2019)...146
Figure 30: A complete RESTful web application managing the 3D
viewpoint. The 3D visualization process is carried out client-side (via WebGL) while the computation process is supplied server-side thanks to Node.js and three.js, from (Neuville et al., 2019)) ... 150
Figure 31 : A 3D building model and example of visual detection of rooms with an internal too-high temperature ... 153
xxiv
Figure 32 : Website: Participants’ attributes (section 1 of the questionnaire) ... 156
Figure 33 : Website: contextual setting of the survey (section 2 of the questionnaire) ... 157
Figure 34 : Website: the first three simulations of the survey (section 3 of the questionnaire) ... 158
Figure 35 : Exact binomial test. Visual counting success rate associated to the 3D viewpoint maximizing the 3D geometric objects’ view area inside the viewpoint (BPOV) and the four default combined software side points of view (4POV). ... 161
Figure 36 : Distribution of absolute differences between the theoretical and user’s visual counting values per view type. 4POV: the four default combined software side points of view; BPOV: the best point of view, i.e., the viewpoint maximizing the 3D geometric objects’ view area within the viewport. ... 162
Figure 37 : Distribution of users’ certainty degree in performing the visual counting per view type; 4POV: the four default combined software side points of view; BPOV: the best point of view, i.e., the viewpoint maximizing the 3D geometric objects’ view area within the viewport. The categories 0, 1, and 2 (respectively, totally uncertain, quite uncertain, and quite certain) have been merged to meet the minimum number of observations per class (5). ... 164
Figure 38 : One-way ANOVA. Visual counting speed per view type associated to the 3D viewpoint maximizing the 3D geometric object’s view area inside the viewpoint (the best 3D point of view) and the single side
xxv 3D points of view. 4POV: one of the the four default software side point of view; BPOV: the best point of view, i.e., the viewpoint maximizing the 3D geometric objects’ view area within the viewport. ... 166
Figure 39 : Virtual 3D model of the Planetarium Rio Tinto Alcan (Montreal) in which easements are represented in yellow. In this survey, participants have to identify the topological relationship between an object in blue and an easement in yellow. In this example, the blue object intersects an easement (in yellow). ... 186
Figure 40 : Example of simulations visualized from the four combined default software points of view (disjoined objects): top viewpoint (upper left), side viewpoints (upper right and lower left) and 45° viewpoint (lower right) ... 187
Figure 41 : Example of simulations visualized from a point of view that maximizes the visibility of 3D geometric objects’ view area inside the viewport (intersected objects) ... 188
Figure 42 : Exact binomial test. Success rate of visual 3D topological relation identification among disjoined geometric objects per view type. 4POV: the four combined default software points of view; BPOV: the best point of view, i.e., the viewpoint maximizing the 3D geometric objects’ view area within the viewport... 190
Figure 43 : Exact binomial test. Success rate of visual 3D topological relation identification among intersected geometric objects per view type. 4POV: the four combined default software points of view; BPOV: the best point of view, i.e., the viewpoint maximizing the 3D geometric objects’ view area within the viewport... 191
xxvi
Figure 44 : Distribution of users’ certainty degree in identifying the visual 3D topological relation among disjoined geometric objects per view type; 4POV: the four combined default software points of view; BPOV: the best point of view, i.e., the viewpoint maximizing the 3D geometric objects’ view area within the viewport. The categories 0, 1, and 2 (respectively, totally uncertain, quite uncertain, and quite certain) have been merged to meet the minimum number of observations per class (5).
193
Figure 45 : Distribution of users’ certainty degree in identifying the visual 3D topological relation among intersected geometric objects per view type; 4POV: the four combined default software points of view; BPOV: the best point of view, i.e., the viewpoint maximizing the 3D geometric objects’ view area within the viewport. The categories 0, 1, and 2 (respectively, totally uncertain, quite uncertain, and quite certain) have been merged to meet the minimum number of observations per class (5).
CHAPTER
1
Introduction
Chapter 1 - Introduction
31
1.1 Context
With a data feed of up to 107 bits per seconds, sight is the most powerful sensory medium among all human senses (Franke, 1977). For this purpose, vision is extensively used in apprehending geospatial phenomena and is become a research area, called geovisualization. Defined as the field that provides both theories and methods for visually exploring, analyzing, summarizing and presenting geospatial data (MacEachren & Kraak, 2001), geovisualization aims to process and interpret the data into information, and ultimately into knowledge.
Conventionally, geospatial data have been visualized in two dimensions (i.e., via a set of planimetric coordinates) until recent and significant developments in data acquisition techniques (LiDAR, photogrammetry, and remote sensing) and computer sciences (storage and processing) make the third geometric dimension (mainly the height or the Z coordinate of objects) more accessible for both experts and non-professional users (Kwan, 2000). Technically, 3D geovisualization, i.e. the three-dimensional visualization process of 3D geospatially referenced data, intends to display a 3D geospatial model, i.e., a volumetric representation of real objects, to users (Wang, 2015). This is usually performed on digital screens (e.g., desktop computer, laptop, and tablet), but the development of technologies, such as head-mounted displays and CAVE (Cave Automatic Virtual Environment) systems, now makes the stereoscopic 3D experience possible (Milgram & Kishino, 1994).
1.1 Context
32
From a cognitive perspective, there is clear evidence that shifting to the third dimension enhances the geospatial data apprehension as it is more consistent with the human visual system (Jobst & Döllner, 2008; Ware et al., 1993). Indeed, due to a more natural interaction with the spatial content (Carpendale, 2003; Egenhofer & Mark, 1995; Jobst & Germanchis, 2007), 3D enables a more direct cognitive reasoning about geographical and temporal phenomena. For instance, the perception of depth may be enhanced, in particular via psychological (e.g., linear perspective and occlusion) and even physiological cues (e.g., binocular disparity and eye convergence) (Kraak, 1988; Okoshi, 1976). On the other hand, overlapping situations (e.g., property units within a multi-story building, utilities networks located above and under the ground) are better supported in 3D as the third dimension improves the visual understanding of their multi-level properties (Kwan & Lee, 2005; Zlatanova et al., 2004); this is especially the case for cadastre (Figure 1) and systems used for evacuating people from large public and business buildings (Meijers, Zlatanova, & Pfeifer, 2005; Pouliot et al., 2018).
Chapter 1 - Introduction
33 Figure 1: Example of overlapping situations in the Netherlands. The 2D cadastral map shows its limits in the graphical representation of the complex estate property, from (Biljecki et al., 2015)
Hence, an ever-increasing number of processes, from education to business applications (e.g., civil engineering, geology, and archeology), and decision-making procedures nowadays incorporate virtual 3D models to support their achievement (Abdul-Rahman & Pilouk, 2008; Bandrova, 2005; Calcagno et al., 2008; Huk, 2006; Jazayeri et al., 2014; Kaden & Kolbe, 2013; Lee, 2012). For instance, virtual 3D city models (i.e., virtual urban environments with a three-dimensional representation of common geometric urban objects (Billen et al., 2014)) have become extremely valuable for cities as they facilitate and support the planning and managing of urban areas, both for contractors (e.g., real estate developers, renovation and construction companies), political decision
1.1 Context
34
Figure 2: Yearly irradiation sum (expressed in kWh/m2/year) for building points at the Technical University of Munich campus and surrounding buildings, from (Willenborg et al., 2018)
makers, and citizens. This is why, to date, an ever-greater number of cities (e.g., Berlin, Montreal, Paris, Zürich, Rotterdam, Helsinki, and Abu Dhabi) manipulate virtual 3D city models for the management, integration, presentation, and distribution of complex urban geoinformation (Figure 2) (Döllner et al., 2006).
Chapter 1 - Introduction
35
1.2 Problematics
1.2.1 Graphical inconsistency issue
From a theoretical and methodological point of view, 3D geovisualization is partly based on the rules of the graphics, i.e. the graphical section of semiotics. Defined as the field that studies the relationship between the expression plan (i.e., visual stimuli within the graphics) and the content plan (i.e., the semantic world)1 (Edeline et al., 1992), graphics has already provided a wide range of semiotic connections (also called codes). For that matter, Bertin’s visual variables, combined with his interpretation tasks, are a clear example of the contribution of graphics to 2D geovisualization, and whilst a transposition of these semiotic relationships is feasible in 3D, some caution is needed.
Indeed, although numerous scientific studies have shown that the third dimension improves the understanding of geospatial phenomena in many application contexts (Dubel et al, 2014; Herbert & Chen, 2015; Kwan & Lee, 2004; Shojaei et al., 2013; Zhou et al., 2015), they also highlight the higher complexity within the visualization process of such data in three dimensions. Indeed, moving to the third dimension implies additional
1 The existence of these two plans (expression and content) assume that the conflicts occurring on them are inherently associated in order to produce semiotic relationships, i.e. codes.
1.2 Problematics
36
Figure 3: The application of transparency (as an occlusion management technique) induces a visual superposition of hue among the geometric objects (building features of a virtual 3D LOD1 city model of New York provided by the Technical University of Munich).
configurations, especially linked to the rendering of the 3D scene (e.g., lighting, shading, and depth of field). For instance, shading is usually applied to volumetric objects as it assists in revealing their shapes (Ware, 2012). Although useful, this rendering setting leads to locally influence the visual objects’ perception in lightness and saturation (Jobst et al., 2008), which in the end may distort the underlying semantic information. The same is also true among mapping visualization techniques. For example, transparency (as an occlusion management technique) may induce a superposition of retinal variables (Figure 3).
Chapter 1 - Introduction
37 As a result, in this research project, we hypothesize that the formalization of graphic design principles is possible and corresponds to a valuable approach to prevent the appearance of graphical (and subsequently semantic) inconsistency when mapping and rendering 3D models.
1.2.2 3D viewpoint selection issue
Aside the aforesaid issue, shifting to the 3rd dimension also strengthens the role of the viewpoint in the visualization process of geospatial data. Indeed, as the camera is no longer simply oriented in a classic top-down direction (which is usually the case in 2D), the point of view now needs to be configured; and, due to the 3D graphical representation of geometric objects2, this configuration is complex, in particular because occlusion issues are inevitable. This is especially true for 3D city models where the high density of 3D geometric objects to be displayed and their location (both above and under the ground) necessarily lead to visual clutter and occlusion, which eventually may make the representativeness of objects and their spatial relationships more complex (Andrienko et al., 2008; Elmqvist & Tudoreanu, 2007; Li & Zhu, 2009).
2 In a 3D visualization context, geometric objects are defined as any objects located in a 3D universe (x,y,z) and built from one of the geometric primitives (point, curve, surface, and volume) defined within the spatial schema ISO 19107:2003 (Pouliot, Badard, Desgagné, Bédard, & Thomas, 2008).
1.2 Problematics
38
Figure 4: Multiple viewports of a 3D building (up, front, left and at 45°) provided by Autodesk® and visualized through Autodesk® 3ds Max
For that purpose, a taxonomy of 3D occlusion management techniques has been carried out in (Elmqvist & Tsigas, 2007). More than twenty methods have been analyzed and classified into five archetypical design patterns: multiple viewports (Figure 4), projection distorter (Figure 5), interactive exploder, tour planner, virtual X-Ray (Figure 6). Technically, this categorization has been established on the basis of six properties: the visual task to be primarily performed, the maximum handled objects’ interaction, the strength of disambiguation cues, the layout of the visual substrate, the user’s interaction, and the degree of objects’ invariance (in terms of location, geometry, and appearance).
Chapter 1 - Introduction
39 Figure 5: Projection distorter: multi-perspective view of a virtual 3D city model, from (Lorenz et al., 2008)
From a practical point of view, this taxonomy is helpful in selecting the most appropriate occlusion technique(s) as a function of the 3D environment setting and the visual task(s) to be executed. For instance, using transparency (classified into the virtual X-Ray category) can significantly improve the visibility of objects enclosed or contained within other objects (e.g., rooms inside a 3D building, pipes and electricity networks under the ground). However, it also reduces the perception of depth and makes the spatial relations evaluation more complex. As a result, the choice of the most suitable occlusion technique(s) is a function of the user’s requirements, and is thus defined on a case-by-case basis.
1.2 Problematics
40
Figure 6: Interactive exploder of a 3D foot model on the upper image, from (Sonnet et al., 2004); tour planner within a 3D church model on the lower left image, from (Andujar et al., 2004); and virtual X-Ray (dynamic transparency) on the lower right image, from (Elmqvist et al., 2007)
Nevertheless, there is one aspect that is common to all occlusion situations and that no existing technique currently solves: the point of view selection inside the 3D scene. Independently of the occlusion technique(s) applied
Chapter 1 - Introduction
41 to the 3D model, an unsuitable 3D viewpoint3 can drastically reduce or even totally annihilate the visibility of given geometric objects within the 3D scene. For instance, the application of transparency, the use of multiple visualization windows, and/or a multi-perspective view of the 3D scene can significantly decrease the quantity of hidden objects (Lorenz et al., 2008; Röhlig & Schumann, 2016; Wang et al., 2017), although this affirmation is conditioned by the ultimate 3D point(s) of view from which users visualize the objects. This is why managing the virtual camera inside the 3D environment is prominent (Rautenbach et al., 2015); and finding the most appropriate point of view out for a set of 3D geometric objects is usually a high time-consuming task, which especially depends on the 3D model complexity and is independently of the user’s expertise.
1.3 Research questions
On the basis of above, this thesis supports the idea that the viewpoint is a fundamental parameter in 3D geovisualization, making the use of visualization techniques relevant for the development of a semiotics linked to 3D geospatial data. To emphasize this proposal, 3D
3 A 3D viewpoint is defined as the cross-product of four components: the camera position, orientation, the focal length, and the vision time. The two first parameters are 3D vectors which respectively represent a 3D camera location and a 3D viewing direction into the world coordinate system. The focal length is the distance between the projection center and projection plane, which sets the field of view. Eventually, in case of a computer animation combining multiple points of view, a vision time can be given to each 3D viewpoint.
1.3 Research questions
42
geovisualization must first and foremost be formalized so as to encompass the 3D point of view into a global semantic driven visualization process. Furthermore, as the field remains unstructured, especially from a semiotic point of view (i.e., incorporating both an expression and content plan), this initial stage will also tackle the graphical inconsistency issue and we do believe that it might improve the 3D visualization process of geospatial data.
In this research, the attention is focused on the visualization of virtual 3D buildings as these volumetric features are both part of 3D city models (employed in more than 100 application domains (Biljecki et al., 2015)) and constitute the backbone of the building information modeling (BIM), of which the objective is to assist the construction, management, and maintenance of facilities (Abbasnejad & Moud, 2013; Azhar, 2011; Czmoch & Pękala, 2014). This is why we raise the following global research question:
Does it exist an optimal 3D viewpoint for visualizing a set of geometric objects within 3D building models?
In this thesis, we claim that there exists at least one optimal 3D viewpoint, and this point of view is a function of the objects’ view area inside the viewport, i.e. the visualization window inside a digital display.
Additionally, three specific questions are raised in order to incorporate the semantic world into the global context of this research. Attention is focused on a given interpretation task: the selectivity purpose, i.e. the
Chapter 1 - Introduction
43 visual capacity to extract a set of 3D objects belonging to the same semantic category. Furthermore, the default software points of view are used in the evaluation of our proposal. Hence, the specific research questions are:
1. Is a 3D viewpoint based on the maximization of 3D geometric objects’ view area more accurate for the selectivity task of a set of objects within a virtual 3D building model compared to the default combined software points of view?
2. Does a 3D viewpoint based on the maximization of 3D geometric objects’ view area enhance the user’s certainty when visually selecting a set of objects within a virtual 3D building model compared to the default combined software points of view?
3. Does a 3D viewpoint based on the maximization of 3D geometric objects’ view area make the selectivity task of a set of objects faster within a virtual 3D building model compared to a given default software point of view?
1.4 Research objectives
The global aim of this thesis is to enhance the 3D visualization process of
virtual building models in achieving given user-centered visual purposes. The achievement of this goal is carried out through the
1.5 Research methodology
44
1. Formalizing the 3D visualization process of geospatial data in order to produce more consistent (i.e., unambiguous) graphic (and ultimately semantic) representations;
2. Proposing a theoretical and operational solution to the 3D viewpoint selection issue in order to enhance the visualization of the underlying semantic information;
3. Evaluating the proposal for a given visual task related to the selectivity purpose.
1.5 Research methodology
In order to address the research objectives, a three levels approach is elaborated and is in accordance with the scientific hypothetico-deductive method.
First, an extensive literature review of academic papers and books is carried out in order to provide a clear understanding of the 3D geovisualization field along with previous research outcomes. It lays the foundation of key concepts related to the 3D visualization process of geospatial data and defines the connections among them. As a result, this former stage aims to establish the theoretical background of this research and to give structure to 3D geovisualization (the first research objective).
Then, we address the ubiquitous 3D viewpoint selection issue via a
Chapter 1 - Introduction
45
identification within a broad semantic driven visualization process. This
second phase is carried out to achieve the second goal of this research.
Eventually, a validation stage is performed in order to evaluate the previous solution in achieving a given visual selective task: visual counting. For this purpose, a specific case study is designed and aims to support the proposal through an empirical study carried out with specialists. As such, this stage addresses the third objective of this thesis.
1.6 Contributions of this work
The main contributions of this research can be summarized as follows:
1. The first attempt to formalize the 3D geovisualization process through the development of a knowledge network from which researchers can take advantage for the definition of suitable graphic design guidelines;
2. The development of a geocomputational method that automates and optimizes the 3D viewpoint selection as a way of maximizing the visualization of the underlying semantic information;
3. The development of an experimental framework that evaluates graphic design guidelines, which is the prerequisite to support the development of user-centered solutions;
4. The first client-server application that assists users in the 3D visualization process of geospatial data, both in the graphical representation and the 3D viewpoint selection.
1.7 Thesis organization
46
1.7 Thesis organization
Chapter 2, 3D Geovisualization, gives an overview of the literature in the 3D geovisualization field, extracts its key components from the graphics and computer graphics fields, and formalizes its process both in the expression and content plans (research objective 1). This chapter is based on A Formalized 3D Geovisualization Illustrated to Selectivity Purpose of Virtual 3D City Model, an article published within the “ISPRS International Journal of Geo-Information” in May 2018.
Chapter 3, 3D Viewpoint Management, addresses the 3D viewpoint selection issue through an automatic camera management within the 3D scene (research objective 2). A geocomputational method is designed and aims to maximize the view area of selected 3D geometric objects in the user’s visualization window. This chapter is based on 3D Viewpoint Management and Navigation in Urban Planning: Application to the Exploratory Phase, an article published within the “Remote Sensing” journal in January 2019.
Chapter 4, Experimental Study, deals with the evaluation of our proposal within building information modeling. As a result, this chapter presents the design, implementation and statistical analysis of an empirical test related to visual counting of assets within a building model (research objective 3). This chapter is based on Identification of the Best 3D Viewpoint within the BIM Model: Application to Visual Tasks Related to Facility Management, an article published within the “Buildings” journal in July 2019.
Chapter 1 -Introduction
47 Chapter 5, Back to this research, provides a reflexive feedback on the previous chapters and addresses a set of future research opportunities into a broader context of 3D geospatial data acquisition and visualization.
Chapter 6, Conclusions and Recommendations, goes back to research questions and objectives. It also highlights the outcomes of this research and how it contributes to knowledge. Ultimately, this chapter ends with research perspectives.
The thesis organization (as described above) is schematically presented in Figure 7.
1.7 Thesis organization
48
CHAPTER
2
3D geovisualization
formalization
Chapter 2 – 3D geovisualization formalization
53
2.1 Preface
This chapter is based on A Formalized 3D Geovisualization Illustrated to Selectivity Purpose of Virtual 3D City Model, an article published within the “ISPRS International Journal of Geo-Information” in May 2018. It reviews the literature related to the 3D geovisualization field and establishes the theoretical framework of this research. In this way, it proposes the first attempt to formalize the 3D visualization process of geospatial data from a semiotics point of view. Developed as a knowledge network that encompasses the key 3D geovisualization components, it aims to tackle the graphical inconsistency issue when designing 3D geospatial models. Furthermore, this chapter formalizes the key role of 3D viewpoint as a fundamental parameter that determines the visibility of geometric objects to which visualization techniques have been applied. However, to date, its management is manually fixed by the designer, who tries to reduce at best the occlusion issue on a set of selected features. Hence, the automation of the 3D viewpoint selection within the 3D scene is still a challenge to be solved and is tackled in Chapter 3.
2.2 Abstract
Virtual 3D city models act as valuable central information hubs supporting many aspects of cities, from management to planning and simulation. However, we noted that 3D city models are still underexploited and believe that this is partly due to inefficient visual communication channels across 3D model producers and the end-user.
2.3 Introduction
54
With the development of a formalized 3D geovisualization approach, this chapter aims to support and make the visual identification and recognition of specific objects in the 3D models more efficient and useful. The foundation of the proposed solution is a knowledge network of the visualization of 3D geospatial data that gathers and links mapping and rendering techniques. To formalize this knowledge base and make it usable as a decision-making system for the selection of styles, second-order logic is used. It provides a first set of efficient graphic design guidelines, avoiding the creation of graphical conflicts and thus improving visual communication. An interactive tool is implemented and lays the foundation for a suitable solution for assisting the visualization process of 3D geospatial models within CAD and GIS-oriented software. Ultimately, we propose an extension to OGC Symbology Encoding in order to provide suitable graphic design guidelines to web mapping services.
Keywords: 3D geospatial data; 3D geovisualization; Styled Layer
Descriptor; Symbology; Encoding; virtual 3D city model; 3D semiotics; graphics; computer graphics; mapping; rendering; graphical conflict
2.3 Introduction
In the administration of cities, virtual 3D city models are extremely valuable, as they constitute 3D geovirtual environments serving many application fields: e.g., urban planning, facility management, mobile telecommunication, environmental simulation, navigation, and disaster management (Altmaier & Kolbe, 2003; Döllner et al., 2006; Sinning-Meister
Chapter 2 – 3D geovisualization formalization
55 et al., 1996). For that matter, the development of standards, such as CityGML (Open Geospatial Consortium, 2006), played a key role in extending virtual 3D city models into relevant central information hubs to which many applications can attach their domain information (Kolbe, 2009). However, it does not necessarily mean that people can directly and efficiently communicate with each other because they have a common information model at their disposal.
To achieve this, a communication channel must be designed and set up across stakeholders. As sight is one of the key senses for information communication (Ward et al., 2010), the link could be carried out by an appropriate 3D geospatial data visualization as a means of effectively exchanging contextual knowledge (Batty et al., 2000; Glander & Döllner, 2009). Nevertheless, there is still a crucial issue to solve: how to efficiently show 3D geospatial data in order to produce relevant visual communication? There are plenty of 3D visualization techniques (e.g., transparency, hue and shading), but they are not all compatible with each other, leading to potential graphical conflicts that may cause misunderstanding across stakeholders. Furthermore, their application is often specific to the type of data to be visualized, the task to be performed, and the context in which the task is to be executed (Métral et al., 2014). As a result, selecting appropriate 3D visualization techniques is quite complex, especially for non-experts who often deal with new combinations of criteria (data, task, and/or context).
2.3 Introduction
56
In this research project, we thus hypothesize that the formalization of graphic design principles is possible and corresponds to a valuable approach to support users in the visualization process of 3D geospatial data. This is why we propose to formalize (from a semiotics point of view) 3D geovisualization as a knowledge network by extracting its key components (from graphics and computer graphics fields) and establishing connections between camera settings, visualization techniques (expression plan), and targeted purposes (content plan). The goal is to build a knowledge network by gathering and connecting an ever-increasing number of visualization techniques from different application fields. This knowledge network could even automatically and intelligently be structured through machine learning (Brasebin et al., 2015): the more a visualization technique is used, the more it fits specific requirements, and subsequently the more it is helpful.
Following this, interactive design support tools could then be implemented to provide designers with feedback about the suitability of their representation choices. This seems necessary, since current CAD and GIS-oriented software does not warn against graphical conflicts that may appear during the visualization pipeline. The same applies to 3D geoinformation diffusion through the OGC web 3D services. While Neubauer and Zipf (Neubauer & Zipf, 2007) have already provided an extension to Symbology Encoding for the visualization of 3D scenes, this process remains unstructured. Additional elements should be incorporated to provide suitable graphic design guidelines.
Chapter 2 – 3D geovisualization formalization
57 This chapter is structured as follows. Sections 2.4 and 2.5 are dedicated to the 3D geovisualization field and aims to provide theoretical insights. They also deal with the visualization process of virtual 3D city models and the graphical conflicts issue. Section 2.6 presents a second-order logic formalism applied to the 3D geovisualization process and illustrates its role within the visual selectivity purpose for virtual 3D city models. In Section 2.7, the formalism is implemented in three different kinds of applications. Ultimately, we discuss the results, conclude, and address some research perspectives.
2.4 3D Geovisualization
2.4.1 Definition
Based on (MacEachren & Kraak, 2001) definition, 3D geovisualization is defined as the field that provides theory, methods, and tools for the visual exploration, analysis, confirmation, synthesis, and communication of spatial data. It incorporates approaches from a wide range of fields, such as scientific computing, cartography, image analysis, information visualization, exploratory data analysis, and geographic information systems.
The development of 3D geovisualization relies heavily on computer graphics, the technologies to design and manipulate digital images of 3D environment (Bleisch, 2012). Through this field, it is also possible to incorporate interaction (the ability for the user to move or to apply a
2.4 3D Geovisualization
58
Figure 8: Key components of 3D geovisualization
motion to objects) and to improve the immersion experience) with the use of head-mounted display or CAVE (Cave Automatic Virtual Environment) (Heim, 2000; Kraak, 2003; MacEachren et al., 1999). Besides, many application fields, such as education, geoscience, and human activity-travel patterns research showed their great usefulness in the visualization of 3D geospatial data (Billen et al., 2008; Kwan, 2000; Philips et al., 2015). Figure 8 is a simplified configuration of key components involved in 3D geovisualization and defines style as the application of graphic elements from graphics and computer graphics fields to features and the 3D environment. The next section explains these concepts in detail.
2.4.2 Graphics
To fulfil geospatial visualization challenges, theoretical and methodological approaches from graphics are used in 3D geovisualization (Andrienko et al., 2008; MacEachren & Kraak, 2001). Within the framework of graphics representation, components are visual (or retinal) variables sensed in accordance with group levels,
Chapter 2 – 3D geovisualization formalization
59 Table 1: State-of-the-art of static retinal variables defined over the last fifty years
Visual Variable Author (Date) Example
Arrangement Morisson (1974) Crispness MacEachren (1995) Grain Bertin (1967) Hue Bertin (1967) Lightness/Value Bertin (1967) Material Carpendale (2003) Orientation Bertin (1967) Pattern Carpendale (2003)
Perspective height Slocum et al. (2010)
Position Bertin (1967)
2.4 3D Geovisualization
60
Saturation Morisson (1974)
Shape Bertin (1967)
Size Bertin (1967)
Sketchiness Boukhelifa et al. (2012) Spacing Slocum et al. (2010)
Transparency MacEachren (1995)
equivalent to the four scales of measurement: nominal, ordinal, interval, and ratio (Stevens, 1946). Over the last fifty years, many authors, including (Bertin, 1967), (Morrison, 1974), (MacEachren, 1995), (Carpendale, 2003), (Slocum t al., 2010), and (Boukhelifa, et al., 2012), have supplied a wide range of static retinal variables (summarized in Table 1). Initially developed on 2D geometries (points, curves, surfaces), these static retinal variables can be easily extended to volumes and subsequently to the third dimension.
When using visual variables, users must keep in mind the suitability of these variables to perform specific visual tasks (one variable may perform
Chapter 2 – 3D geovisualization formalization
61 Table 2: Interpretation tasks of static retinal variables (Bertin, 1967)
well while another is less suitable). The suitability for graphics is in the interpretation tasks they are able to carry out. In Table 2, we present the perceptual properties classes as defined by (Bertin, 1967). Note that additional definitions exist in the literature, as do alternative criteria to measure the suitability of retinal variables (MacEachren, 1995).
Retinal variables have different degrees of consistency to achieve these visual tasks. This is why research has been conducted in 3D graphics. For instance, the following studies (Pouliot et al., 2014; Pouliot et al., 2014; Pouliot et al., 2013; Wang et al., 2012) show that colour is one of the most relevant variables for selectivity tasks in 3D cadastre visualization. This is
Interpretation Task
Signification Question
Selectivity The capacity to
extract categories
Does the retinal variable
variation identify
categories?
Associativity The capacity to
regroup similarities
Does the retinal variable
variation group
similarities?
Order perception The capacity to
compare several orders
Does the retinal variable variation identify a change in order?
Quantitative perception
The capacity to quantify a difference
Does the retinal variable variation quantify a difference?
2.4 3D Geovisualization
62
also the conclusion of (Rautenbach et al., 2015), who identify (in the specific context of urban planning) hue (and texture) as the most adapted visual variables for selectivity. Ultimately, retinal variables are also suitable for managing specific 3D geovisualization challenges: e.g., transparency for occlusion issues (Avery et al., 2009; Coors, 2003; Elmqvist et al., 2007; Elmqvist & Tsigas, 2007).
2.4.3 3D Environment Settings
While 3D geovisualization is partly based on graphics, it also incorporates additional settings from computer graphics that greatly influence the final display. (Haeberling, 2002) distinguishes the following rendering parameters:
Projection: parallel or perspective;
Camera: position, orientation, and focal length; Lighting: direct, ambient, or artificial light; Shading;
Shadow;
Atmospheric effect.
The previous list can be extended with viewport variations that change the projection (parallel or perspective) progressively or digressively in order to efficiently reduce occlusion issues in 3D geospatial environments. (Lorenz et al., 2008) show that it does not modify the dynamic aspect of virtual 3D city applications and (Jobst & Döllner, 2008) even conclude that it allows a better perception of 3D spatial relations.
Chapter 2 – 3D geovisualization formalization
63 2.4.4 Enhancement techniques
Besides static visual variables and 3D environment settings, additional techniques have been developed in order to improve the visualization of 3D geospatial environments. (Bazargan & Falquet, 2009) show the suitability of seven enhancement techniques (illustrative shadows, virtual PDA, croquet 3D windows, croquet 3D interactor, 2D medial layer, sidebar, and 3D labels) for the depiction of non-geometric information, while (Trapp et al., 2011) classify object-highlighting techniques useful for the visualization of user’s selection, query results, and navigation. The classification is carried out based on the type of rendering: style-variance techniques (focus-based style or context-based style), outlining techniques, and glyph-based techniques. They conclude that context-based style variance and outline techniques seem to be the most relevant techniques, since they highlight (to some extent) hidden objects in the scene.
2.5 Virtual 3D City Models
2.5.1 Definition and Benefits
Virtual 3D city models are defined as three-dimensional digital representations of urban environments (Hajji & Billen, 2016; Stadler & Kolbe, 2007). Their development and usage are linked to the drawbacks of photorealistic displays. Unlike 3D models, photorealistic depictions present (Döllner & Buchholz, 2005b):
2.5 Virtual 3D City Models
64
A higher cost for data acquisition due to the required higher quality of geometries and facade textures;
A more difficult integration of thematic information owing to the visual predominance of textured facades, roofs, and road systems in the image space;
A more complex visualization of multiple information layers on account of photorealistic details;
A more complex display on lower-specification devices (e.g., mobile phones, tablets) that generally require a simplification and aggregation process to be efficiently visualized (Ellul & Altenbuchner, 2014).
Virtual 3D city models mainly focus on common aboveground and underground urban objects and structures such as buildings (Figure 9), transportation, vegetation, and public utilities, of which they are able to store geometric, topologic, and semantic information with the development of common information models such as IFC, indoorGML and CityGML (Kim et al., 2014; Liu et al., 2017; Open Geospatial Consortium, 2006, 2018). For example, CityGML is organized in thematic classes and incorporates the “level of details” concept, both related to geometry, appearance, and semantics (Biljecki et al., 2016; Biljecki et al., 2014; Löwner et al., 2013).
Chapter 2 – 3D geovisualization formalization
65
Figure 9: Part of a virtual 3D LOD1 city model of New York (building
features) provided by the Technical University of Munich and visualized with ArcGlobe
This concept is used to describe a series of different representations of real-world objects, to meet the requirements of a wide range of application fields and to enhance the performance and quality of the visualization process (Biljecki, 2017; Gröger & Plümer, 2012; Luebke et al., 2012). However, within a typical 3D visualization process, objects’ appearance and geometry are one aspect; another is the graphical representation of their semantic information, and this is developed in the next section.
2.5.2 Semantic Driven Visualization
The development of CityGML as a standard for the representation and exchange of semantic 3D city models extended their initial purpose of visualization to thematic queries, analytical tasks, and spatial data mining (Zhu et al., 2009). As a result, a semantic driven visualization emerged, aiming to relay semantic information, and ultimately to improve the
2.5 Virtual 3D City Models
66
global usability of virtual 3D city models (Benner et al., 2005). However, the magnitude and complexity of virtual 3D city models raise the question of how to expressively and efficiently produce such a visualization (Jobst et al., 2010). In a paper published in 2015, (Semmo et al., 2015) present a 3D semiotic model incorporating the studies of several researchers. They distinguish five processing stages in the visualization process:
1. The modelling of real-world phenomena, which can be carried out by different kinds of sensors: passive (photogrammetry), active (ground laser scanner, airborne LIDAR), or hybrid (imagery and laser range sensors, hybrid DSM, aerial image and 2D GIS) (Hu, You, & Neumann, 2003).
2. The filtering stage to produce a primary landscape model where only the required information for further processing is selected. 3. The mapping of the primary model to a cartographic model via
symbolisation (i.e., the application of static retinal variables (e.g., hue, size, transparency) to selected objects).
4. The rendering of the cartographic model; that is, the definition of 3D environment settings (e.g., projection, camera attributes, lighting, and atmospheric effects) and potentially the application of enhancement techniques.
5. The perceptional aspects of the 3D graphic representation, such as psychological and physiological cues. When used carefully, they facilitate the communication process (Buchroithner et al., 2000).