O R I G I N A L R E S E A R C H
Rural-urban disparities in the management and
health issues of chronic diseases in Quebec
(Canada) in the early 2000s
A Vanasse
1, J Courteau
2, AA Cohen
1, MG Orzanco
2, C Drouin
21Université de Sherbrooke, Sherbrooke, Quebec, Canada
2PRIMUS Group, Clinical Research Center (CHUS), Université de Sherbrooke,
Sherbrooke, Quebec, Canada
Submitted: 10 June 2010; Revised: 12 August 2010; Published: 27 October 2010
Vanasse A, Courteau J, Cohen AA, Orzanco MG, Drouin C
Rural-urban disparities in the management and health issues of chronic diseases in Quebec (Canada) in the early 2000s
Rural and Remote Health 10: 1548. (Online), 2010
Available from: http://www.rrh.org.au
A B S T R A C T
Introduction: The ‘Commission on the Future of Health Care in Canada’ recognized that people living in rural and remote areas of Canada are at a disadvantage in health status, access to care and health professionals, and it considers the fight against these problems as a national priority. Although some attention has been paid to the prevalence of chronic diseases, very few studies have studied specifically the management and health issues in populations with chronic diseases in relation to rurality. The objective of this study was to describe systematic gaps across rural and urban populations in incidence, mortality, morbidity, material and human resources utilization, and drug management for three important chronic diseases: atherosclerosis, osteoporosis and diabetes.
Methods: Three retrospective population-based cohort studies were used. Three study populations were selected: an atherosclerotic population including patients newly hospitalized for a myocardial infarction (MI), an osteoporotic population including the at risk population who have suffered from a fragility fracture (FF) and, finally, a diabetic population that includes only incident cases of diabetes patients. For each of the three chronic diseases, variables were selected and classified in six categories: incidence, mortality, morbidity, material resources utilization, physician consultation and drug treatment. The Statistical Area Classification (SAC) was used as the rurality definition and contains six categories including two urban areas − Census Metropolitan Areas (CMA), or metropolitan areas, and Census Agglomeration (CA), or small towns − and four rural areas: Strong, Moderate, Weak and No Metropolitan influenced zones (MIZ), depending on the proportion of the workforce that commutes to urban areas. Each disease-related variable was described using age- and sex-adjusted rates. For comparing rates between rurality
classes, the adjusted relative risks were calculated using the CMA as the reference group. The χ2 was used to test for the equality of risks.
Results: A common pattern was identified from this study: for all three studied diseases, the material resources utilization rates and the specialist (other than internist) consultation rates were almost always statistically lower in small towns and rural areas when compared with metropolitan areas. Mortality rates and drug utilization rates were very similar among regions, except for hormone replacement therapy in women where utilization rates were higher in small towns and rural areas compared with metropolitan areas. Among observations that were not common to all three chronic diseases, the first is that MI incidence was greater in small towns and in Weak MIZ compared with metropolitan areas, fragility fractures seem to be marginally more frequent in small towns but less frequent in rural areas compared with metropolitan areas, while an increased incidence rate of diabetes is observed in remote region and a smaller risk in moderate MIZ compared with metropolitan areas. For both atherosclerosis and diabetes, morbidity rates were always statistically higher in small towns and in rural areas. This was not the case for patients with osteoporotic fractures where similar morbidity rates across regions were observed, except in strong MI which show the lowest morbidity rate.
Conclusions: There was substantially lower utilization of specialized services in non-metropolitan areas for all three diseases (myocardial infarction, osteoporosis, and diabetes). However, this did not translate into consistent differences in mortality and morbidity outcomes. This suggests that the impact of differential care utilization is specific to each disease, with indications that some important services may be under-utilized in rural areas, while others may be over-utilized in urban areas without improvement in outcomes.
Key words: atherosclerosis, chronic disease, diabetes, fragility fracture, health outcomes, health care management, myocardial infarction, osteoporosis, rurality.
Introduction
An important goal [in population health] is to minimize the disparities across population subgroups so that certain groups are not at a systematic disadvantage with regard to their access to health services and achievement of optimal health1.
Approximately 30% of the population of Canada live in rural and remote areas which occupy approximately 95% of the territory2. The Quebec’s provincial government is also particularly preoccupied with rurality because its so-called geographical rural area is one of the largest in the world and contains approximately 20% of the Quebec population. Urban and rural health disparities in health care and outcomes of chronic diseases continue to be widely observed in many countries and settings3-14. Various factors may account for these geographic disparities. For example, it has
been shown that rural populations are socio-economically disadvantaged15-17 and it has been proven that socioeconomic status has an impact on health18,19. Accessibility to health care and services, which is a constant concern for rural populations, must also be considered when examining these health disparities20,21. Because the industrialized countries seek to guarantee their citizens equity in health and care, the health of those living in rural areas represents a major interest. The ‘Commission on the Future of Health Care in Canada’ recognized that people living in rural and remote areas of Canada are at a disadvantage in health status, access to care and health professionals, and it considers the fight against these problems to be a national priority22.
A 2006 Canadian report23 examined patterns of selected socio-demographic and economic characteristics, health status and health behaviors, focusing on the differences between rural and urban Canadians. This document was the first report ever produced at the pan-Canadian level that
provides a broad picture of the health of rural populations. While some health measures did not show any pronounced rural–urban differences, and some adverse health measures were found to be higher in urban areas, rural areas generally showed a health disadvantage for many health-related measures examined in the study. This report shows that, generally, rural residents of Canada are more likely to be in poorer socio-economic conditions, to have lower educational attainment, to exhibit less healthy behaviors and to have higher overall mortality rates than urban residents. In Quebec, a study published by the Institut national de la santé
publique in 200424
showed very similar results to the Canadian study regarding selected health indicators such as mortality and health-related behaviors.
Although some have studied the disparities in the management and health issues in populations with specific chronic diseases5-16,25-30, few studies have focused on a common pattern in the management of chronic disease in relation to rurality. This article examines the management and health issues of some major chronic diseases and their relationships with rural and urban populations of Quebec, Canada, in the early 2000s. More specifically, the objective was to describe systematic gaps between rural and urban populations in incidence, mortality, morbidity, material and human resources utilization, and drug management of specific chronic diseases.
Methods
Definition of rurality
In Canada there is no consensus on an operational definition to measure the concept of rurality. At the Canadian government level, Statistics Canada and the Rural Secretariat use six different definitions to distinguish rural from urban areas31. The majority of these definitions use census tract as the unit of analysis, and population size and density as criteria for categorization. Depending on the definition used, the size and composition of the Canadian rural population varies from 22% to 38%32. The Statistical Area
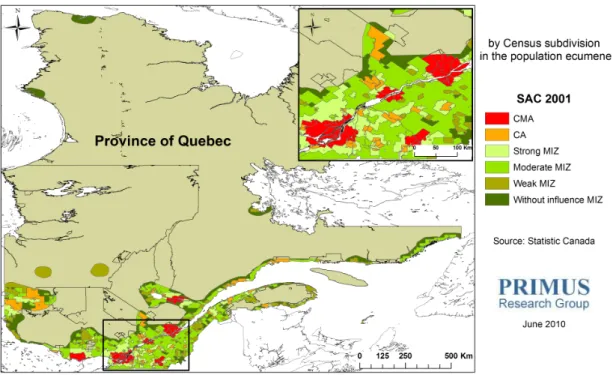
Classification (SAC) provides one of many definitions of rurality proposed by Statistics Canada33. It is the only definition that includes a functional criterion, namely, the commuter ratio. This ratio represents the percentage of a municipality’s residents who travel to work daily to an urban area. According to the SAC definition there are two categories of urban areas depending on the size of the urban core population: Census Metropolitan Areas (CMA) or metropolitan areas, with a population of at least 100 000, and Census Agglomerations (CA) or small towns, with a population between 10 000 and 99 99934. Metropolitan Influenced Zones (MIZ) or rural areas are assigned on the basis of the share of the workforce that commutes to any CMA or CA (Strong MIZ: between 30% and 50%; Moderate MIZ: between 5% and 30%; Weak MIZ more than 0% and less than 5%; No MIZ: no commuters)35. Details about SAC and the criteria employed for its development can be found on the Statistics Canada website (www.statcan.gc.ca). In this study, SAC definition based on 2001 census was used as shown (Fig1).
Design and data sources
This study used specific retrospective population-based cohort studies for three different chronic diseases. Patient data were obtained from the Quebec’s provincial hospital discharge register (MED-ECHO)36 and Quebec’s provincial demographic database which contains dates and causes of death. Physician visits and drug registers were obtained from the Régie de l’assurance maladie du Québec (RAMQ)37. The prescription claims database provides data on dispensed drugs (drug identification, date of dispensing, day of supply, cost and prescriber’s specialty) claimed by individuals within the public drug insurance plan, which covers more than 95% of all people aged 65 years and older, people on welfare and people not covered by a private drug insurance plan. Using a unique encrypted identifier, the patient files were linked to provide individual level information on demographic characteristics, medical and drug histories, as well as on their vital status. For characteristics of the rural– urban general population, the 2001 Canadian census data was used.
Figure 1: Rural–urban areas according to the statistical area classification definition. CA, census agglomerations; CMA, census metropolitan areas; MIZ, metropolitan influenced zones.
Study populations
In this study, atherosclerosis, osteoporosis and diabetes were chosen as representative of chronic diseases because these diseases have high prevalence, represent important morbid conditions, and guidelines have been published to treat them and to prevent complications. Exhaustive cohorts in the early 2000s were selected for each disease using the following selection criteria
• patients newly hospitalized for a myocardial infarction (MI)
• patients who had suffered a fragility fracture (FF) • incident cases of diabetic (DB) patients.
The study period varied between the cohorts in order to have a sufficient follow-up time (one or 2 years depending on the disease) and to have a fairly large number of cases.
Myocardial infarction: The study population included patients 25 years and older, living in the province of Quebec, hospitalized for a MI (code 410 of the International Disease Classification, 9th revision; IDC-9) between January 2000 and December 2003. The date of the first hospitalization during the study period was defined as the index date. In order to include only new cases, all patients who had a previous hospitalization for MI during the year preceding the index date were excluded. Patients for whom place of residence data were missing were also excluded. This cohort was followed for one year.
Fragility fractures: The studied population consisted of all individuals 40 years or older hospitalized for a fracture at a site of FF or for whom a physician claimed a medical service for an FF between January 2000 and December 2002. The following fractures were considered potential osteoporotic fractures or FFs: vertebral (ICD-9 code 805), pelvis (ICD-9 code 808), proximal humerus 9 code 812), wrist (ICD-9 code 814) or hip (ICD-(ICD-9 code 820-821). The date of the first consultation for one of the above-mentioned fractures was defined as the index date. In order to include new cases only, all patients who had a previous consultation for FF during the 1 year period preceding the index date were excluded. In order to enhance the specificity of the diagnosis of FF with the use of medico-administrative database, those who had a motor vehicle accident or a work-related accident in the week preceding the index date were also excluded because those fractures were less likely to be osteoporosis-related38. Patients for whom data on place of residence were missing were also excluded. This cohort was followed for a 2 year period.
Diabetes: The study population included all diabetic patients 20 years and older, living in the province of Quebec, between January 2001 and December 2002. Based on Blanchard et al39, a record in administrative data was considered to be a diabetes case if the individual was hospitalized with a diagnosis of diabetes (code 250 IDC-9) with either one of the 16 diabetes-related diagnostic codes (MED-ECHO register) or had at least two physician claims within 2 years with the diagnostic code of diabetes (ICD-9 code 250) (physician visits register). This algorithm has been validated and is widely used in Canada40 and in particular by the National Diabetes Surveillance System (NDSS) of Canada. The date of the first consultation for diabetes within the study period was defined as the index date. Only newly diagnosed patients with diabetes (incident cases) were included by excluding patients that received one diagnosis of diabetes within 5 years before the index date41. Patients with missing place of residence data were removed from the cohort. This cohort was also followed for a 2 year period.
Study variables
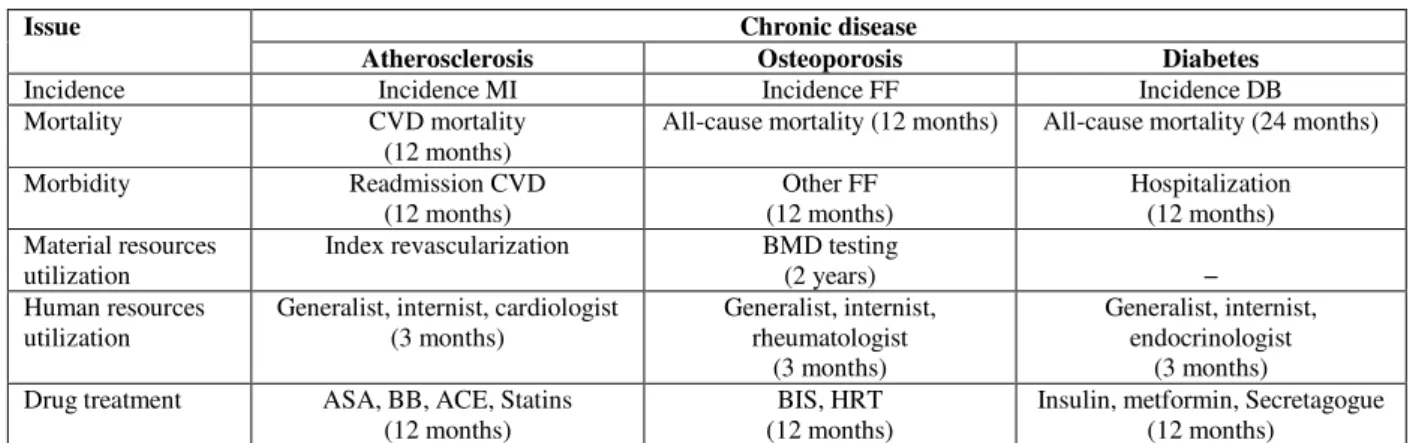
A list of issues for each of the three chronic diseases was selected. These issues were classified in seven categories (Table 1): incidence, mortality, morbidity, material and human resources utilization, and drug treatment.
Incidence: The incidence of MI was estimated by ratio between the total number of patients with a hospitalization for MI during the study period (2000-2003) and the total population 25 years and older in the province of Quebec in 2001. The incidence of FF was estimated by ratio between the total number of patients with a consultation for a new FF during the study period (2000-2002) and the total population 40 years and older in the province of Quebec in 2001. The incidence of diabetes was estimated by ratio between the total number of newly diagnosed diabetes cases (according to the definition used by the NDSS) during the study period (2000-2001) and the total population 20 years and older in the province of Quebec in 2001.
Mortality: The cardiovascular disease (CVD) mortality rate at one year for MI patients was calculated by the proportion of patients who died from a CVD cause (ICD-9 410-414; 426-429) within one year after the index date. The all-cause mortality rate at one year for patients with FF was calculated by the proportion who died within one year after the index date. Because the death rate at one year for diabetic patients was very small, an all-cause mortality rate at 2 years for diabetic patients was calculated.
Morbidity: For the atherosclerotic population, morbidity was measure by the proportion of MI patients that were hospitalized for a CVD (ICD-9 410-414; 426-429) within one year after the index hospitalization among those discharged alive. For the osteoporotic population, morbidity was measured by the proportion of patients with an FF at another site within one year after the index date. Finally, for the diabetic population, morbidity was measured as the proportion of newly diagnosed diabetic patients who were hospitalized (for any cause) within 2 years of the index date.
Table 1: List of selected issues for each chronic disease
Chronic disease Issue
Atherosclerosis Osteoporosis Diabetes
Incidence Incidence MI Incidence FF Incidence DB
Mortality CVD mortality
(12 months)
All-cause mortality (12 months) All-cause mortality (24 months)
Morbidity Readmission CVD (12 months) Other FF (12 months) Hospitalization (12 months) Material resources utilization
Index revascularization BMD testing
(2 years) −
Human resources utilization
Generalist, internist, cardiologist (3 months) Generalist, internist, rheumatologist (3 months) Generalist, internist, endocrinologist (3 months) Drug treatment ASA, BB, ACE, Statins
(12 months)
BIS, HRT (12 months)
Insulin, metformin, Secretagogue (12 months)
ACE, ACE-inhibitor; ASA, aspirin; BB, beta-blockers; BIS, bisphosphonate; CVD, cardiovascular disease; HRT, hormonal replacement therapy.
Material resources utilization: Among MI patients who survived index hospitalization, the proportion of those who received either a percutaneous transluminal coronary angioplasty or a coronary artery bypass graft at index hospitalization was calculated. For those who suffer from an FF, a bone mineral density (BMD) test can be performed as a diagnostic test for osteoporosis. If there was a medical service with a dual-energy X-ray absorptiometry procedure within 2 years after the index date, the patient was considered to have undergone a BMD testing. Diabetic patients are recommended to undergo dilated eye examination; however, it was not possible to recover valid information about this procedure because it can be performed at the optometrist’s office, which is not covered by the provincial data bases.
Human resources utilization: For each disease, the proportion of patients who had seen a generalist within 3 months after the index date were calculated. The proportion who consulted an internist or another specialist (cardiologist, rheumatologist or endocrinologist) in the same period was also calculated.
Drug treatment: For this category of variables, only patients covered by the public insurance plan were included in the calculations, representing more than two-third of the
present study populations. Post-MI treatments considered were the use of aspirin (ASA), beta-blockers (BB), ACE inhibitors or statins. Patients were considered to be under a specific treatment if there was at least one pharmacy claim of the selected drugs one year after the index date. Individuals were considered to have received osteoporosis related treatment if there was at least one pharmacy claim for a bisphosphonate (BIS) or at least one pharmacy claim for an ovarian hormonal replacement therapy (HRT; for women) within one year after the index date. For diabetic patients, insulin, metformin and secretagogue drug use were considered one year after the index date.
Analyses
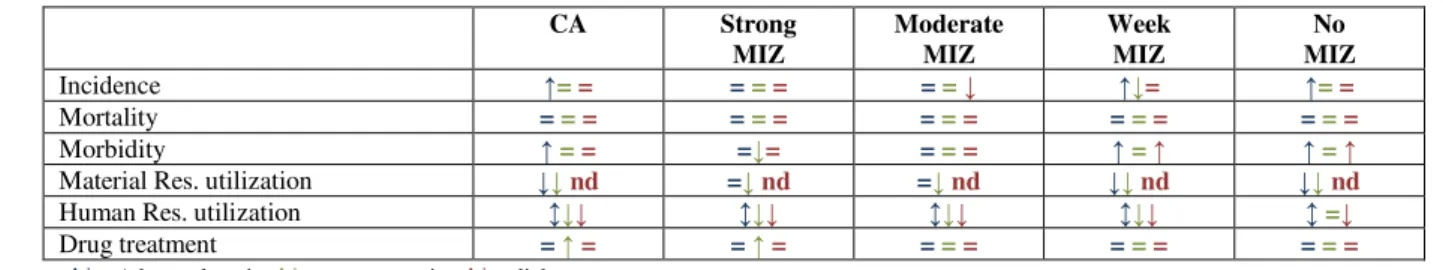
All rates were adjusted for age and sex. For comparing adjusted rates among categories of rural–urban areas, the relative risks (RR) were calculated on adjusted rates using the metropolitan areas (CMA) as the reference group. The χ2 test was used to test for the difference of risk between a specific group and the reference group. Because of large sample sizes, the statistical level of significance was set to 0.01. A summary table (Table 2) was made in order to compare results across the three chosen diseases. In this table, color-coded arrows indicate statistically significant (p <0.01) and clinically significant increase (arrow up) or
decrease (arrow down) in issues belonging to the categories (incidence, mortality, morbidity, material resources utilization, general and specialist consultations and drug treatments). Clinically significant increase or decrease means at least a 20% difference in the risk compared with the reference group (RR or 1/RR ≥1.2). This threshold of 1.2 in the relative risk was proposed by Hopkins42 and was based on a scale proposed by Cohen43 for different measures of effect size.
Ethical considerations
This study was approved by the University Hospital Ethics Board and the Commission d’accès à l’information du
Québec.
Results
Table 3 presents the characteristics for the general population of Quebec according to place of living (rural or urban). Almost 66% of the Quebec population lives in a metropolitan area (CMA) and 12% in a small town (CA). The ratio of women to men is higher in urban areas (CMA and CA) when compared with the other regions (MIZ). Small towns and moderate MIZ have the highest rate of elderly people. A clear urban to rural gradient is notable in median income, unemployment rate and in the rate of people without secondary school diploma. However, the reverse is true regarding social conditions such as the rate of people living alone.
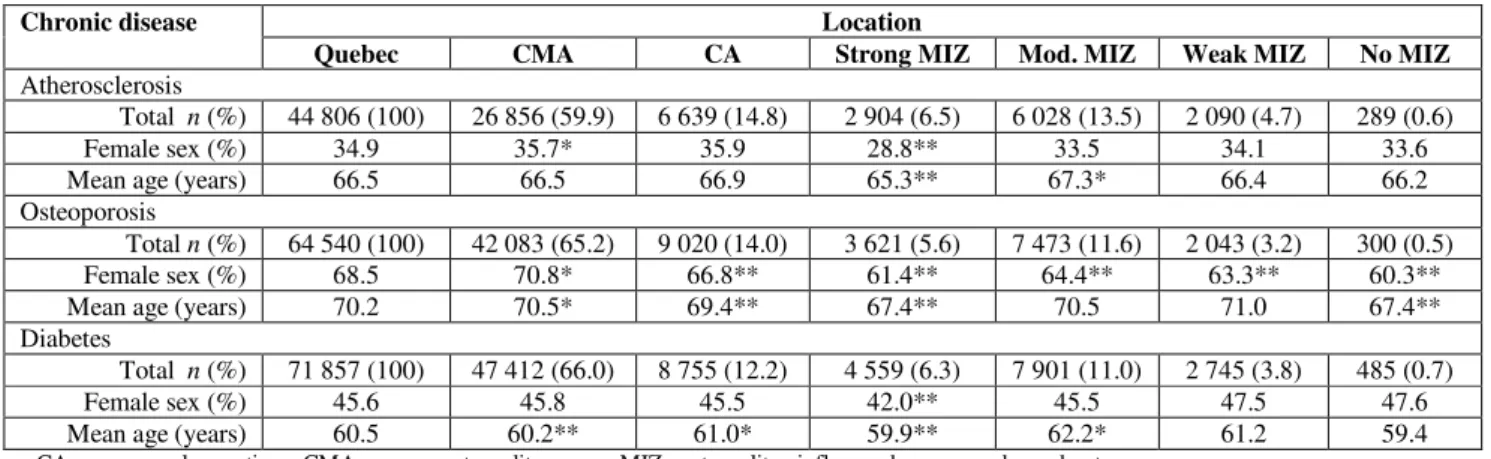
The atherosclerotic cohort included a total of 44 806 patients with a MI between 2000 and 2003. Generally, more than one-third of patients with MI were women and the mean age was 66.5 years. The sex and age distribution differs between rural and urban areas, the proportion of women and the mean age being the lowest in strong MIZ (Table 4). The cohort of patients with FFs included a total of 64 540 individuals between 2000 and 2002. As opposed to atherosclerosis, women are generally more prone to suffer from a fragility fracture than men. The sex and age distribution seems also to
differ between rural and urban areas, the proportion of women and the mean age being once again nearly the lowest in strong MIZ and No MIZ areas (Table 4). A total of 71 857 patients were newly diagnosed with diabetes between 2001 and 2002. Men were slightly more frequently diagnosed than woman and were younger at diagnosis, particularly in strong MIZ (Table 4).
Incidence
No rural–urban common pattern in the incidence rates emerges across the three chronic diseases (Tables 2,5). The first observation is that the MI incidence was the greatest in small towns (CA) and in Weak MIZ compared with metropolitan areas (CMA). Fragility fractures seem to be slightly more frequent in small towns but less frequent in more rural areas compared with metropolitan areas. There is no clear trend in the incidence of diabetes among rural– urban regions. However, a clinically and statistically significantly smaller risk of diabetes was observed in moderate MIZ (Table 2).
Mortality
No difference between rural and urban areas in the mortality rates is observed across all three chronic diseases (Tables 2,5). The age and sex adjusted mortality rates did not differ significantly between urban and rural areas for all selected chronic diseases (Table 5).
Morbidity
No clear, common rural–urban pattern in the morbidity rates was observed across the three chronic diseases (Tables 2,5). For atherosclerosis and diabetes, the adjusted rates of morbidity were significantly higher in non-metropolitan areas than in metropolitan areas with the highest rates found in remote regions (weak and no MIZ). For osteoporosis, the morbidity rate was significantly lower in the strong MIZ area only (Table 5).
Table 2: Summary table of statistically and clinically significant adjusted relative risks for the three selected chronic diseases: atherosclerosis (n=44 806), osteoporosis (n=64 540), and diabetes (n=71 857)
CA Strong MIZ Moderate MIZ Week MIZ No MIZ Incidence ↑= = = = = = = ↓ ↑↓= ↑= = Mortality = = = = = = = = = = = = = = = Morbidity ↑ == =↓= = = = ↑= ↑ ↑= ↑
Material Res. utilization ↓↓ nd =↓ nd =↓ nd ↓↓ nd ↓↓ nd
Human Res. utilization ↕↓↓ ↕↓↓ ↕↓↓ ↕↓↓ ↕ =↓
Drug treatment = ↑ = = ↑ = = = = = = = = = =
↑↓=Atherosclerosis;↑↓=osteoporosis ;↑↓= diabetes.
CA, Small town; MIZ, metropolitan influenced zones; nd, no data; Res., resources.
The table summarizes the results of Tables 4 to 9. It indicates the adjusted relative risk direction when compared to the reference group CMA. An arrow up means a greater, statistically (P < 0.01) and clinically significant risk (RR ≥ 1.2) whereas an arrow down means a lower, statistically (P < 0.01) and clinically significant risk (1/RR ≥ 1.2 or RR ≤ 0.83) risk as compared with the risk in a census metropolitan areas. An arrow in both directions indicates that one representative has a significantly higher RR and one has a significantly lower RR. Similar relative risks (statistically or clinically non significant) are represented by the equality symbol =.
Table 3: Description of the rural–urban population44
Location Variable
Quebec CMA CA Strong MIZ Mod. MIZ Weak MIZ No MIZ
Population n (%) 7 237 270 4 812 885 (66.5) 868 495 (12.0) 439 820 (6.1) 790 005 (10.9) 279 405 (3.9) 46 660 (0.6) Female sex % 51.2 51.8 51.4 49.0 49.9 50.0 49.0 ≥ 65 years % 13.3 12.8 14.3 12.1 15.4 13.6 11.5 Median income ($) Male 27 519 28 610 27 052 26 116 23 616 24 869 22 081 Female 16 800 17 966 15 128 14 799 13 636 13 577 14 282 Unemployment rate† % 7.6 6.7 8.3 7.8 9.5 13.7 16.7 Without secondary school diploma§ % 29.9 25.7 33.8 36.5 42.3 43.2 50.0
People living alone % 12.4 13.1 13.0 9.0 10.8 9.8 8.6
CA, census agglomerations; CMA, census metropolitan areas; MIZ, metropolitan influenced zones; mod., moderate. † ≥25 years; § ≥20 years.
Material resources utilization
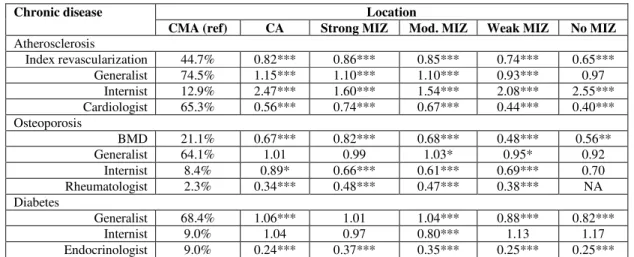
A common pattern emerged across the three chronic diseases (Tables 2,6) regarding material resources utilization. Index revascularization rates were lower in all non-metropolitan areas regions as opposed to metropolitan areas (Table 2) but surprisingly the index revascularization rate was lower in small towns compared with some rural areas (strong and moderate MIZ). The most striking observation was the underutilization of an osteodensitometry (18.8% overall) with very low rates in non-metropolitan areas, resulting in possible under diagnosis of osteoporosis (Table 6).
Human resources utilization
A common pattern emerges across the three chronic diseases (Tables 2,6) regarding specialist human resources utilization. There was no clear trend in the generalist consultation rate across rural and urban areas (Table 6). However, specialists other than internist were dramatically less consulted in non-metropolitan areas as opposed to non-metropolitan areas. However, MI patients living outside metropolitan areas were more likely to be consulting internists (this trend was not observed for the other two chronic diseases).
Table 4: Description of each cohort of chronic disease patients according to their rural or urban place of living
Location Chronic disease
Quebec CMA CA Strong MIZ Mod. MIZ Weak MIZ No MIZ
Atherosclerosis
Total n (%) 44 806 (100) 26 856 (59.9) 6 639 (14.8) 2 904 (6.5) 6 028 (13.5) 2 090 (4.7) 289 (0.6)
Female sex (%) 34.9 35.7* 35.9 28.8** 33.5 34.1 33.6
Mean age (years) 66.5 66.5 66.9 65.3** 67.3* 66.4 66.2
Osteoporosis
Total n (%) 64 540 (100) 42 083 (65.2) 9 020 (14.0) 3 621 (5.6) 7 473 (11.6) 2 043 (3.2) 300 (0.5)
Female sex (%) 68.5 70.8* 66.8** 61.4** 64.4** 63.3** 60.3**
Mean age (years) 70.2 70.5* 69.4** 67.4** 70.5 71.0 67.4**
Diabetes
Total n (%) 71 857 (100) 47 412 (66.0) 8 755 (12.2) 4 559 (6.3) 7 901 (11.0) 2 745 (3.8) 485 (0.7)
Female sex (%) 45.6 45.8 45.5 42.0** 45.5 47.5 47.6
Mean age (years) 60.5 60.2** 61.0* 59.9** 62.2* 61.2 59.4
CA, census agglomerations; CMA, census metropolitan areas; MIZ, metropolitan influenced zones; mod., moderate. *Significantly higher (p < .01) than Quebec; **significantly lower (p < .01) than Quebec
Table 5: Age and sex adjusted relative (to CMA) risks of incidence, mortality and morbidity of chronic diseases according to rural or urban place of living
Location Chronic disease
CMA (ref) CA Strong MIZ Mod. MIZ Weak MIZ No MIZ
Atherosclerosis Incidence MI 0.84% 1.24*** 1.15*** 1.16*** 1.24*** 1.21* CVD mortality 12.3% 1.02 0.91 0.92* 0.89 0.78 Readmission CVD 23.3% 1.21*** 1.15*** 1.16*** 1.32*** 1.39** Osteoporosis Incidence FF 1.87% 1.08*** 1.03 0.95*** 0.80*** 0.86* All-cause mortality 12.9% 0.98 1.02 0.99 0.90 0.94 Other FF 10.3% 0.92 0.82** 0.92 0.95 1.08 Diabetes Incidence DB 1.34% 0.95*** 1.02 0.90*** 0.95 1.15* All-cause mortality 6.0% 0.95 1.09 0.94 1.00 0.93 Hospital admission 23.7% 1.10*** 1.14*** 1.10*** 1.29*** 1.30** CA, census agglomerations; CMA, census metropolitan areas; CVD, cardiovascular disease; DB, diabetes; FF, fragility fracture; MI, myocardial infarction; MIZ, metropolitan influenced zones; mod., moderate.
*P < 0.01; **P < 0.001; ***P < 0.0001
Treatment
No difference between rural and urban areas in most drug utilization rates was observed across all three chronic diseases (Tables 2,7). Cardio-protective drug treatment rates and diabetes-related drugs were very similar between rural and urban regions, likewise for osteoporosis-related drug bisphosphonates. Hormone replacement therapy, however, was more privileged outside metropolitan areas (Table 7).
In summary, many similarities in results exist across the three chronic diseases when they are compared with metropolitan areas (CMA). The material resources utilization rates and the non-internist specialist consultation rates were lower, while the morbidity rates were higher or similar outside metropolitan areas compared with metropolitan areas (CMA). However, mortality rates and drug utilization rates were very similar among regions, except for HRT rates.
Table 6: Age and sex adjusted rates relative (to CMA) risks of human and material resources utilization according to chronic disease and rural–urban place of living
Location Chronic disease
CMA (ref) CA Strong MIZ Mod. MIZ Weak MIZ No MIZ
Atherosclerosis Index revascularization 44.7% 0.82*** 0.86*** 0.85*** 0.74*** 0.65*** Generalist 74.5% 1.15*** 1.10*** 1.10*** 0.93*** 0.97 Internist 12.9% 2.47*** 1.60*** 1.54*** 2.08*** 2.55*** Cardiologist 65.3% 0.56*** 0.74*** 0.67*** 0.44*** 0.40*** Osteoporosis BMD 21.1% 0.67*** 0.82*** 0.68*** 0.48*** 0.56** Generalist 64.1% 1.01 0.99 1.03* 0.95* 0.92 Internist 8.4% 0.89* 0.66*** 0.61*** 0.69*** 0.70 Rheumatologist 2.3% 0.34*** 0.48*** 0.47*** 0.38*** NA Diabetes Generalist 68.4% 1.06*** 1.01 1.04*** 0.88*** 0.82*** Internist 9.0% 1.04 0.97 0.80*** 1.13 1.17 Endocrinologist 9.0% 0.24*** 0.37*** 0.35*** 0.25*** 0.25*** CA, census agglomerations; BMD, bone mineral density; CMA, census metropolitan areas; MIZ, metropolitan influenced zones; mod., moderate; NA, unavailable due to very small numbers.
*P < 0.01; **P < 0.001; ***P < 0.0001
Table 7: Age and sex adjusted relative (to CMA) risks of disease-related drug treatment according to chronic disease and rural or urban place of living
Location Chronic disease
CMA (ref) CA Strong MIZ Mod. MIZ Weak MIZ No MIZ
Atherosclerosis Aspirin 86.3% 1.01 1.03** 1.03** 0.98 0.97 Beta-blockers 81.2% 0.98 1.02 1.00 0.95* 0.97 ACE inhibitors 74.7% 1.00 1.02 1.05*** 1.03 1.04 Statins 72.1% 0.99 1.02 1.03 1.02 1.03 Osteoporosis Bisphosphonates 23.4% 1.04 1.05 1.00 1.02 0.91 HRT 10.8% 1.29*** 1.22* 1.14* 1.22 1.18 Diabetes Insulin 3.3% 0.81 0.88 0.97 0.99 0.97 Metformin 40.2% 1.01 1.04 1.04 1.03 0.99 Secretagogue 23.8% 0.93* 0.95 0.92* 0.98 0.87
CA, census agglomerations; CMA, census metropolitan areas; HRT, hormonal replacement therapy; MIZ, metropolitan influenced zones; mod., moderate.
*P < 0.01; **P < 0.001; ***P < 0.0001
Discussion
The main objective of this study was to describe systematic gaps across rural and urban populations in incidence, mortality, morbidity, material and human resources utilization, and drug management for three specific chronic
diseases, namely atherosclerosis, osteoporosis and diabetes. A common pattern emerged: for all three diseases, the material resources utilization rates and the specialist (except internist) consultation rates were almost always lower and the morbidity rates higher in small towns and rural areas when compared with metropolitan areas. However, mortality
rates and drug utilization rates were very similar among regions, except for HRT in women, where utilization rates were higher in small towns and rural areas compared with metropolitan areas.
The MI incidence was greater in small towns and in Weak MIZ compared with metropolitan areas. This is consistent with other studies45,46, but not with some results of Martinez et al24 who found that mortality rate from ischemic cardiopathy in urban areas (including small towns) was higher than in rural areas. However, they also showed a higher prevalence self-reported heart disease in rural areas. Although hospital readmission rate for CVD was significantly higher in all non-metropolitan areas and index revascularization and specialist consultation rates significantly lower in all these regions, the mortality rate 12 months after MI did not differ significantly between rural and urban areas. It is not surprising that the index revascularization rate was higher in metropolitan areas considering that this procedure is available only in specialized cardiology centers which are all located in metropolitan areas. Previous results show that although invasive procedures reduce morbidity (non-fatal outcomes) and enhance quality of life47-49, their availability at the admitting hospital has no effect on post-infarction survival50,51. The results of the present study are consistent with these findings because the survival rate of individuals living in metropolitan areas is not better than those living in non-metropolitan areas.
Fragility fractures seem to be slightly more frequent in small towns but less frequent in rural areas when compared with metropolitan areas. A lower incidence of FFs in rural areas has been reported in other studies52,53. A striking observation is the underutilization of an osteodensitometry (18.8% in Quebec), with even lower rates outside metropolitan areas, resulting potential under-diagnosis of osteoporosis. Once again, internist and other specialist consultation rates were lower in rural areas, but generalist consultation rates and bisphosphonates drug utilization remained essentially the same among regions. These results are partly consistent with
another study on osteoporotic fractures conducted in Ontario which revealed that women, but not men, in an urban area were more likely to be taking a bone-sparing agent compared with those living in a rural area54. They also revealed that estrogen was more privileged in non-metropolitan areas, which is consistent with the present study results.
There was no clear trend in the incidence of diabetes among rural and urban regions. However, an increased risk was observed in remote regions and a smaller risk in moderate MIZ compared with metropolitan areas. It is well known that Aboriginal people are at greater risk of diabetes compared with the general population of Canada55, explaining the increased risk observed in remote Quebec (No MIZ). Endocrinologists were dramatically less consulted but there were more hospitalizations outside metropolitan areas. Once again, mortality and diabetes-related drug use were comparable among regions. Similarly to the present study, no rural–urban difference in adjusted mortality rates was observed in a study conducted in another province of Canada (Saskatchewan)56.
This study found systematically less material resource utilization and less specialist consultations but generally more morbidities in some rural areas compared with metropolitan areas. These findings together with other studies23,24 reporting higher proportions of smokers, lower consumption of fruit and vegetables and higher proportion of individuals who are overweight among rural residents, suggest that there may be potential in rural-friendly approaches in disease prevention and health promotion. Another important observation is that small towns (CA), often included as urban areas, differ from the other regions regarding health issues and healthcare management. In fact, small towns and moderate MIZ are more alike in terms of material and human resources utilization and also in terms of morbidity, while strong MIZ, which are peripheral to urban-suburban areas, seem to have better access to material and human resources than patients living in small towns. This motivates the separation of small towns (CA) from metropolitan areas (CMA) from the definition of ‘urban
areas’. The particularity of strong MIZ has been also noted in another study57. The population living in these regions are distinct from the others as they show a greater proportion of risk factors such as tobacco use, physical inactivity and obesity, with increased negative perceptions regarding their social life and their health status.
The major strength of this study is its naturalistic approach as it includes the entire province of Quebec, which is interesting from a public health perspective since it provides province-based knowledge, incorporating geographical variables in the studies of an important health problem. In the long term this may contribute to improving prevention and intervention programs. The importance of disease prevention and health promotion is well recognized in public health and clinical settings.
The present study has some limitations because it was based on medico-administrative databases that are not usually validated for epidemiological research. However, the validity of the administrative hospital discharge data regarding other chronic diseases such as MI has previously been published58,59. The accuracy of the prescription claims database in Quebec was also confirmed by previous studies60. However, because the prescription claims database covers people 65 years and older, those on welfare and all people not covered by a private insurance plan, some results may not be generalizable to all populations. A potential information bias can arise in diagnosis reporting because medical visits at the local community health center are not always registered in the databases.
Conclusions
It was found that for all three chronic diseases – myocardial infarction, osteoporosis, and diabetes – there was substantially lower utilization of specialized services in non-metropolitan areas. However, this did not translate into consistent differences in mortality and morbidity outcomes. This suggests that the impact of differential care utilization is specific to each disease, with indications that some important
services may be under-utilized in rural areas, but others may be over-utilized in urban areas without improvement in outcomes. Accordingly, how differences in utilization of specialized medical care affect outcomes in relation to rural or urban residence in Quebec need to be examine in more details using disease specific studies.
Acknowledgements
This study was supported by the Fonds de Recherche en
Santé du Québec, the Department of Family Medicine, Université de Sherbrooke and the Clinical Research Center,
Sherbrooke University Hospital.
References
1. Starfield B. Primary care: balancing health needs, services, and
technology. New York: Oxford University Press, 1998.
2. Ministerial Advisory Council on Rural Health. Rural Health in
Rural Hands: Strategic Directions for Rural, Remote, Northern and Aboriginal Communities. Ottawa, ON: Health Canada, 2002.
3. Wilkins R. Health of the rural population: selected indicators. In: RD Bollman (Ed.), Rural and small town Canada. Toronto, ON: Thompson Educational, 1992.
4. Pampalon R. Health discrepancies in rural areas in Quebec.
Social Science and Medicine 1991; 33(4): 355-360.
5. Baldwin LM, Chan L, Andrilla CHA, Huff ED, Hart LG. Quality of care for myocardial infarction in rural and urban hospitals.
Journal of Rural Health 2010; 26(1): 51-57.
6. Ellerbeck EF, Bhimaraj A, Perpich D. Organization of care for acute myocardial infarction in rural and urban hospitals in Kansas.
7. Hassan A, Pearce NJ, Mathers J, Veugelers PJ, Hirsch JM, Cox JL. The effect of place of residence on access to invasive cardiac services following acute myocardial infarction. Canadian Journal
of Cardiology 2009; 25(4): 207-212.
8. Lim LLY, O'Connell RL, Heller RF. Differences in management of heart attack patients between metropolitan and regional hospitals in the Hunter Region of Australia. Australian and New Zealand
Journal of Public Health 1999; 23(1): 61-66.
9. Svensson L, Karlsson T, Nordlander R, Wahlin M, Zedigh C, Herlitz J. Safety and delay time in prehospital thrombolysis of acute myocardial infarction in urban and rural areas in sweden. American
Journal of Emergency Medicine 2003; 21(4): 263-270.
10. Sheikh K, Bullock C. Urban-rural differences in the quality of care for Medicare patients with acute myocardial infarction.
Archives of International Medicine 2001; 161(5): 737-743.
11. Papaioannou A, Giangregorio L, Kvern B, Boulos P. Ioannidis G, Adachi J. The osteoporosis care gap in Canada. BMC
Musculoskeletal Disorders 2004; 5(1): 11.
12. McLafferty S, Wang F. Rural reversal? Rural-urban disparities in late-stage cancer risk in Illinois. Cancer 2009; 115(12): 2755-2764.
13. Schram ME, Tedja AM, Spijker R, Bos JD, Williams HC, Spuls PI. Is there a rural/urban gradient in the prevalence of eczema? A systematic review. British Journal of Dermatology 2010; 162(5): 964-973.
14. Ntandou G, Delisle H, Agueh V, Fayomi B. Abdominal obesity explains the positive rural-urban gradient in the prevalence of the metabolic syndrome in Benin, West Africa. Nutrition Research 2009; 29(3): 180-109.
15. Gouvernement du Québec, Ministère de la Santé et des Services Sociaux. Programme National de Santé Publique 2003-2012. Quebec: Gouvernement du Québec, 2003.
16. Ricketts TC. Rural health in the United States. New York: Oxford University Press; 1999.
17. Hirsch S; updated Harriman J. Rural Information Center Health Services (RICHS). Rural health statistics. (Online) 1988, updated 2001. Available: http://www.nal.usda.gov/ric/ (Accessed 13 October 2010).
18. Liberatos P, Link B, Kelsey J. The measurement of social class in epidemiology. Epidemiologic Reviews 1988; 10: 87-121.
19. Gouvernement du Québec, Ministère de la santé et des services sociaux. Priorités nationales de santé publique 1997-2002. Quebec: Gouvernement du Québec, 1997.
20. ACC/AHA 1999 Guideline Update for the Management of Patients with Acute Myocardial Infarction. Circulation 1999; 100: 1016-1030.
21. Alter DA, Naylor CD, Austin PC, Benjamin TB, Vu JV. Geography and service supply do not explain socioeconomic gradients in angiography use after acute myocardial infarction.
Canadian Medical Association Journal 2003; 168(3): 261-264.
22. Santé Canada, Commission sur l'avenir des soins de santé au Canada. Guidé par nos valeurs. L'avenir des soins de santé au
Canada. Rapport final. Ottawa, ON: Santé Canada, 2002.
23. Canadian Institute for Health Information. How healthy are
rural Canadians? An assessment of their health status and health determinants. Ottawa, ON: CIHI, 2006.
24. Martinez J, Pampalon R, Hamel D, Raymond G. Vivre dans une
collectivité rurale plutôt qu’en ville fait-il vraiment une différence en matière de santé et de bien-être? Québec: Institut national de la
santé publique du Québec, 2004.
25. Dagenais P, Vanasse A, Courteau J, Orzanco MG, Asghari S. Disparities between rural and urban areas for osteoporosis management in the province of Quebec following the Canadian 2002 guidelines publication. Journal of Evaluation in Clinical
26. Silva GL, Dean CB, Niyonsenga T, Vanasse A. Hierarchical Bayesian spatiotemporal analysis of revascularization odds using smoothing splines. Statistics in Medicine 2007; 27(134): 2381-2401.
27. Loslier J, Vanasse A, Niyonsenga T, Courteau J, Orzanco G, Hemiari A. Myocardial infarction in rural and urban populations in the province of Quebec. Canadian journal of Rural Medicine 2007;
12(2): 95-102.
28. Vanasse A, Niyonsenga T, Courteau J, Hemiari A. Access to myocardial revascularization procedures: closing the gap with time?
BMC Public Health 2006; 6: 60.
29. Vanasse A, Niyonsenga T, Courteau J, Gregoire JP, Hemiari A, Loslier J, Bénié G. Spatial variation in the management and outcomes of acute coronary syndrome. BMC Cardiovascular
Disorders 2005; 5: 21.
30. Vanasse A, Dagenais P, Niyonsenga P, Gregoire JP, Courteau J, Hemiari A. Bone mineral density measurement and osteoporosis treatment after a FF in older adults: regional variation and determinants of use in Quebec. BMC Musculoskeletal Disorders 2005, 6: 33.
31. du Plessis V, Beshiri R, Bollman RD, Clemenson, H. Definitions of rural. Rural and Small Town Canada-Analysis
Bulletin 2001; 3(3). Ottawa, ON: Statistics Canada.
32. Statistics Canada. Cartographic boundary files, reference guide
(geography products: geographic reference products). Ottawa, ON:
Statistics Canada; 2002. Cat no 92F0171GIE.
33. Murphy P, Puderer H. Census metropolitan areas and census
agglomerations with census tracts, for the 2001 Census. Geography
working paper series no2002-1, cat no 92F0138MPE 2002001. Ottawa, ON: Statistics Canada; 2002.
34. Statistics Canada. Census Handbook 2001. Ottawa, ON: Statistics Canada, 2001.
35. McNiven C, Puderer H, Janes D. Census metropolitan area and
census agglomeration influenced zones (MIZ): a description of the methodology. Geography working paper series no2002-2. Ottawa,
ON: Statistics Canada, 2002.
36. Ministère de la santé et des services sociaux du Québec (MSSS). Cadre normatif Med-Écho. (Online) 0000. Available: http://msssa4.msss.gouv.qc.ca/fr/document/publication.nsf/ff52dbe c0b2ed788852566de004c8584/581d207c3ed564a7852574bf005283 de?OpenDocument (accessed 1 April 2008).
37. Régie de l’assurance maladie du Québec (RAMQ). Overview of
the databases owned and administered by the RAMQ. (Online)
0000. Available: http://www.ramq.gouv.qc.ca/en/statistiques/ banques/vuedensemble.shtml (Accessed 1 May 2010).
38. Bélanger A, Chiasson E, Godin S, Robidas F. Recherche sur le
potentiel de réduction des fractures de fragilisation chez les personnes de 50 ans et plus hospitalisés au CHUS. Sherbrooke:
Université de Sherbrooke, 2004.
39. Blanchard JF, S Ludwig, A Wajda, H Dean, K Anderson, O Kendall et al. Incidence and prevalence of diabetes in Manitoba, 1986-1991. American Diabetes Association 1996; 19(8): 807-811.
40. Hux JE, Ivis F, Flintoft V, Bica A. Diabetes in Ontario: determination of prevalence and incidence using a validated administrative data algorithm. Diabetes Care 2002; 25(3): 512-516.
41. Asghari S, Courteau J, Carpentier A, Vanasse A. Optimal strategy to identify incidence of diagnostic of diabetes using administrative data. BMC Medical Research Methodology 2009, 9: 62.
42. Hopkins WG. A scale of magnitudes for effect statistics. In: A
new view of statistics. (Online) 2003. Available: http://www.
sportsci.org/resource/stats/effectmag.html (Accessed 11 August 2010).
43. Cohen J. Statistical power analysis for the behavioral sciences, 2nd edn. New Youk: Lawrence Erlbaum, 1988.
44. Statistics Canada. 2001 Census of Population. (Onlinr) 2001. Available: http://www12.statcan.ca/english/census01/products/ standard/profiles/Profiles.cfm (Accessed 14 October 2010).
45. Naylor CD, Slaughter PM. Cardiovascular health and services
in Ontario, an ICES atlas produced by the Institute for Clinical Evaluative Sciences. Toronto, ON: Continental, 1999.
46. Taylor R, Chey T, Bauman A, Webster I. Socio-economic, migrant and geographic differentials in coronary heart disease occurrence in New South Wales. Australian and New Zealand
Journal of Public Health 1999; 23: 20-26.
47. Alter DA, Naylor CD, Austin PC, Tu JV. Long-term MI outcomes at hospitals with or without on-site revascularization. Journal of the
Americal Medical Association 2001; 285: 2101-2108.
48. Mark DB, Naylor CD, Hlatky MA, Califf RM, Topol EJ, Granger CB et al. Use of medical resources and quality of life after acute myocardial infarction in Canada and the United States. New
England Journal of Medicine 1994; 331: 1130-1135.
49. Rouleau JL, Moye LA, Pfeffer MA, Arnold JM, Bernstein V, Cuddy TE et al. A comparison of management patterns after acute myocardial infarction in Canada and United States. New England
Journal of Medicine 1993; 328: 779-84.
50. Gregory PM, Malka ES, Kostis JB, Wilson AC, Arora JK, Rhoads GG. Impact of geographic proximity to cardiac revascularisation services on service utilization. Medical Care 2000; 3: 45-57.
51. Marrugat J, Sanz G, Masiá R, Valle V, Molina L, Cardona M. Six-month outcomes in patients with myocardial infarction initially admitted to tertiary and nontertiary hospitals. Journal of the
American College of Cardiology 1997; 30: 1187-1192.
52. Melton LJ 3rd, Crowson CS, O'Fallon WM. Fracture incidence in Olmsted County, Minnesota: comparison of urban with rural rates and changes in urban rates over time. Osteoporosis
International 1999; 9(1): 29-37.
53. Sanders KM, Nicholson GC, Ugoni AM, Seeman E, Pasco JA, Kotowicz MA. Fracture rates lower in rural than urban communities: the Geelong Osteoporosis Study. Journal of
Epidemiology & Community Health 2002; 56: 466-470.
54. Cadarette SM, Jaglal SB, Hawker GA. Fracture prevalence and treatment with bone-sparing agents: are there urban-rural differences? A population based study in Ontario, Canada. Journal
of Rheumatology 2005: 32: 550-558.
55. Health Canada. Diabetes among Aboriginal people in Canada:
the evidence. Ottawa, ON: Health Canada, 2001; 10.
56. Pohar SL, Majumdar SR, Johnson JA. Health Care Costs and Mortality for Canadian Urban and Rural Patients with Diabetes: Population-Based Trends from 1993-2001. Clinical Therapeutics 2007; 29: 1316-1324.
57. Vanasse A, Courteau J, Orzanco MG. Maladies chroniques: évolution des déterminants de santé des populations rurales et urbaines au Québec. 10e Journées annuelles de santé publique; Montréal, QB: 2006.
58. Levy AR, Tamblyn RM, Fitchett D, McLeod PJ, Hanley JA. Coding accuracy of hospital discharge data for elderly survivors of myocardial infarction. Canadian Journal of Cardiology 1999;
15(11): 1277-1282.
59. Petersen LA, Wright S, Normand SL, Daley J. Positive predictive value of the diagnosis of acute myocardial infarction in an administrative database. Journal of General Internal Medicine 1999; 14(9): 555-558.
60. Tamblyn R, Lavoie G, Petrella L, Monette J. The use of prescription claims databases in pharmacoepidemiological research: the accuracy and comprehensiveness of the prescription claims database in Quebec. Journal of clinical epidemiology 1995; 48(8): 999-1009.