International Journal of Emerging Technology and Advanced Engineering
Website: www.ijetae.com (ISSN 2250-2459,ISO 9001:2008 Certified Journal, Volume 4, Issue 2, February 2014)
36
Adaptive Study of Thermal Comfort in Equatorial Zone: Case
of Some Buildings in Cameroon.
Modeste Kameni Nematchoua
1, Rene Tchinda
2, Wagner Augusto Andreasi
3, Noel Djongyang
4 1Environmental Energy Technologies Laboratory, University of Yaounde I, Cameroon 2LISIE, University Institute of Technology Fotso Victor, University of Dschang, Cameroon 3Laboratory of Analysis and Development of Buildings, Federal University of Mato Grosso do Sul, Brazil,
4
Department of Physics, Faculty of Science, University of Ngaoundere, Cameroon
Abstract-- Thermal comfort is an important parameter in buildings. It can significantly influence human health as well as his productivity. This paper presents the results of a field study conducted in the equatorial region of Cameroon. The adaptive approach coupled to the analytical approach was used to provide a holistic view of thermal comfort in buildings. A questionnaire, formulated according to the standards of ISO 7730 and ISO 10551 was used. Various values of environmental parameters were taken at the same time the occupants were filling the questionnaires. The study was conducted in 2011 during four seasons (long dry season, small rainy season, short dry season and long rainy season), more precisely in Yaounde city. The average comfort temperature obtained was 25.0°C while the thermo neutral temperature was 23.7 °C in modern habitat against 23.3°C in traditional ones. The preference temperature varied according to season and type of residence. In general, 77.5 % of voters found their habitat acceptable.
Keywords-- thermal comfort, equatorial climate, seasons, habitat, adaptive approach.
I. INTRODUCTION
The current standards of thermal comfort are based on laboratory studies conducted in rooms, ignoring the complex interaction between the occupants and their environment that may affect their comfort. Sensations and thermal preferences are relative and vary from one individual to another. Thermal comfort can be defined as the set of multiple interactions between the occupant and the building. It can be described with many physiological, physical, quantitative or qualitative, parameters, more or less uncertain and vague. Thermal neutrality results from a thermal equilibrium achieved by few (or none) physiological responses [1]. However, many studies showed that thermal neutrality does not necessarily correspond to thermal comfort.
The study of thermal comfort in buildings is useful not only to define conditions for a comfortable area, but also to give the architectural recommendations and to propose the best suitable materials to each type of region [2]. Two main approaches were used to study thermal comfort in buildings. One considered as rational, based on the work of Fanger in a mechanically controlled area and the other considered adaptive which the research topic of many recent works. Several researchers confirmed the reliability of this approach. The parameters of thermal sensation were established based on several scales including one of the most important which is that of ASHRAE, whose index expressing the thermal neutrality is defined as zero. Many studies showed the importance of thermal comfort in classrooms, buildings, traditional and modern habitats such as those made by Djongyang and Tchinda [3] in northern Cameroon which gave many parameters related to comfort. A. Kemajou and L. Mba [4] devoted themselves to obtain the thermal comfort in homes in hot zone by a judicious use of building materials. Hugo S.L.C. Hens [5], found after study for PMV = 0, the PPD greater than 5%. Cinzia B. and R. Paola [6], later on, obtained a linear correlation between Predicted Mean Vote (PMV) and the difference between the Equivalent Uniform Temperature and the Comfort Uniform Temperature (Teu-Tu) and polynomial between Predicted Percentage of unsatisfied (PPD) versus of the absolute value with the same difference between temperatures PPD and (Teu-Tul). The work of De Dear and Brager [7] on the natural ventilation and the work of Nicol and Humphrey [8] on the index of thermal sensation have significantly contributed to initiation of the adaptive approach. The association of this approach to the so-called rational, allowed us to study the thermal comfort in its entirety. We also found works on thermal comfort in America, Asia literature and many other countries in Europe [9-16] but very few in Africa, particularly in equatorial regions.
International Journal of Emerging Technology and Advanced Engineering
Website: www.ijetae.com (ISSN 2250-2459,ISO 9001:2008 Certified Journal, Volume 4, Issue 2, February 2014)
37 Many thermal insulation standards were established, completely ignoring that part of the globe. The purpose of this study which is the first of its kind in that locality is to study the thermal comfort during working hours in modern and traditional buildings in Cameroon (Yaounde) using the new adaptive approach associated little bit with the rational approach.
II. MATERIAL AND METHODS
2.1 Study area
The Yaounde city is built on several hills and enjoys a picturesque setting and a climate relatively "fresh". The maximum temperature range is between 30°C and 35°C sometimes, and the minimum is 15°C. Yaounde is the capital of the central region, the Cameroon political capital. This city is located approximately at 300km from the Atlantic coast and enjoys a temperate sub-equatorial climate with four seasons including a large dry season (mid November to late March), a short rainy season (April-mid June), a short dry season (mid June - mid August) and a long rainy season (mid August-mid November). Its altitude is between 600-800m. Geographically, it is located between 3°52' N latitude and 11°32' E longitude. It is built on 7 hills. Its population was about 2.5 million inhabitants in 2011. Since the early 90s, the population increased with a growth rate of 7% per year. Figure 1 below shows the location of the city of Yaounde in Sub-Saharan Africa.
Figure 1 - Location of the city studied.
2.2 Materials
In this study, the indoor air speed, indoor relative humidity, C02 concentration, indoor temperature were measured by an Thermo-anemometer (model C.A1226) which gave the maximum, the minimum and the average of air temperature and air speed values accuracies. We also used a C02 Monitor (model CO200) which gave simultaneously C02 rate, air temperature and relative humidity values with accuracy of ±(5%rdg+50ppm), ±0.6°C and ±3%(10 to 90%) respectively and a sonde thermometer. The various values of outdoor temperature, wind speed and relative humidity were collected from the national weather station. All these equipments were calibrated before use to ensure reliability and accuracy in readings during the field studies. The main characteristics of the measurements system used are reported in Table 1.
Table 1
Characteristics of the measurement system.
C02 Monitor (model CO200)
Function Range Resolution Accuracy
C02 0 to 9999ppm 1ppm ±(5%rdg+50ppm) Temperature -10 to 60°C 0.1° ±0.6°C 14 to 140°F 0.1° ±0.9°F Humidity 0.1to 99.9% 0.1% ±3 %(10 to 90%) ±5 %(< 10% or >90%) digital thermometer
Function Range Resolution Accuracy
Temperature -20°C to 0°C 1°C ±5.0% of rdg ±4 digits 0°C to 400°C 1°C ±1.0% of rdg ±3 digits 400°C to 1000°C 1°C ±2.0% of rdg C.A 1226 Thermo-anemometer
Function Range Resolution Accuracy Measurement units
Air velocity 0.15to 3m/s 0.01m/s ±3%R+0.1m/s m/s , fpm , km/h 3,1 to 30m/s 0.1m/s ± 1%R+0.2m/s
Temperature -20 to +80°C 0.1°C ± 0.3%R+0.25°C °C, °F Air flow 0 to 99999m3/h 1m3/h ±3%R ±0.03*surf. m3/h, m3/s, L/s,
duct(cm2) cfm
2.3 Research methodology
The study took place throughout the year during four seasons. Measurements of various parameters were in accordance with international standards, UNI EN ISO 7730:2006. [17], UNI EN ISO 10551:2002 [18], and the ASHRAE Standard 55:2004 [19] using the new adaptive approach.
International Journal of Emerging Technology and Advanced Engineering
Website: www.ijetae.com (ISSN 2250-2459,ISO 9001:2008 Certified Journal, Volume 4, Issue 2, February 2014)
38 In most cases, ventilation was controlled naturally. We used questionnaires to obtain quantitative data on the actual conditions in these habitats. To achieve this objective, two data collection methods were used including a questionnaire as subjective measurement, and a physical measurement of some parameters that influence the thermal comfort conditions in buildings. In each building or habitat, in accordance with previous research works, from 3 to 5 days per season, sampling processes were carried out in each different room or office. For multi storey buildings, the offices chosen were those that presented a greater number of occupants. The radial average temperature is estimated following the formula proposed by Nagano [20]: Tr = 0,99Ta - 0,01,at R2 = 0,99 (1)
The thermal resistance of clothing ( ) is determined
according to ISO 7730:2006 and the formula proposed by McIntyre [21]:
Icl,men= 0,13 + 0,727∑Iclu,i and Icl,women = 0,05 +
0,77∑Iclu,i. (2)
The operative temperature determined according to the relationship [19]:
To = A Ta + (1-A) Tr, (3) A = 0.5 for V < 0.2 m/s
A = 0.6 for 0.2 < V < 0.6 m/s A = 0.7 for 0.6 < V < 1 m/s
PMV and PPD determined by simulation following the relations established by Fanger [9]:
PMV=[0,303exp(-0,036M)+0.028].L = a.L (4)
PPD= 100-95exp [-(0.03353PMV4 +0,2179PMV2)] (5)
2.3.1. Field measurement of environmental parameters
Measurements were taken every 15 minutes at a height of 1.1 meters from the ground level in strict accordance with the prescriptions of the ASHRAE Standard 55 [19] and ISO 7730 Standard [17]. The devices were installed at 7:00 AM and measurements started at 8:00 AM, so that each unit could get adapt to the environment. Data were taken regularly until 7:00 PM. These measurements provided four of the six parameters established by Macpheson [22] such as air velocity, relative humidity, ambient temperature, and average radiant temperature. These parameters were then used to calculate the PMV and PPD index according to Fanger’s model.
In most of the cases, a thermal uniformity was difficult to be achieved in buildings or habitats. Hence, in this study, measurement of the environmental parameters was conducted at various occupied points by the occupants who would be completing the questionnaires. Table 2 shows some examples of buildings analyzed. This study took place in several streets of Yaounde (Cameroon) and precisely in 55 habitats including 30 modern habitats and 25 traditional habitats.
Table 2
Some main characteristics of the analyzed buildings.
Type of Building s Type of Construct ion Volu me [m3 ] Flo or area [m2] Heig ht [m] Window Expositi on Heatin g Termi nal Device Natural Ventilati on Modern bond-stone 180 5x 8 4.5 S-ES radiato rs x Traditio nal board 96 4 x 6 4.0 S-SW radiato rs x earth 52.5 3.5x 5 3.0 E-ES radiato rs x _____________________________________________________________________________________________
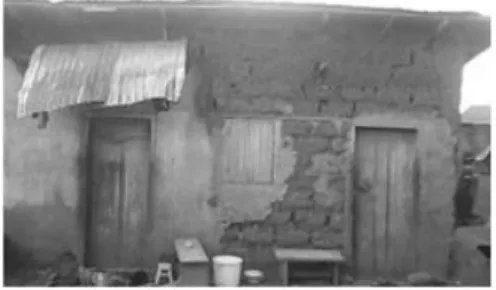
The traditional habitats were mostly with provisional and local materials (Wood, soil, brick etc.), while modern habitats were built with glasses, plasters, stones but also with clay brick. Few examples of modern and traditional habitats studied and the materials used are shown in Figures 2 and 3.
Figure 2 - Example of modern buildings studied.
International Journal of Emerging Technology and Advanced Engineering
Website: www.ijetae.com (ISSN 2250-2459,ISO 9001:2008 Certified Journal, Volume 4, Issue 2, February 2014)
39
2.3.2. Subjective measurements
During the study, questionnaires were distributed twice a day including in the morning, from 8 to 12am and in the afternoon, from 2 to 6pm (occupants paused from 12am to 2pm). About 920 copies were recovered representing just about 51% of individuals who accepted to answer the questionnaires and who were actually delivered the questionnaires. These questionnaires were written and developed in accordance with ISO 7730 [17] and ISO 10551 standards as explained before [18]. From these questionnaires, clothing and metabolic rate were assessed and at the same time, it was also possible to know the sex, age, weight, and height of each occupant. Finally, like in the previous research works, thanks to the questionnaires, it was also possible to find out the thermal sensation, thermal preference, and acceptance of the thermal control of air movement and humidity in the occupied areas. The exact number of questionnaires for each season is summarized in Table 3.
Table 3
Number of questionnaires as function of the analyzed season
______________________________________________________________
Study season months Number of
questionnaires
1 long dry season Mar-Nov 423 2 Small rainy
season
May 258
3 Short dry season July 100 4 large rainy season Sep-Oct. 139
________________________________________________________ III. RESULTS AND DISCUSSIONS
We decided on the number of town that participated in the study and it appeared that the participation rate was between (0.7% -6.2%) by district. On average, more than 74.6% of modern habitats were studied. Characteristics of occupants and personal thermal variables from questionnaires are reported in Tables 4 and 5. We observed in these tables that among the 920 voters, 531 are men and 389 women. Their height varied from 1.48m to 1.99m. Their activities varied from 1 to 1.2met with an average of 1met and a standard deviation of 0.07in traditional habitats and 0.05 in modern habitats. The duration of habitats varied from 0 to 51 years, with an average of 29.5years and a standard deviation of 1.56 in traditional habitats against 10.5 years and with a standard deviation of 2.23 in modern habitats.
Table 4
Synthesis of the average data.
______________________________________
City: Yaoundé
Type of residence Modern Traditional Both types Gender Male 415 116 531 Female 272 117 389 Age (year) Maximum 70 68 70 Minimum 11 18 11 Mean 25 28 26.5 Standard deviation 7.34 5.23 4.36 Height (m) Maximum 1.99 1.91 1.99 Minimum 1.58 1.48 1.48 Mean 1.63 1.70 1.66 Standard deviation 0.15 0.18 0.12 Weight (kg) Maximum 130 102 130 Minimum 40 46 40 Mean 77 66 69 Standard deviation 18.9 9.56 8.54 Metabolic rate (Met) Maximum 1.2 1.2 1.2 Minimum 1.0 1.0 1.0 Mean 1.0 1.0 1.0 Standard deviation 0.05 0.07 0.06 Clothing (Clo) Maximum 1.3 1.05 0.36 Minimum 0.36 0.55 0.86 Mean 0.97 0.76 0.18 Standard deviation 0.21 0.13 Years in the region Maximum 42.0 51.0 51.0 Minimum 0 21.0 0 Mean 10.4 29.5 18.4 Standard deviation 2.23 1.56 2.01 Type of construction In bond-stone 601 71 672 In board 5 13 18 In earth 81 149 230
International Journal of Emerging Technology and Advanced Engineering
Website: www.ijetae.com (ISSN 2250-2459,ISO 9001:2008 Certified Journal, Volume 4, Issue 2, February 2014)
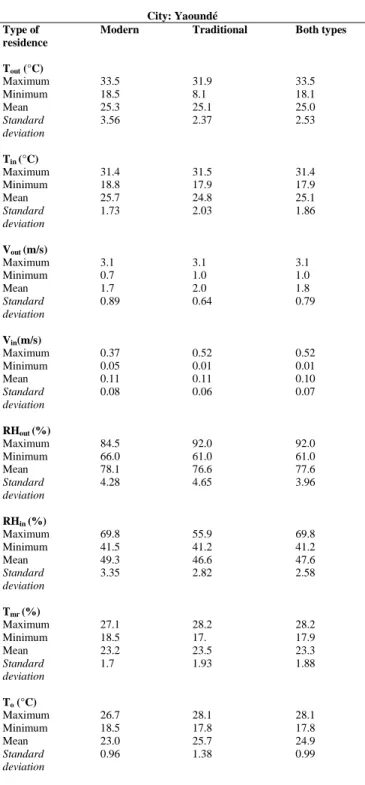
40 Table 5
Synthesis of measured data in City.
__________________________________________
City: Yaoundé Type of
residence
Modern Traditional Both types
Tout (°C) Maximum 33.5 31.9 33.5 Minimum 18.5 8.1 18.1 Mean 25.3 25.1 25.0 Standard deviation 3.56 2.37 2.53 Tin (°C) Maximum 31.4 31.5 31.4 Minimum 18.8 17.9 17.9 Mean 25.7 24.8 25.1 Standard deviation 1.73 2.03 1.86 Vout (m/s) Maximum 3.1 3.1 3.1 Minimum 0.7 1.0 1.0 Mean 1.7 2.0 1.8 Standard deviation 0.89 0.64 0.79 Vin(m/s) Maximum 0.37 0.52 0.52 Minimum 0.05 0.01 0.01 Mean 0.11 0.11 0.10 Standard deviation 0.08 0.06 0.07 RHout (%) Maximum 84.5 92.0 92.0 Minimum 66.0 61.0 61.0 Mean 78.1 76.6 77.6 Standard deviation 4.28 4.65 3.96 RHin (%) Maximum 69.8 55.9 69.8 Minimum 41.5 41.2 41.2 Mean 49.3 46.6 47.6 Standard deviation 3.35 2.82 2.58 Tmr (%) Maximum 27.1 28.2 28.2 Minimum 18.5 17. 17.9 Mean 23.2 23.5 23.3 Standard deviation 1.7 1.93 1.88 To (°C) Maximum 26.7 28.1 28.1 Minimum 18.5 17.8 17.8 Mean 23.0 25.7 24.9 Standard deviation 0.96 1.38 0.99
3.1. Personal data: Age of voters
In 180 offices and habitats studied, ages of voters obtained were ranged from 11 to 70 years. In Figure 4, it appears that in modern homes, 42.8% of voters had an average age from 11 to 20 years against 32.1% in traditional homes. Generally, throughout the experimental study, the average age of all voters was 26.5 years, about 25 years in modern habitats with a standard deviation of 7.34 against 28 in traditional habitats with a standard deviation of 5.23. These averages show that most occupants were adults.
Figure 4 - Frequency distribution of participants by age and habitat.
3.2. Clothing thermal insulation values
Resistance of clothing varied according to sex of the individual and the climate (seasons). In this study, the majority of the thermal insulation obtained varied from 0.3clo to 1.3 clo. By analyzing Figure 5, we found that 57.0% of women had a voting strength beyond 1clo clothing, against 38, 1% of men.
Figure 5 - Clo value frequency by gender during four seasons.
0 10 20 30 40 50 0-20 21-30 31-40 41-50 51-60 61-70 Percentage Age traditional habitats modern habitats
International Journal of Emerging Technology and Advanced Engineering
Website: www.ijetae.com (ISSN 2250-2459,ISO 9001:2008 Certified Journal, Volume 4, Issue 2, February 2014)
41 We deduced that the clothing resistance is greater in women than in men, especially in raining seasons. The average obtained was 0.86 clo, with a standard deviation of 0.18.
3.3 Predicted Mean Vote (PMV) from instrumental data
In Figure 6, it could be seen that there is a linear
correlation between the PMV and indoor air
temperature. The PMV ranges varied from -2.03 to
+1.94 for indoor air temperatures ranging from
16.4°C to 28.5 °C. There is a good correlation (R =
0.8182) between PMV and indoor air temperatures.
The following correlation for PMV was found:
PMV = 0.3594 T
a– 8.3106 (6)
Figure 6 - PMV values as function of indoor air temperature. The thermal neutral temperature was obtained for PMV = 0. The average value for the different habitats of the thermal neutral temperature was found ranging from 23.1°C to 24.8°C.
3.4 Mean thermal sensation votes (MTSV) or PMV questionnaire
Figure (7a and 7b) show the dependence of the Mean thermal sensation votes (MTSV) or Predicted Mean Vote from questionnaire as function of the operative temperature (t0), where a good linear relationship (R
2
= 0.804; R2 = 0.714) were found:
MTSV (Yaounde, traditional living room) = 0.600 tO - 14.25, R² =0.804 (7)
MTSV (Yaounde, modern living room) = 0.576 tO - 14.02, R² = 0.714 (8)
Equations (7) and (8) were obtained from different operative temperatures (temperature of uniform air) ranged from 18°C to 28°C.
Figure 7a - Thermo neutral temperature traditional living room Yaoundé.
Figure 7b - Thermo neutral temperature modern living room Yaoundé.
The thermo neutral temperature was obtained for MTSV = 0. This thermo neutral temperature was 24.3°C in modern habitats against 23.7°C in traditional habitats. The comfort parameter was given in Table 6. The difference between Comfort temperatures was 0.2°C according to the type of residence. From these results, we could conclude that a comfortable habitats is not always a neutral area.
International Journal of Emerging Technology and Advanced Engineering
Website: www.ijetae.com (ISSN 2250-2459,ISO 9001:2008 Certified Journal, Volume 4, Issue 2, February 2014)
42 Table 6
Estimated comfort parameter. City: Yaoundé
Type of residence Modern Traditional Average both types Neutral Temperature (°C) 24.6 24.9 24.7 Comfort temperature (°C) 25.1 24.9 25.0 Therm0 Neutral temperature (°C) 24.3 23.7 24.0 _______________________________________
3.5 Air velocity preference.
Figures (8a and 8b) give the preferences of air movement according to the seasons. During the long dry season, 42.1% of voters wanted an increase in air movement in modern habitats against 53.9% in traditional dwellings. These differences may arise from the structure of these different habitats, but also from the mood of the occupants. During the great rainy season, 69.2% of occupants opted for a reduction in air velocity in buildings (modern living) against 33.0% in traditional buildings.
During the small rainy season, 63.5% of occupants in modern habitats did not want to change their area whereas occupants of traditional habitats wanted more speed in air (49.5%).
Figure 8a - Air velocity preferences in modern habitats during four seasons.
Figure 8b - Air velocity preferences in traditional habitats during four seasons.
When analyzing these different results, we concluded that preferences in terms of air speed varied according to seasons.
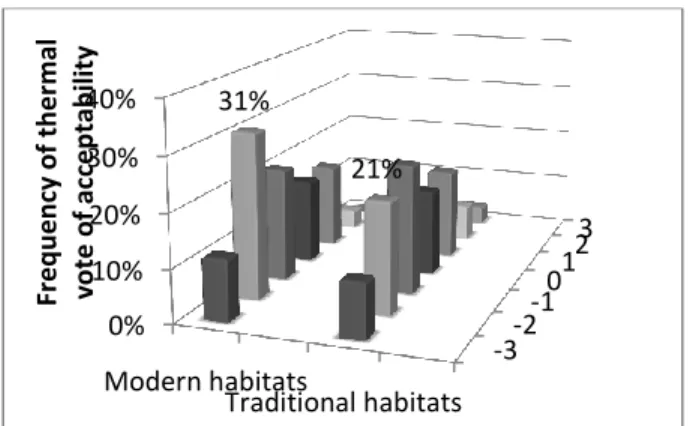
3.6. Thermal Acceptability and Thermal Preference Index 3.6.1 Thermal acceptability
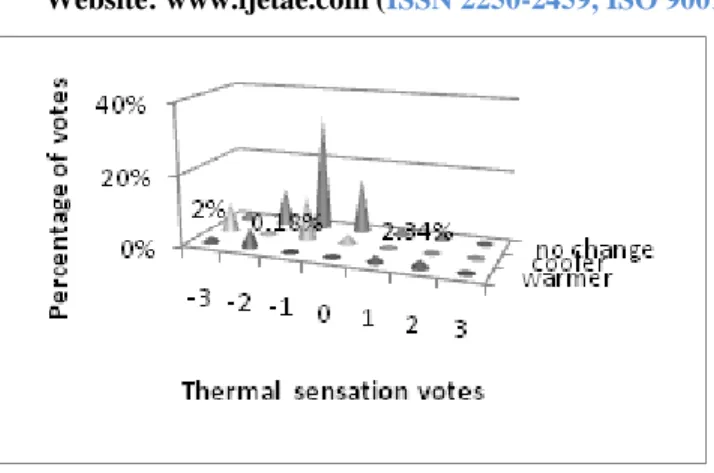
These Figures (9a-9d) give the results of thermal sensation votes obtained during the field study, it appeared that among the 423 participants, during the long dry season (figure 9b), 72.1% found their habitat acceptable. Among the 253 participants during the small raining season (figure 9a), 74.2% found their environment acceptable. During the short dry season (9c) only 10% of participants found their habitat neutral. More than 46.2% individuals in modern habitats voted for -1 (slightly cold), 28.6% individuals in traditional habitats choose index +2 (hot) and 14.3% voted for +3 (hot,). Finally during the high raining season (9d), on 139 participants, 89, 1% was acceptable habitats, 42.1% voted in traditional index o(neutral) against 15.6% in modern. From this study, 77.5% of voting is acceptable environment. Compared to that established in ASHRAE 55:2004 (which is 80%), it is possible to assert that the environment is considered comfortable. These results are not surprising for more than 80% of occupants who expressed their thermal sensation were used to their habitats. The previous results proved that individuals used to their environment found it acceptable.
International Journal of Emerging Technology and Advanced Engineering
Website: www.ijetae.com (ISSN 2250-2459,ISO 9001:2008 Certified Journal, Volume 4, Issue 2, February 2014)
43 Figure 9a - Votes of thermal sensation during the long dry season.
Figure 9b - Votes of thermal sensation during the small rainy season.
Figure 9c - Votes of thermal sensation during the small dry season.
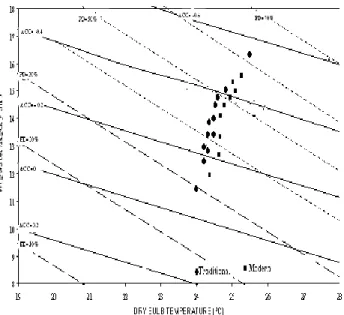
Figure 9d - Votes of thermal sensation during the large rainy season. At the same time, local thermal comfort can be analysed. For an indoor air quality study, there are a number of empirical equations used by some authors, such as Simonson [23], over the last few years. Indices, like the percentage of dissatisfaction with local thermal comfort, thermal sensation, and indoor air acceptability were determined in terms of some simple parameters, such as dry bulb temperature and relative humidity. Thus, the agreement chosen by the ANSI/ASHRAE and ISO 7730 to establish comfort boundary conditions was about 10% of dissatisfaction. To meet the local thermal comfort produced by the inside air conditions, Toftum et al. (1998b) [24, 25] have studied the response of 38 individuals who were provided with clean air in a closed environment. As a result, the equation for the percentage of local dissatisfaction was developed as shown in Equation (9).
( 3.58 0.18 (30 ) 0.14 (42.5 0.01 )
100
1
t pvPD
e
(9)
The ASHRAE recommends keeping the percentage of local dissatisfaction below 15%, and the percentage of general thermal comfort dissatisfaction below 10%. As we can see, this PD tends to decrease when the temperature decreases and, consequently, these limiting conditions can be employed to define the optimal conditions for energy saving in the air conditioning systems. Consequently, Figure 10 shows indoor local thermal comfort conditions in accordance with previous indices. When local thermal comfort was analysed, it was found that the percentage of dissatisfied persons exceeded 40% in both type of habitat and, in particular, in modern habitat, due to its higher average temperature. -3-2 -10 12 3 0% 10% 20% 30% 40% Modern habitats Traditional habitats 31% 21% Fr e q u e n cy o f th e rm al vo te o f ac ce p tab ili ty
International Journal of Emerging Technology and Advanced Engineering
Website: www.ijetae.com (ISSN 2250-2459,ISO 9001:2008 Certified Journal, Volume 4, Issue 2, February 2014)
44 Figure10: Local thermal comfort conditions in yaounde
3.6.2 Thermal Preference
In Figures (11a -11d), the thermal preferences of individuals in their habitats vary according to the different seasons. During the small rainy season (figure11a), index -2(cold) and -1(slightly cold) are the most preferred. In fact, 20.1% of individuals, voting index (-2), preferred an area more warmth, whereas 13.5% persons voting (-1) preferred a colder area. During the great dry season (figure11b), most habitants found their habitats very hot, that is why they voted for index (+3). These people who found their environment very hot preferred (47.4%) a colder area. However, during the small dry season (see figure 11c), habitants found their environment hot; this is why 50% of voters wanted their environment colder. Finally, during the great rainy season(figure11d), habitats had an internal climate slightly cold, that is why 66.2% of voters did not want to change their environment.
Figure 11a - Votes of thermal preference during the Small rainy season.
Figure 11b - Votes of thermal preference during the great dry season.
International Journal of Emerging Technology and Advanced Engineering
Website: www.ijetae.com (ISSN 2250-2459,ISO 9001:2008 Certified Journal, Volume 4, Issue 2, February 2014)
45 Figure 11d - Votes of thermal preference during the great rainy
season.
Table 7 shows different preferences of individuals following periods of study.
Table 7
Thermal preference after the study periods.
Seasons Thermal preference Percentage of vote Dominant index
Large dry season colder 47.4% +3( very hot) Small rainy season warmer 41.1% -1( slightly cool) Small dry season Colder 50.0% +2(hot) Large rainy season No change 66.2% -1(slightly cool )
_____________________________________
3.7 Internal environmental parameters
Figure 12 shows the evolution of the average air temperature and air speed over a period of 49 days. The average temperature obtained varied from 21.5°C to 26.5°C with a standard variation of 1.72. Air speed varied from 0.017m /s to 0.45m/s with an average of 0.11m/s and a standard variation of 0.07. This speed was unpredictable. Generally, we observed that the air velocity was lower in modern environment than in traditional environment.
Figure 12 - Indoor average air temperature and Indoor average air speed in 49 days during dry
The relative average humidity as well as the rate of CO2 is given in Figure 13. The variation of moisture strongly depended not only on the place of study, but also on the structure of the building and the microclimate of the environment.
Figure 13 - Indoor average humidity and CO2 in 49 days during dry
and rainy season.
The average of humidity varied from 45.1% to 68.8%, with an average of 47.6m/s and a standard deviation of 2.18. We deduced that this range was not similar to the one established by the standard ASHRAE55 (30% - 60%). CO2 levels ranging from 717 ppm to 1884ppm and found average was 801ppm. According to ASHRAE 62:1989 (established CO2 < 1000ppm), we deduced that some of these habitats were highly pollutant. Pollution rate obtained was 69.8% for modern habitats against 30.2% for traditional habitats.
This difference shows that in traditional houses made with local materials and adapted to the type climate, there is less pollution.
Results showed that man expressed his preferences and thermal sensations in a naturally controlled. Thermal sensations and perceptions varied from one individual to another, even if they were from the same region and subject to the same type of climate. Thermal comfort was portrayed using a lot of physiological, psychological, physical, quantitative or qualitative parameters, more or less uncertain and vague. In the modern home made of cement blocks, there is thermal discomfort, which requires the use of mechanical ventilation, source of energy in buildings. Some architects neglects the microclimatic aspect.The traditional houses must be built with materials adapted to their environment.
International Journal of Emerging Technology and Advanced Engineering
Website: www.ijetae.com (ISSN 2250-2459,ISO 9001:2008 Certified Journal, Volume 4, Issue 2, February 2014)
46 IV. CONCLUSION
To sum up, in this work, it appears that the study of thermal comfort is important for human beings because they spend 70% of their time inside buildings. So they need a healthy and comfortable environment. This study was conducted during four seasons in modern and traditional habitats in Yaounde (Cameroon). We used the new adaptive approach. Questionnaires are formulated according to UNI and ISO 7730 and 10551. We established that:
The comfort temperature varies seasonally and is higher in dry seasons.
The difference of temperature of neutrality between modern and traditional habitats is 0,3°C.
The difference of temperature of thermal neutrality between modern and traditional habitats is 0.59°C.
Metabolism is higher in traditional and modern habitats.
The relative humidity varies from 45.1% to 68.8% in both traditional and modern habitats, while the wind speed varies from 0,02m/s to 0.45m/s.
The thermal sensations and preferences vary according to different seasons.
The age of the individual influences the choice of preference and thermal sensations.
Therefore, it is very important to get comfort through a judicious choice of building materials and a good definition of an architectural policy construction which takes into account the type of climate, the type of materials and habits of the population. One can increase the thermal comfort without using artificial air conditioning but simply by taking into account the structure and the material used.
Acknowledgements
The authors are grateful to the administration and all staff of the mission of promoting local materials (MIPROMALO) for having provided us with measuring devices. They also thank all those near and far who participated in the preparation of this work during the field study.
REFERENCES
[1] BRUANT,M.1997.Développement et paramétrage de contrôleurs flous multicritères du confort d’ambiance, Thèse de doctorat : INSA de Lyon. Lyon.
[2] Jannot,Y., Djiako,T.1993. Economie d’Energie et confort thermique dans l’habitat en zone tropical .166 (173).
[3] Djongyang,N., Tchinda,R.,2010. An investigation into thermal comfort and residential thermal environment in an intertropical sub-Saharan Africa region: Field study report during the Harmattan season in Cameroon. Energy Conversion and 51- 1391–1397.
[4] Kemajou A., Mba,L.2011. Matériaux de construction et confort thermique en zone chaude Application au cas des régions climatiques camerounaises. Revue des Energies Renouvelables Vol. 14 . pg. 239 – 248.
[5] Hugo Hens. S. L. C. 2009. Thermal comfort in office buildings: Two case studies commented. Building and Environment 44 . pg. 1399– 1408.
[6] Buratti,C., Ricciardi,P.2009. Adaptive analysis of thermal comfort in university classrooms: Correlation between experimental data and mathematical models. Building and Environment 44 . pg. 674–687. [7] Brager S. Gail, J. De Dear Richard.1998. Thermal adaptation in the
built environment: a literature review. Energy and Building 27. pg. 83-96.
[8] Nicol,F.2004. Adaptive thermal comfort standards in the hot- humid tropics. Energy and buildings 36. pg: 628-637.
[9] Fanger,P.O.1972. Thermal comfort. In: Analysis and applications in environmental engineering. New York: McGraw-Hill.
[10] Mui,M., Chan,WT,2005 .Application of the building environmental performance model in Hong Kong. Energy and Buildings, 37. pg. 897-909.
[11] Wang,Z. 2006. A field study of the thermal comfort in residential buildings in Harbin. Building and Environment 41. pg.1034–1039. [12] Hwang,R.L., T-P. Lin, N-J. Kuo. 2006.Field experiments on thermal
comfort in campus Classrooms in Taiwan. Energy and Buildings 38. (2006). pg. 53–62.
[13] Wagner,A., Gossauer,E., Moosmann,C.,2007.Th. Gropp , R.Leonhart . Thermal comfort and workplace occupant satisfaction – results of field studies in German low energy office buildings. Energy and Buildings 37. (2007). pg. 758–769.
[14] Ansaldi,R., Corgnati,S., Filippi.M.,2007. Comparison between thermal comfort predictive models and subjective responses in Italian university classrooms. Proceedings of Clima, WellBeing Indoors; .
[15] Corgnati,S., Filippi,M., Viazzo.2007. Perception of the thermal environment in high school and university classrooms: subjective preferences and thermal comfort. Building and Environment 42. . pg. 951–959.
[16] Raja,I.A., Nicol,J., McCartney,K., Humphreys.M.2001 Thermal comfort: use of controls in naturally ventilated buildings. Energy and Buildings 33. pg. 235-244.
[17] UNI EN ISO 7730. Moderate thermal environments - Determination of the PMV and PPD indices and specification of the conditions for thermal comfort. 2006.
[18] UNI EN ISO 10551. Ergonomia degli ambient termici –valutazione dell’influenza dell’ambiente termico mediante scale di giudizio soggettivo; Gennaio 2002.
[19] ASHRAE. ANSI/ASHRAE Standard 55-2004. Thermal environment conditions for human occupancy. 2004.
[20] Nagano,K.,Mochida.T.,2004. Experiments on thermal design of ceiling radiant cooling for supine human subjects. Building and Environment. 39. pg. 267–275.
[21] D. A. McIntyre. Indoor climate. London: Applied Science Published Ltd.; 1980.
[22] Lin,Z., Deng,S. 2008. A study on the thermal comfort in sleeping environments in the subtropics – developing a thermal comfort model for sleeping environments. Building and Environment,43:70– 80.
International Journal of Emerging Technology and Advanced Engineering
Website: www.ijetae.com (ISSN 2250-2459,ISO 9001:2008 Certified Journal, Volume 4, Issue 2, February 2014)
47 [23] Simonson,C.,Salonvaara,M.,Ojanen,T.2001. “Improving Indoor
Climate and Comfort with Wooden Structures”. Technical research centre of Finland. Espoo .
[24] Toftum,J., Jorgensen,A., Fanger,P.O., 1998. “Upper limits for indoor air humidity to avoid uncomfortably humid skin”. Energy and Buildings. 28, pp. 1-13.
[25] Toftum,J., Jorgensen,A.S., Fanger,P.O., 1998. “Upper limits of air humidity for preventing warm respiratory discomfort”. Energy and Buildings. 28, pp.15-23.
*Corresponding author: e-mail address: