HAL Id: hal-02894917
https://hal-cstb.archives-ouvertes.fr/hal-02894917
Submitted on 10 Jul 2020
HAL is a multi-disciplinary open access
archive for the deposit and dissemination of
sci-entific research documents, whether they are
pub-lished or not. The documents may come from
teaching and research institutions in France or
abroad, or from public or private research centers.
L’archive ouverte pluridisciplinaire HAL, est
destinée au dépôt et à la diffusion de documents
scientifiques de niveau recherche, publiés ou non,
émanant des établissements d’enseignement et de
recherche français ou étrangers, des laboratoires
publics ou privés.
To cite this version:
Pierre Pimienta, Benoît-Louis Marie-Jeanne, Roberto Felicetti. Characterization of tunnel segment fire
behavior: use of nondestructive technics. [Research Report] CSTB - Centre scientifique et technique
du bâtiement; Politecnico di Milano. 2020. �hal-02894917�
CENTRE SCIENTIFIQUE ET TECHNIQUE DU BÂTIMENT > Laboratoire membre de l’association :
Pilot laboratory approved by the French Ministry of the Interior (5
February1959 amended order)
Research report No.MRS 22
Characterization of tunnel segment fire behavior – Use of
non-destructive technics
Authors:
Pierre Pimienta - CSTB
Benoît-Louis Marie-Jeanne - CSTB
Roberto Felicetti – Politecnico di Milano
Date:
25/02/2020
This test report certifies only the characteristics of the object submitted for testing but does not prejudge the characteristics of similar products. So, it does not constitute a product certification in the sense of Articles L 115-27 to L 115-33 and R115-1 to R115-3 of the Consumer Code. Only the electronic report signed with a valid digital certificate is taken in the event of litigation. This electronic report is kept at CSTB for a minimum period of 10 years. The reproduction of this electronic report is only authorized in its integral form. It comprises 26 pages and 34 pages of appendices.
INTRODUCTION
Two twin tunnels have been constructed to cross the Suez Canal in Egypt, one at Port Said near the North entrance of the Suez Canal and one at Ismailia city in the midst of the Canal.
The report presents the results of the fire tests on full size segments from the tunnel at Port Said. Five segments equipped with thermocouples were manufactured by CJV close to the tunnel site in August 2017. Two commercial tests were carried out for the client Orascom in 2018 at the age of 5 months [1] [2].
CSTB and Politecnico de Milano have carried out an additional full-scale fire resistance test on a segment in July 2019 at the age of 23 months. The same experimental procedure as for the other segments has been applied [1] [2] [3].
Mechanical stresses on the segments were applied as a combination of vertical and horizontal loads to simulate the maximum in situ stresses exerted on the tunnel lining due to earth and water pressure.
Concrete segment samples were subjected to the well-known RWS temperature curve (with a maximum temperature of 1350 °C) for a duration of 2 hours. Temperatures loads and displacements at different locations were recorded, during the heating and the cooling phases.
The main aim of the test was to assess the sacrificed thickness of concrete and quantify the spalling phenomena during fire testing. Values will be compared with the ones determined on the 2 previous samples.
Spalling depth fields have been measured about 2 hours after the end of the test with a 3D laser scanner. The importance of measuring depth quickly after testing when severe temperature curves are applied on concrete samples will be discussed.
A new non-destructive technic has been employed during the test: ultrasonic Pulse Echo (UPE). This technic was adapted by Politecnico de Milano to monitor concrete damage and spalling progression during a fire test. Findings from this innovative method will be presented.
REFERENCES
[1] CSTB test report RS 17-069 – “Concerning Port Saïd tunnel reinforced concrete segments fire resistance” – March 2018
[2] Pierre Pimienta, Martin Doll, Dimitrios Rizos, Mahmoud Shamma, Benoît-Louis Marie-Jeanne, Philippe Rivillon, Ménad Chenaf, Mourad Bakhoum, Ahmed Fouda, Tarek Gewaily, Yehia Hussein, Tarik Youssef, Sameh Saad, Tarek Amin. Laboratory fire testing on tunnel segments: suez canal tunnels case. Confernce INTERFLAM, London, 2019, July 1 – 3. pp 1415 – 1426.
[3] Port Saïd Tunnels under Suez Canal – Detailed design Segmental lining. Fire test specification No. PST-RO17-SA-CTU-EESC-19800, June 2017, rev 02B. 32 pages
[4] NF EN 12390-3 Testing hardened concrete - Part 3 : compressive strength of test specimens. June 2019 [5] NF EN 1363-1: 2013-03. Fire resistance tests - Part 1 : general requirements
[6] NF EN 1365-3: 2006-06. Fire resistance tests for loadbearing elements - Part 3: Beams
[7] Fire testing procedure for concrete tunnel linings, Rijkswaterstaat/Efectis Nederland, n° R0695, September 2008. [8] Felicetti R., Lo Monte F. (2016), Pulse-Echo Monitoring of Concrete Damage and Spalling during Fire,
Proceedings of the 9th International Conference Structures in Fire 2016 – SIF’16, June 8-10, 2016, Princeton (USA), pp. 851-858.
[9] Boström, L., Jansson, R., 2008. Self-compacting concrete exposed to fire (No. 2008:53), SP Report. SP, Boras, Sweden.
[10] Taillefer, N., Pimienta, P., Dhima, D., 3rd International Workshop on Concrete Spalling due to Fire Exposure 2013. Spalling of concrete: A synthesis of experimental tests on slabs. MATEC Web of Conferences 6, 01008. https://doi.org/10.1051/matecconf/20130601008
[11] Mindeguia, J.-C., Carré, H., Pimienta, P., Borderie, C.L., 2014. Experimental discussion on the mechanisms behind the fire spalling of concrete. Fire and Materials 39, 619–635. https://doi.org/10.1002/fam.2254
[12] NF EN 1992-1-2 Eurocode 2: Design of concrete structures Part 1-2 : General rules — Structural fire design [13] Nicolas Taillefer, Pierre Carlotti, Catherine Larive, Christophe Lemerle, Romuald Avenel, Pierre Pimienta
(2012) Ten years of increased hydrocarbon temperature curves in French tunnels. Fire Technology.Volume 49, Issue 2 (2013), pp 531-549
[14] Miah, M.J., Lo Monte, F., Felicetti, R., Carré, H., Pimienta, P., La Borderie, C., 2016. Fire Spalling Behaviour of Concrete: Role of Mechanical Loading (Uniaxial and Biaxial) and Cement Type. Key Engineering Materials 711, 549–555. https://doi.org/10.4028/www.scientific.net/KEM.711.549
OBJECT SUBMITTED FOR TESTING
Samples submitted by : CJV
Product reference : RC segments dedicated to Port Saïd tunnel construction
Manufacturer : CJV
Origin of samples : PORT SAÏD (Arab Republic of Egypt) Date of sample manufacturing : 28/08/2017
Date of delivery : 14/12/2017
Date of test : 12/07/2019
Tests operators:
Tests supervisor : Pierre PIMIENTA / Benoît-Louis MARIE-JEANNE Pulse echo test operator : Roberto FELICETTI
Furnace control operator : Stéphane CHARUEL Vertical loading operators : José PESTANA Horizontal loading operators : Miguel CRUZ
Written at Marne-la-Vallée, 2020 January 13rd
Written by Benoît-Louis MARIE-JEANNE
Project engineer
Roberto Felicetti
Prof at Politecnico de Milano
Checked by Pierre PIMIENTA
Vice Head of Division
Approved by Pierre PIMIENTA
1 Test program
Five segments equipped with thermocouples were manufactured in the plant close to the tunnel site. Two fire tests were performed in 2018 at the age of Egypt for the fire tests in the frame of the Port Saïd Road Tunnel project [1]. The reference of the tested segment is DL09. The same experimental procedure as for the other segments has been applied [1] [2].
2 Test specimens
The test segments were manufactured by CJV Factory in the plant in Port Saïd (Arab Republic of Egypt). They were manufactured under the witness of Romuald AVENEL and Pierre PIMIENTA from CSTB. The manufacturing took place on 28/08/2017.
All dimensions are expressed in millimeters (mm).
NOTE: The drawings and the detail drawing of the construction element tested (as reported here) are those provided by the applicant.
2.1 Segments geometry
The segments geometry is the following:
Dimensions of the reinforced concrete segments: L × l × e = 4 524 × 2 000 × 600
Curvature radius: R = 5 600
2.2 Mix design of the concrete and other products
2.2.1 Mix design of the concrete (established according to manufacturer’s data)
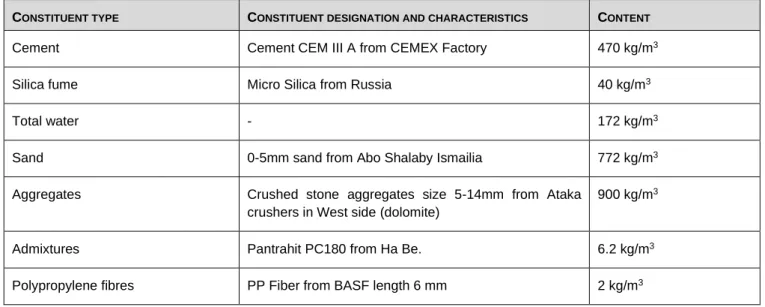
The mix design of the concrete used to cast the samples is given in Table 1.
Table 1: Mix design of the concrete
CONSTITUENT TYPE CONSTITUENT DESIGNATION AND CHARACTERISTICS CONTENT
Cement Cement CEM III A from CEMEX Factory 470 kg/m3
Silica fume Micro Silica from Russia 40 kg/m3
Total water - 172 kg/m3
Sand 0-5mm sand from Abo Shalaby Ismailia 772 kg/m3
Aggregates Crushed stone aggregates size 5-14mm from Ataka crushers in West side (dolomite)
900 kg/m3
Admixtures Pantrahit PC180 from Ha Be. 6.2 kg/m3
2.2.2 Other products (established according to manufacturer’s data)
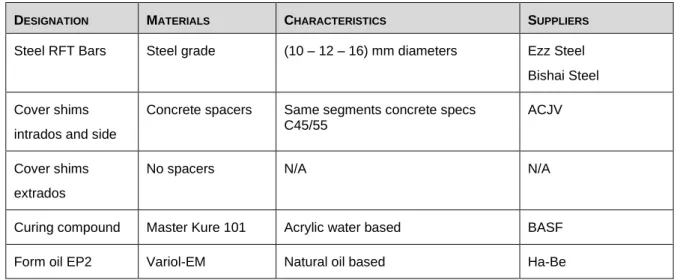
The other products used for the samples manufacturing are listed in Table 2.
Table 2: Other products used for the segments manufacturing
DESIGNATION MATERIALS CHARACTERISTICS SUPPLIERS
Steel RFT Bars Steel grade (10 – 12 – 16) mm diameters Ezz Steel Bishai Steel Cover shims
intrados and side
Concrete spacers Same segments concrete specs C45/55
ACJV
Cover shims extrados
No spacers N/A N/A
Curing compound Master Kure 101 Acrylic water based BASF
Form oil EP2 Variol-EM Natural oil based Ha-Be
2.2.3 Manufacturing, transportation and conditioning of test specimens
Pictures of the manufacturing are given in Appendix A. Thermocouples were installed in the molds. After pouring the concrete in the molds, the segments were covered with fabrics. They were demolded 1 day after their casting. They were transported with the small samples by truck and boat to CSTB in France.
In CSTB, they have been stored in the laboratory hall until the tests.
2.2.4 Quality control and characteristics of the concretes
Quality control and characteristics of the concrete are given in Table 3.
Table 3: Quality control and characteristics of the concrete
ID Manufacturing time Slump
(cm) fc at 28 days (MPa) * fc at 695 days (MPa) ** DL09 28/08/2017 22 (62.7 – 61.9 – 61.7)62.1 (61.9 – 65.0 – 67.4)64.8 NOTE:
* Results on concrete compressive strength at 28 days were determined on cylinders 150 mm × 300 mm ( × h) were provided by the customer.
** Results on concrete compressive strength at the days of fire tests were determined on cylinders 150 mm ×300 mm ( ×h) according to NF EN 12390-3 [4] by the Material unit section of CSTB. This laboratory is accredited for this test by COFRAC and IAS (COFRAC accreditation n° 1-0301 and IAS accreditation TL-312).
2.2.5 Water content
Water content was determined on 3 concrete cylinders manufactured with the same concrete batches than the segment. In addition, it was determined on pieces of concrete detached from the segment corners.
Three 600 mm long PVC tubes ( 110 mm) have been filled with the same concrete than for the segment. The cylinders were stored in the same condition than the segments.
From the delivery of the segment lining, the evolution of their weights was measured by regular weighing.
In order to determine the water content profile versus the depth, part of the cylinders has been cutted without water cooling. The lengths of the cutted samples are given in Figure 1.
The water content has been determined according to NF EN 1363-1, Annex F [5] by drying the samples at 105°C and determination of the mass difference.
Water content measurements of concrete pieces and cylinders are respectively reported in Figure 1 and in Figure 2.
Figure 1: Water content of the cylinders (ref DL09) and their cutted samples
3 Instrumentation
3.1 Thermocouples
3.1.1 Furnace thermocouples (plate pyrometers)
The temperatures are measured by using six plate pyrometers and recorded during the test, in accordance with standard NF EN 1363-1 paragraph 9.1.1 [5].
Positions and identification of temperature measurements are given in Figure 3.
3.1.2 Internal thermocouples
The segment was equipped with lines of 1 mm glass silk K type thermocouples at different heights. In each line, thermocouples were positioned at 25, 50, 75, 100, 150, 200, 250 and 300 mm depths from the exposed surface (Figure 4).
They have been installed in the formworks by Romuald AVENEL from CSTB with the assistance of ORASCOM company operators.
The series of 8 thermocouples have been beforehand assembled along a thin metal rod.
On site, the thermocouples were tied to the steel reinforced bars in order to impede their movement into the concrete formwork during the mold filling. The outer parts of the thermocouples were assembled in plastic bags.
Additional thermocouples have been installed on the upper side of the longitudinal reinforcing bars in the segment. There are denominated δ.
Figure 4: Drawing and picture presenting the position of the K type thermocouples at different depths from the exposed surface
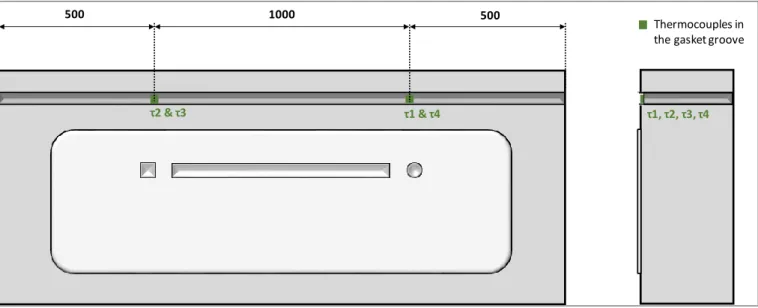
Location of the thermocouples is given in Figure 5, Figure 6 and in the appendix B page 17.
Figure 5: Top view – Location of the inner thermocouples
Figure 6: Front view – Location of the thermocouples at the boundaries of the single segment
1280 355 355 H I G 200 100 100 L K δ1 δ2 δ3 δ6 δ5 δ4 Thermocouples on rebars Thermocouples lines J 200 τ2 & τ3 τ1, τ2, τ3, τ4 500 1000 500 Thermocouples in the gasket groove
3.2 Displacements
Displacements are measured in accordance with standard NF EN 1363-1 [5].
Displacements are measured with 15 mm Solartron potentiometric sensors with a measurement uncertainty lower than 0.05 mm. The vertical displacement sensors are hold on two frames fixed on the two extremities on the segment in order to determine the true deflection directly.
Deflection is measured in accordance with standard NF EN 1365-3 [6]. The frame used to hold the vertical displacement is shown in Figure 7 with the rolling and fixed contacts. Rolling and fixed contacts are located at 85 mm from the edge of the segment.
Figure 7: Rolling (left) and fixed (right) contacts of the frame used to measure the vertical displacement
The position of displacement sensors are presented in Figure 8, Figure 9 and Figure 10. Horizontal and vertical displacement are denominated T1 to T4 and T5 to T6 respectively.
T2 T1 T4 T5 T6 T5 1280 150 150 205 205
Figure 9: Top view – Displacement sensors locations with the two supporting frames
Figure 10: Top view – Displacement sensors locations with the two supporting frames
270 270 85 85 T2 T1 T4 T3 T6 T5 1280 105 T5& T6 4000 T1& T2 T3& T4
4 Test procedure
Temperatures, loads, pressure and displacements have been measured and recorded in accordance with NF EN 1363-1 [5] and NF EN 1365-3 [6].
4.1 Load application
4.1.1 General description
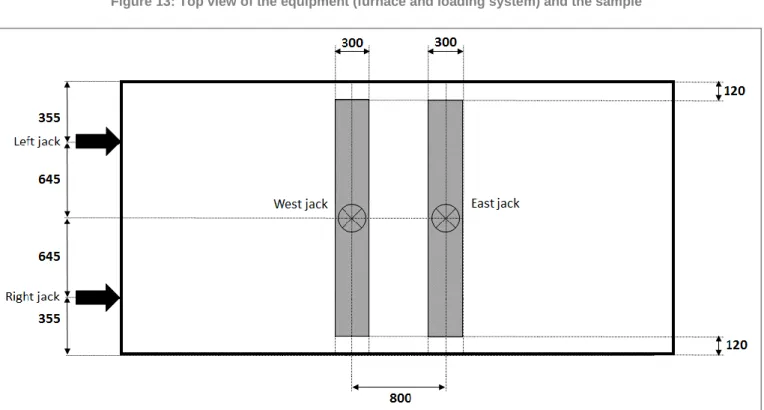
Mechanical loading equipment is represented in Figure 11, Figure 13 and Figure 15. It consists in: - one horizontal frame with two 4 500 kN jacks;
- one vertical frame with two vertical 2 000 kN jacks.
Figure 13: Top view of the equipment (furnace and loading system) and the sample
Figure 15: Picture of the whole equipment and the sample
4.1.2 Description of the zones of the segments to be loaded
➢ Horizontal load
The horizontal load is applied to the segment through 2 jacks on one side and 3 reaction locations on the other side. The geometry of the mechanical system from the actuator to the segment is presented in Figure 16.
➢ Vertical load
A mortar layer is applied on the top of the segment in order to obtain a flat and horizontal surface to load the sample. Geometry of the mortar layer are given in Figure 18.
Figure 18: Geometry of the mortar layer on the top of the segments in order to obtain a flat and horizontal surface to apply the vertical load
4.1.3 Load application control
The two vertical jacks of 2 000 kN are load controlled. Once the target load is reached, the load was maintained constant during the entire test. Thus, vertical displacements are possible during the test.
For the loading phase, the horizontal jacks of 4 500 kN are load controlled. They are displacement controlled during the fire test. When the target load is reached before the fire test, the position of the jacks is blocked during all the test. Load can change during the test.
Load and displacement curves versus time are given in the appendices.
4.1.4 Loading protocol
The loading protocol described here below has been designed in order to:
- reach the final test load in the segments, in such a way that no tensile strength appears in any point;
- insure reaching at the end of the loading phase, a compression strength of 12 MPa in the intrados (fire side). The horizontal and vertical loads increase successively during the loading phase following the values given in Figure 19. The mechanical loading kinematic before the application of the thermal load is as follows:
V H kN kN 100 315 200 630 300 915 400 1 200 500 1 450 600 1 700 700 1 900 800 2 100 900 2 300 1 000 2 500 1 100 2 750 1 200 3 000 1 300 3 250 1 400 3 600 1 500 4 100 1 600 4 900 1 700 6 000 1 766 7 286
4.2 Fire exposure
Segments are exposed to fire as described in the drawing in Figure 20.
Figure 20: Sample fire exposure
4.3 Temperature curve
The followed temperature curve is given in Figure 21. The first 120 min of the fire exposure (ascending branch and the beginning of the descending branch) comply with RWS curve [7]. The final 120 min (descending branch) comply with the RABT/ZTV-Ing. curves.
5 Results determined during fire tests
5.1 Furnace temperatures
The furnace temperatures are given in the appendix B page 16.
5.2 Internal temperatures
The temperature curves are given in the appendix B pages 17 to 21.
5.3 Mechanical loads, displacements and strain distribution
Mechanical loads, displacements and strain distribution curves are given in the appendix B pages 22 to 27.
6 Observations
6.1 Observations during the fire tests
Visual observations were carried out on the unexposed surface of the sample and on the exposed surface using portholes positioned on the lateral sides of the Vulcain furnace.
In addition, videos were recorded using an endoscopic camera positioned inside the furnace and able to capture images in heated environments.
Time Exposed side Non exposed side
0 h 00 min Start of the test | Ambient temperature: 22 [°C]
0 h 01 min Beginning of the spalling No significant change 0 h 05 min Slowing down of the spalling phenomenon No significant change 0 h 08 min Final spalling time No significant change 0 h 30 min No significant change No significant change 1 h 00 min No significant change No significant change 2 h 00 min No significant change No significant change 3 h 00 min No significant change No significant change 4 h 00 min No significant change No significant change 4 h 13 min Test stop
7 Fire tests results expressed according to the standards and spalling
depths measurements
7.1 Fire resistance tests results expressed according NF EN 1363-1 [5] and NF EN
1365-3 [6]
Loadbearing capacity
Limiting deflection Limiting rate of deflection
240 minutes (no failure) 240 minutes (no failure)
Insulation
Duration 240 minutes (no failure)
7.2 Spalling depths measurement
7.2.1 Spalling depths measurement of the tested segment
Spalling was observed very early after the start-up of the furnace, during the first minute. The frequency of the events was quite constant during about 5 min and then slowed down. Spalling stopped after 8 min.
Spalling depth fields were measured with a 3D laser scanner (FARO Focus 3D X30). Measurement was performed about 2 hours after the end of the temperature cooling phase (1 hour after removing the segment from the furnace). A second measurement was performed 4 days after the test.
Spalling depth topographies are given in Figure 22 (after 2 hours) and Figure 23 (after 4 days). Measurements and pictures are given in appendix B pages 28 to 34.
In Figure 22, spalling depths are higher in 2 zones:
- upper left quarter with depth values between 30 and 38 mm. - central part with depth values between 20 and 26 mm.
The zones corresponding to the remaining crust layers in Figure 26 (see below) are visible in the Figure 22.
It is to be noted that part of the values is positive. This is explained first by the fact that in addition to the loss of concrete due to the spalling phenomena (negative values), the material expanded below the surface with partial detachment of concrete layers. Indeed, bumps were observed on the segment and voids were detected below the surface by hammering.
The second explanation is that part of the remaining crust on the segment is partially detached from the surface as can be seen in the side views (figure 35 et 36 in the Appendix B).
Values are summarized here below. Mean spalling depth 2 hours after the test Maximum spalling depth 2 hours after the test Standard deviation 2 hours after the test
12 mm 38 mm 12 mm Mean spalling depth 4 days after the test
Maximum spalling depth 4 days after the test Standard deviation 4 days after the test
13 mm 48 mm 11 mm
Figure 22 : Spalling depth field determined 2 hours after the test from 3D laser scanning. Values are given in mm
Figure 23 : Spalling depth field determined 4 days after the test from 3D laser scanning. Values are given in mm NOTE: The jacks are located on the left of the topography in Figure 22 and Figure 23.
7.2.2 Detailed analyses of the spalling phenomena during the test and after the test
Four pictures from the segment taken at different times are given Figure 24, Figure 25, Figure 26 and Figure 27. Picture 23 is a screenshot from the recorded video with one of the endoscopes after 8 min test. We can clearly observe in this the relief related to the spalling phenomena. Spalling depth is low. The reinforcement is not visible which means that spalling depth is lower than 50 mm. It is to be noted that, in the pictures from the endoscopes, the relief appears exaggerated at the beginning of the test.
Spalling depth is quite homogeneous in the Figure 25, taken in the furnace just after the temperature cooling phase. We just can observe the fall down of a flake in the upper left corner of the picture.
Large number of flakes has fallen down during handling the segment out of the furnace (Figure 26).
The phenomena continued until the 3D laser scanning (Figure 27). In this picture, most of the visible concrete at the end of the test has disappeared. Fallen concrete pieces are visible at the foot of the segment. The crust thickness was between 8 and 9 mm.
Figure 24: Segment in the furnace during the fire test after 8 min taken with one of the 2 endoscopes
Figure 25: Segment in the furnace after cooling down the temperature
Figure 26: Segment just after being removed from the furnace
Figure 27: Segment 2 hour after being removed from the furnace during the 3D laser scanning
As written before, in Figure 22, spalling depths are higher in 2 zones: - upper left quarter with depth values between 30 and 38 mm; - central part with depth values between 20 and 26 mm.
By considering that there were no expansion (no partial detachment) in these 2 areas and that the thickness of the fallen crust before the measurement was 8 mm, the spalling depth at the end of the fire test could have been between 22 and 30 mm and 12 and 18 mm respectively.
Spalling depths values to be used in the calculations are the ones during the fire test. From the measured values and the observation, we tend to estimate these values before the crust fall down.
Calculated values are given in Table 1. Mean value is estimated to be close to 7 mm and maximum value to be 30 mm.
Determined values after 4 days are given in table 4 too. During the 4 days period, the few remaining crust pieces and part of the concrete on the surface fell down. In the same time, additional expansion with partial detachment of concrete layers have occurred in some locations. Nevertheless, mean and maximum values are higher: 13 mm and 48 mm respectively. The reinforcement bars were visible in a few locations.
Table 1: Spalling depth values determined after 2 hours and 4 days from direct measurement and estimated by taking into account the 8 mm crust fall down.
Spalling depths Mean value Maximum value
Determined values from direct measurements after 2 h ≈ 15 mm 38 mm Estimated values after 2 h by taking into account the 8 mm crust fall down ≈ 7 mm 30 mm Determined values from direct measurements after 4 days 13 mm 48 mm
8 Ultrasonic pulse echo measurements
8.1 Test method
In order to allow the real-time monitoring of spalling progression during fire tests, the Ultrasonic Pulse Echo (UPE) technique was implemented by Felicetti and Lo Monte, 2016 [8]. The principle is to trigger very short ultrasonic pulses (1.5 cycles at 50 KHz) at the segment extrados and to detect the returning signal after complete back-reflection at the fire-exposed intrados (Figure 28). The total time of flight is governed by the combined effect of the element thickness and the material quality (pulse velocity). Concrete damage due to heating translates into a gradual increase, while spalling events lead to sharp reductions of propagation time. The method was implemented by means of a dry-point contact shear-wave sensor array (M2502 by ACS) fitted with a square wave pulser, a high gain amplifier and a digital scope. The sensor was installed in the central point of the segment and could monitor about 1 m2 of the exposed intrados. The shift of propagation time was calculated based on the best cross-correlation between the current and the initial reflected echoes.
Figure 28: Ultrasonic Pulse Echo (UPE) technique principle (left) and pulse delay versus time (right)
8.2 Test results
The results show that three spalling events occurred in the first 6 minutes, leading to a total reduction of propagation time by 4.5, 10 and 21 microseconds (Figure 28). By considering the initial shear wave velocity (2.7km/s) and the expected material decay (average temperature in the detaching splinters ranging between 70 and 650°C) the corresponding total depths of spalling are 6, 13 and 21mm.
The last value is relatively consistent with the estimated result of 3D laser scanning in the central region of the segment (between 12 and 18 mm).
The difference between the determined value with the Ultrasonic Pulse Echo (UPE) (21 mm) and the 3D laser (between 12 and 18 mm) could be explained by the fact that contrary to what we have assumed above, some expansion (partial detachment) occurred In the central area between the beginning of the fire test (Ultrasonic Pulse Echo detections) and the 3D laser measurements.
9 Results comparison between tests carried out at different age
Two previous tests have been performed on two other segments: one single segment and one two half segment (Pimienta et al, 2019). They were manufactured in the same time and received on the same date at CSTB. Table 2 compares the ages, the determined water content ranges and the spalling depths measurements determined 1 day (age = 5 months) and 4 days (age = 23 months) after the tests.
Table 2: Spalling depth determined at 5 months (1day after the test) and 23 months (4 days after the test)
Age Water content (%) Mean spalling depth Maximum spalling depth
Full segment 5 months 4.2 – 4.8 57 mm 103 mm
Two half segments 5 months 4.2 – 4.8 59 mm 110 mm
Full segment 23 months 2.0 – 2.5 13 mm 48 mm
The 3 tests have been carried out under the same conditions (same mechanical and thermal loads). Results clearly show a drastic reduction of the spalling sensitivity of the concrete segments after 23 months. Moisture content is one of the main influencing parameters on concrete fire spalling [9] [10] [11]. The water content decrease from 4.2 – 4.8 % (5 months) to 2.0 – 2.5 % (23 months) must then be the main reason of the spalling sensitivity reduction. It must be pointed out that the actual version of Eurocode 2 part 1-2 [12] recommends 3 % as the water content threshold value for the spalling sensitivity increase.
10 Spalling concrete behaviour
Concrete mix included 2 kg/m3 of monofilament polypropylene fibres. Their length and diameter were 6 mm and 18 microns respectively. It has been shown in many experiments that polypropylene fibers can reduce significantly the risk and the amount of spalling [9] [11] [13].
However, as presented above, spalling phenomena was observed in particular during the tests carried out after 5 months. Indeed, the presented test has several characteristics that can increase the risk of spalling. Some of them are:
- the very fast increase of the temperature at the beginning of the tests (tunnel RWS curve versus the common ISO 834-1 temperature curve);
- the high water content in the tests carried out after 5 months;
- the medium range concrete compressive strength (64.8 MPa after 23 months) versus a low range concrete (from 20 to 40 MPa) and low concrete permeability [11];
11 Conclusions
Several full-scale fire resistance tests have been successfully carried out on mega size reinforced concrete segments from two twin tunnels under the Suez Canal.
A new and original mechanical loading equipment has been designed and produced in CSTB. Horizontal and vertical loads with appropriate eccentricities were applied to simulate the in-situ tunnel stresses. Samples have been exposed to the RWS temperature curve for 2 hours.
Spalling depth fields have been measured about 2 hours after the end of the test with a 3D laser scanner. The importance of measuring depth quickly after testing when severe temperature curves are applied on concrete samples has been shown. Spalling depths values determined just after the test were lower than the ones determined 4 days after.
Ultrasonic Pulse Echo (UPE) technique was successfully used in order to monitor the spalling progression. Determined values were relatively consistent with the result of 3D laser scanning ones.
Spalling depths results determined after 5 months and 23 months clearly show a drastic reduction of the spalling sensitivity of the concrete segments in the latter test. Water content reduction is expected to be the main reason of the observed behavior.
From the gained experience and the captured results, authors would like to emphasize the importance of those tests to be conducted for major projects.
Acknowledgement
The authors want to acknowledge the contribution of all the CSTB team that was involved in the project.