HAL Id: hal-01611416
https://hal.archives-ouvertes.fr/hal-01611416
Submitted on 5 Oct 2017
HAL is a multi-disciplinary open access
archive for the deposit and dissemination of
sci-entific research documents, whether they are
pub-lished or not. The documents may come from
teaching and research institutions in France or
abroad, or from public or private research centers.
L’archive ouverte pluridisciplinaire HAL, est
destinée au dépôt et à la diffusion de documents
scientifiques de niveau recherche, publiés ou non,
émanant des établissements d’enseignement et de
recherche français ou étrangers, des laboratoires
publics ou privés.
Distributed under a Creative Commons Attribution - NonCommercial - ShareAlike| 4.0
International License
Tradeoffs between Economic, Environmental and Social
Sustainability: The Case of a Selection of European
Farms
Laure Latruffe, Yann Desjeux, Giffona Loysell Justinia Hanitravelo, Thia
Hennessy, Christian Bockstaller, Pierre Dupraz, John Finn
To cite this version:
Laure Latruffe, Yann Desjeux, Giffona Loysell Justinia Hanitravelo, Thia Hennessy, Christian
Bock-staller, et al.. Tradeoffs between Economic, Environmental and Social Sustainability: The Case of a
Selection of European Farms. [Contract] FLINT D5.2L, auto-saisine. 2016, 46 p. �hal-01611416�
TRADEOFFS BETWEEN
ECONOMIC,
ENVIRONMENTAL AND
SOCIAL SUSTAINABILITY:
THE CASE OF A
SELECTION OF
EUROPEAN FARMS
Laure LATRUFFE1, Yann DESJEUX1, Giffona JUSTINIA HANITRAVELO1, Thia HENNESSY3, Christian BOCKSTALLER2, Pierre DUPRAZ1, John FINN4
1
INRA, SMART, Rennes, France
2 INRA, LAE, Colmar, France 3
University College Cork, Food Business and Development Department, Ireland
4
Teagasc, Ireland
29 December 2016
Public
ABOUT THE FLINT PROJECT
FLINT will provide an updated data-infrastructure needed by the agro-food sector and policy makers to provide up to date information on farm level indicators on sustainability and other new relevant issues. Better decision making will be facilitated by taking into account the sustainability performance of farms on a wide range of relevant topics, such as (1) market stabilization; (2) income support; (3) environmental sustainability; (4) climate change adaptation and mitigation; (5) innovation; and (6) resource efficiency. The approach will explicitly consider the heterogeneity of the farming sector in the EU and its member states. Together with the farming and agro-food sector the feasibility of these indicators will be determined.
FLINT will take into account the increasing needs for sustainability information by national and international retail and agro-food sectors. The FLINT approach is supported by the Sustainable Agriculture Initiative Platform and the Sustainability Consortium in which the agro-food sector actively participates. FLINT will establish a pilot network of at least 1000 farms (representative of farm diversity at EU level, including the different administrative environments in the different MS) that is well suited for the gathering of these data.
The lessons learned and recommendations from the empirical research conducted in 9 purposefully chosen MS will be used for estimating and discussing effects in all 28 MS. This will be very useful if the European Commission should decide to upgrade the pilot network to an operational EU-wide system.
PROJECT CONSORTIUM:
1 DLO Foundation (Stichting Dienst Landbouwkundig Onderzoek) Netherlands
2 AKI - Agrargazdasagi Kutato Intezet Hungary
3 LUKE Finland Finland
4 IERiGZ-PIB - Instytut Ekonomiki Rolnictwa i Gospodarki
Zywnosciowej-Panstwowy Instytut Badawcy Poland
5 INTIA - Instituto Navarro De Tecnologias e Infraestructuras Agrolimentarias Spain
6 ZALF - Leibniz Centre for Agricultural Landscape Research Germany
7 Teagasc - The Agriculture and Food Development Authority of Irelan Ireland
8 Demeter - Hellenic Agricultural Organization Greece
9 INRA - Institut National de la Recherche Agronomique France
10 CROP-R BV Netherlands
11 University of Hohenheim Germany
MORE INFORMATION:
Drs. Krijn Poppe (coordinator) e-mail: krijn.poppe@wur.nl
Dr. Hans Vrolijk e-mail: hans.vrolijk@wur.nl
LEI Wageningen UR phone: +31 07 3358247
P.O. Box 29703
2502 LS The Hague www.flint-fp7.eu
4
Tradeoffs between economic, environmental and social sustainability: The case of a selection of European farmsTABLE OF CONTENTS
List of tables ... 5 List of acronyms... 6 Executive summary ... 7 1 Introduction ... 82 Methodology and data ... 10
2.1 Methodology ... 10
2.2 Data ... 14
3 Results ... 18
3.1 Tradeoffs between economic, environmental and social sustainability ... 18
3.2 Structural characteristics of the most sustainable farm cluster in each farm type ... 28
4 Conclusions ... 34
4.1 Main outcomes ... 34
4.1.1 No consistent relationship between economic and environmental indicators ... 34
4.1.2 High social sustainability was associated with high economic performance ... 35
4.1.3 Farm size was not consistently related to performance ... 35
4.1.4 Farm subsidies were not consistently related to either economic and/or environmental performance ... 35
4.2 Methodological recommendations ... 35
4.3 Limitations to interpretation ... 36
Tradeoffs between economic, environmental and social sustainability: The case of a selection of
European farms
5
LIST OF TABLES
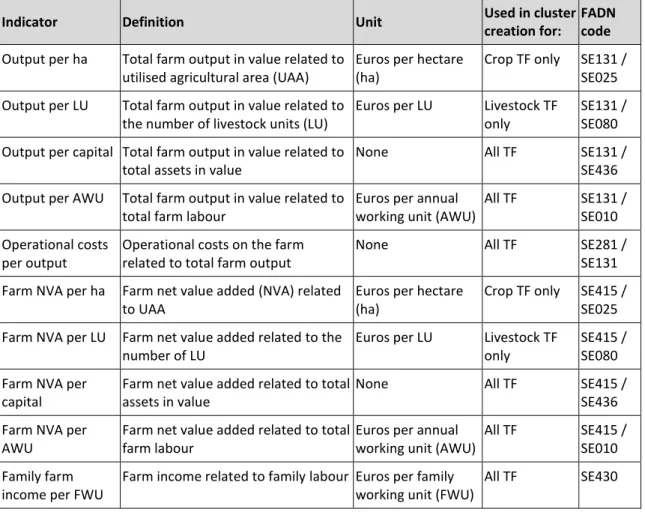
Table 1: Definition of the indicators of economic sustainability used from the FADN data ... 11
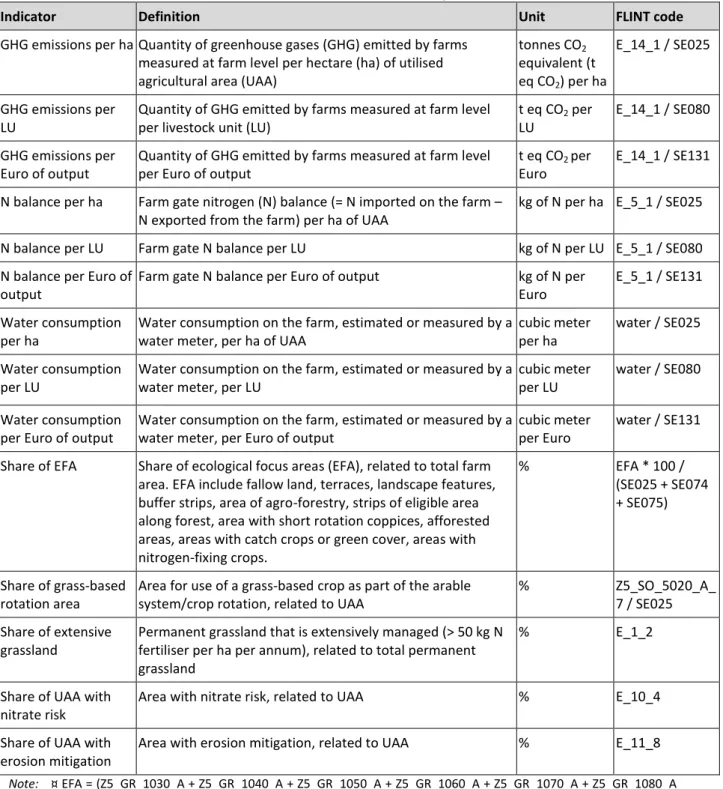
Table 2: Definition of the indicators of environmental sustainability used from the FLINT data ... 12
Table 3: Definition of the indicators of social sustainability used from the FLINT data ... 13
Table 4: Number of farms per type of farming (TF) ... 14
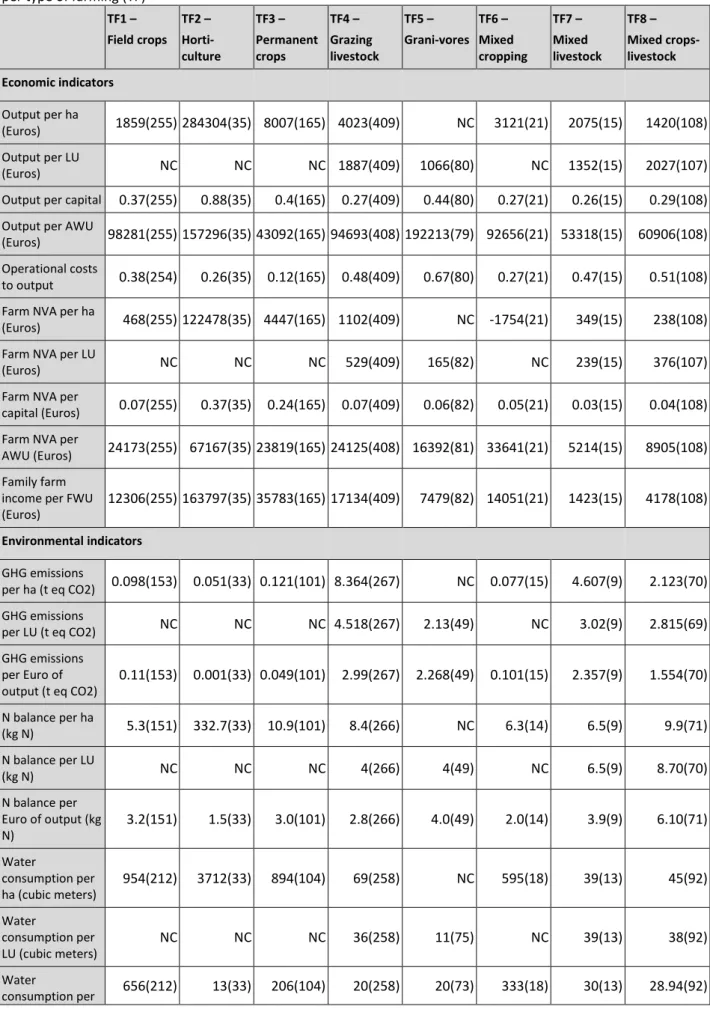
Table 5: Average structural characteristics of the farms for the whole sample per type of farming (TF) . 15 Table 6: Average indicators of economic, environmental and social sustainability for the whole sample per type of farming (TF)... 16
Table 7: Average indicators of economic, environmental and social sustainability of the clusters of type of farming 1 - Field crops ... 20
Table 8: Average indicators of economic, environmental and social sustainability of the clusters of type of farming 2 – Horticulture ... 21
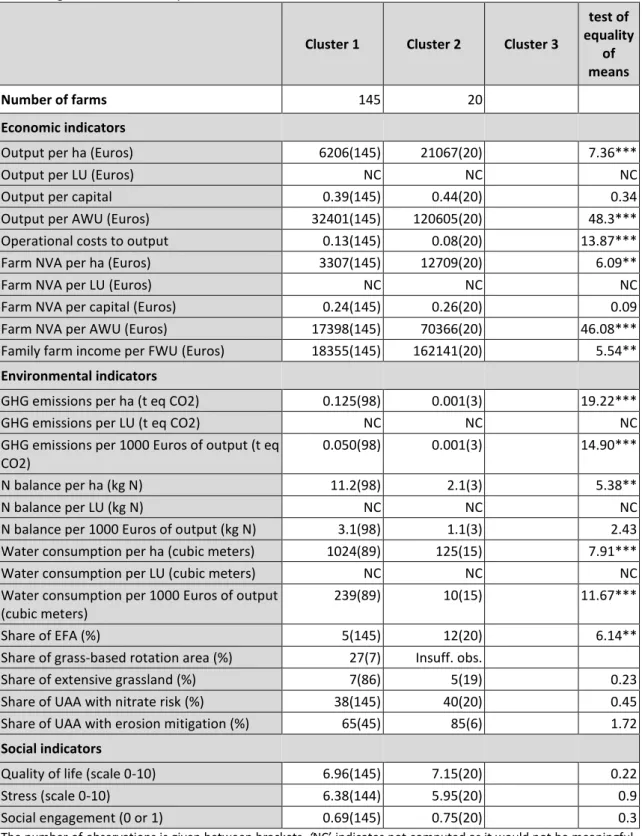
Table 9: Average indicators of economic, environmental and social sustainability of the clusters of type of farming 3 - Permanent crops ... 22
Table 10: Average indicators of economic, environmental and social sustainability of the clusters of type of farming 4 - Grazing livestock ... 23
Table 11: Average indicators of economic, environmental and social sustainability of the clusters of type of farming 5 – Granivores ... 24
Table 12: Average indicators of economic, environmental and social sustainability of the clusters of type of farming 6 - Mixed cropping ... 25
Table 13: Average indicators of economic and environmental sustainability of the clusters of type of farming 7 - Mixed livestock ... 26
Table 14: Average indicators of economic, environmental and social sustainability of the clusters of type of farming 8 - Mixed crops-livestock ... 27
Table 15: Average structural characteristics of the clusters of type of farming 1 - Field crops ... 29
Table 16: Average structural characteristics of the clusters of type of farming 2 – Horticulture ... 30
Table 17: Average structural characteristics of the clusters of type of farming 3 - Permanent crops ... 30
Table 18: Average structural characteristics of the clusters of type of farming 4 - Grazing livestock ... 31
Table 19: Average structural characteristics of the clusters of type of farming 5 – Granivores ... 31
Table 20: Average structural characteristics of the clusters of type of farming 6 - Mixed cropping ... 32
Table 21: Average structural characteristics for the clusters of type of farming 7 - Mixed livestock ... 32
Table 22: Average structural characteristics for the clusters of type of farming 8 - Mixed crops-livestock ... 33
6
Tradeoffs between economic, environmental and social sustainability: The case of a selection of European farmsLIST OF ACRONYMS
AWU Annual Working Unit
CAP Common Agricultural Policy EFA Ecological Focus Areas
EU European Union
FADN Farm Accountancy Data Network
FWU Family Working Unit
GHG GreenHouse Gases
LFA Less Favoured Areas
LU Livestock Unit
NVA Net Value Added
TF Type of Farming
Tradeoffs between economic, social and environmental sustainability: The case of a selection of
European farms
7
EXECUTIVE SUMMARY
For a selection of farms in the Farm Accountancy Data Network (FADN) of the European Union, the economic, environmental and social performance of farms is measured using farm level sustainability indicators based on FADN data and additiona data collected through the FLINT project. For each type of farming (TF), that is to say each main production specialisation, farms are then clustered on the basis of their economic performance and following this their environmental and social performances are assessed. The analysis addresses the question of whether top performing farms from an economic perspective can also be high-performing farms from an environmental and social perspective. The characteristics of the top performers are also investigated.
Results suggest that economic sustainability and environmental sustainability are positively correlated for some farm types but not others, and this depends on the type of environmental indicator. By contrast, there are no tradeoffs between economic performance and (private) social performance. From a methodological perspective, the choice of the indicator, in particular the choice of the functional unit is crucial and may influence conclusions. In addition, some indicators never or almost never discriminate between clusters.
8
Tradeoffs between economic, social and environmental sustainability: The case of a selection of European farms1 INTRODUCTION
An increasing number of so-called “Grand Challenges” for food and agriculture have emerged in the first decade of the 21st century. These include population growth, climate change, energy, water supply and re-emerging diseases, all of which affect the potential of agriculture to provide a secure supply of safe and nutritious food for a rapidly growing population. Hence, the sustainable intensification of agricultural production is emerging as a major priority for policymakers and international development agencies. Sustainable intensification has been defined as producing more from the same area of land while reducing negative environmental impacts and increasing contributions to natural capital and the flow of environmental services.
Godfray et al. (2010) argue that a threefold challenge now faces the world: to match the rapidly changing demand for food from a larger and more affluent population to its supply; to do so in ways that are environmentally and socially sustainable; and to ensure that the world’s poorest people are no longer without basic food supplies. Bos et al. (2007) state that agricultural sustainability should be viewed from three alternative perspectives: people, planet and profit or social, environmental and economic.
A key question facing modern society is whether the agricultural sector can develop in a manner that is sustainable from an economic, environmental and social perspective. Sustainable intensification is at the heart of the new Common Agricultural Policy (CAP) of the European Union (EU) and the Greening of the CAP was a major theme of the last reform. But this prompts the question: does the drive for a greener agriculture impact on the CAP’s original objective as laid out in the Treaty of Rome “to provide a fair standard of living for farmers”? The purpose of this paper is to use farm level indicators of sustainability to examine the relationship between the different measures of sustainability and to address the specific question: can farms be economically and environmentally sustainable, as well as socially sustainable?
Sustainability indicators can help to monitor the economic, environmental and social consequences of structural changes in farming and to design policy packages to boost sustainable rural development (Reig-Martinez et al. 2011). A number of studies have developed farm level indicators measuring sustainability from this multidimensional perspective but at an individual Member States level; see Dillon et al. (2015) for a review. To date, there has been relatively little research conducted across EU Member States on the multidimensional nature of sustainability, mostly due to the lack of a representative dataset that is sufficiently broad to facilitate the application of economic, environmental and social indicators. The analysis here relies on the data collected via the FLINT project. These are farm level data for a sample of farms of the Farm Accountancy Data Network (FADN) in several EU countries (The Netherlands, Hungary, Finland, Poland, Spain, Ireland, Greece, France and Germany). The data include accountancy data from FADN (hereafter, ‘FADN data’), as well as additional data on the economic, environmental and social sustainability of farms (hereafter, ‘FLINT data’). These additional FLINT data were collected via face-to-face survey or merging of existing data, depending on the country. The FADN and FLINT data relate to the accountancy year 2015, except for France and Germany for which it is 2014. It should be made clear here that the sample used is not representative.
Here, the economic, environmental and social performance of farms is measured using farm level sustainability indicators. Farms are then clustered on the basis of their economic performance and following this their environmental and social performances are assessed. The analysis explores the correlation between economic, environmental and social performance and addresses the question of
Tradeoffs between economic, social and environmental sustainability: The case of a selection of
European farms
9
whether top performing farms from an economic perspective can also be high-performing farms from an environmental and social perspective.
The remainder of the report is structured as follows. In the second section the methodology and data are presented. In the third section results are presented, in two parts. The first part explains the tradeoffs between the three sustainability dimensions within each main production specialisation considered, and the second part presents the characteristics of the top performers in each production specialisation (TF). The conclusion in section four comprises a discussion of the main findings, methodological recommandations, and limits of the analysis.
10
Tradeoffs between economic, social and environmental sustainability: The case of a selection of European farms2 METHODOLOGY AND DATA
This section firstly explains the methodology used and then describes the data used.
2.1 Methodology
Economic sustainability is quantified using FADN data. These data consist of accountancy data, and are therefore particularly well suited to assessing farm profitability as well as productivity. The indicators of economic sustainability used here are defined in
Tradeoffs between economic, social and environmental sustainability: The case of a selection of
European farms
11
Table 1.
Environmental sustainability data are provided from the FLINT dataset. The following themes of environmental sustainability are considered here: greenhouse gas (GHG) emissions, nitrogen (N) balance, water consumption, ecological focus areas (EFA), grass-based rotation area, extensive grassland, UAA with nitrate risk, and UAA with erosion mitigation. The environmental indicators are further defined in
12
Tradeoffs between economic, social and environmental sustainability: The case of a selection of European farmsTable 2. Social sustainability data are also provided from the FLINT dataset. The social indicators selected here relate to farmers’ perceived quality of life, degree of stress, and social engagement. These indicators are further defined in Table 3.
The analysis is performed separately for specific farm systems as given by the FADN farm types, called the types of farming (TF): TF1-Farms specialised in field crops; TF2-Farms specialised in horticulture; TF3- Farms specialised in permanent crops; TF4-Farms specialised in grazing livestock; TF5-Farms specialised in granivores; TF6-Farms with mixed cropping; TF7-Farms with mixed livestock; TF8-Farms with mixed crops-livestock.
For each TF, farms are classified into clusters based on all of the economic sustainability indicators listed in
Tradeoffs between economic, social and environmental sustainability: The case of a selection of
European farms
13
Table 1. Clusters are created with hierarchical ascendant classification, where, in each TF, farms are partitioned in homogenous groups (the clusters). Farms in a cluster are close to each other in terms of the economic sustainability indicators, that is to say the Euclidian distance between the value of a farm and the value of another farm is minimised. By contrast, the distance between clusters, measured by Ward’s distance between clusters’ gravity centers, is maximised, that is to say clusters are as heterogenous as possible.
The optimal number of clusters could be obtained by statistical methods but we decided to cut off manually the number of clusters to three. This number facilitates variability between clusters more than if only two clusters were created, and at the same time enables an easy interpretation of the clusters which would be more difficult with a higher number of clusters; the small sample size of some TF also limits the number of clusters. However, in the case of TF3, 6 and 7, one of the three clusters contained only one or two farms. As it is not meaningful to have less than three farms in a cluster and because it is not possible to show the statistics for this cluster due to statistical confidentiality, the number of clusters was set to two. But again, in the case of TF7, the two-farm cluster appeared as a separate cluster. For this reason, we removed these two farms and performed the statistical analyses on the two remaining clusters. In summary, the number of clusters for the analysis is three for TF1 (field crops), TF4 (grazing livestock), TF5 (granivores) and TF8 (mixed crops-livestock); and the number of clusters is two for TF2 (horticulture), TF3 (permanent crops), TF6 (mixed cropping) and TF7 (mixed livestock).
Following the creation of clusters, environmental and social sustainability are compared across clusters in each TF, based on the indicators of
14
Tradeoffs between economic, social and environmental sustainability: The case of a selection of European farmsTable 2 and Table 3. Tests of equality of means of proportions are performed. Finally, the structural characteristics of each cluster are investigated (size, use of external production factors, etc) also with tests of equality of means or proportions.
Tradeoffs between economic, social and environmental sustainability: The case of a selection of
European farms
15
Table 1: Definition of the indicators of economic sustainability used from the FADN data
Indicator Definition Unit Used in cluster
creation for:
FADN code
Output per ha Total farm output in value related to utilised agricultural area (UAA)
Euros per hectare (ha)
Crop TF only SE131 / SE025 Output per LU Total farm output in value related to
the number of livestock units (LU)
Euros per LU Livestock TF only
SE131 / SE080 Output per capital Total farm output in value related to
total assets in value
None All TF SE131 /
SE436 Output per AWU Total farm output in value related to
total farm labour
Euros per annual working unit (AWU)
All TF SE131 /
SE010 Operational costs
per output
Operational costs on the farm related to total farm output
None All TF SE281 /
SE131 Farm NVA per ha Farm net value added (NVA) related
to UAA
Euros per hectare (ha)
Crop TF only SE415 / SE025 Farm NVA per LU Farm net value added related to the
number of LU
Euros per LU Livestock TF only
SE415 / SE080 Farm NVA per
capital
Farm net value added related to total assets in value
None All TF SE415 /
SE436 Farm NVA per
AWU
Farm net value added related to total farm labour
Euros per annual working unit (AWU)
All TF SE415 /
SE010 Family farm
income per FWU
Farm income related to family labour Euros per family working unit (FWU)
All TF SE430
Note: Crop TF are TF1 (field crops), TF2 (horticulture), TF3 (permanent crops), TF6 (mixed cropping) and TF8 (mixed
crops-livestock). Livestock TF are TF4 (grazing livestock), TF5 (granivores) and TF7 (mixed livestock).
16
Tradeoffs between economic, social and environmental sustainability: The case of a selection of European farmsTable 2: Definition of the indicators of environmental sustainability used from the FLINT data
Indicator Definition Unit FLINT code
GHG emissions per ha Quantity of greenhouse gases (GHG) emitted by farms measured at farm level per hectare (ha) of utilised agricultural area (UAA)
tonnes CO2 equivalent (t eq CO2) per ha E_14_1 / SE025 GHG emissions per LU
Quantity of GHG emitted by farms measured at farm level per livestock unit (LU)
t eq CO2 per
LU
E_14_1 / SE080
GHG emissions per Euro of output
Quantity of GHG emitted by farms measured at farm level per Euro of output
t eq CO2 per
Euro
E_14_1 / SE131
N balance per ha Farm gate nitrogen (N) balance (= N imported on the farm – N exported from the farm) per ha of UAA
kg of N per ha E_5_1 / SE025
N balance per LU Farm gate N balance per LU kg of N per LU E_5_1 / SE080
N balance per Euro of output
Farm gate N balance per Euro of output kg of N per
Euro
E_5_1 / SE131
Water consumption per ha
Water consumption on the farm, estimated or measured by a water meter, per ha of UAA
cubic meter per ha
water / SE025
Water consumption per LU
Water consumption on the farm, estimated or measured by a water meter, per LU
cubic meter per LU
water / SE080
Water consumption per Euro of output
Water consumption on the farm, estimated or measured by a water meter, per Euro of output
cubic meter per Euro
water / SE131
Share of EFA Share of ecological focus areas (EFA), related to total farm area. EFA include fallow land, terraces, landscape features, buffer strips, area of agro-forestry, strips of eligible area along forest, area with short rotation coppices, afforested areas, areas with catch crops or green cover, areas with nitrogen-fixing crops. % EFA * 100 / (SE025 + SE074 + SE075) Share of grass-based rotation area
Area for use of a grass-based crop as part of the arable system/crop rotation, related to UAA
% Z5_SO_5020_A_
7 / SE025 Share of extensive
grassland
Permanent grassland that is extensively managed (> 50 kg N fertiliser per ha per annum), related to total permanent grassland
% E_1_2
Share of UAA with nitrate risk
Area with nitrate risk, related to UAA % E_10_4
Share of UAA with erosion mitigation
Area with erosion mitigation, related to UAA % E_11_8
Note: ¤ EFA = (Z5_GR_1030_A + Z5_GR_1040_A + Z5_GR_1050_A + Z5_GR_1060_A + Z5_GR_1070_A + Z5_GR_1080_A
+ Z5_GR_1090_A + Z5_GR_1100_A + Z5_GR_1110_A + Z5_GR_1120_A) / 100
¤ arable area = (I_A_10110_TA + I_A_10120_TA + I_A_10130_TA + I_A_10140_TA + I_A_10150_TA + I_A_10160_TA + I_A_10170_TA + I_A_10190_TA + I_A_10210_TA + I_A_10220_TA + I_A_10290_TA + I_a_10300_TA + I_A_10400_TA + I_A_10500_TA + I_A_10601_TA + I_A_10602_TA + I_A_10603_TA + I_A_10604_TA + I_A_10605_TA + I_A_10606_TA + I_A_10607_TA + I_A_10608_TA + I_A_10609_TA + I_A_10610_TA + I_A_10611_TA + I_A_10612_TA + I_A_10613_TA + I_A_10690_TA + I_A_10731_TA + I_A_10732_TA + I_A_10733_TA + I_A_10734_TA + I_A_10735_TA + I_A_10736_TA + I_A_10737_TA + I_A_10738_TA + I_A_10739_TA + I_A_10790_TA + I_A_10810_TA + I_A_10910_TA + I_A_10921_TA + I_A_10922_TA + I_A_10923_TA + I_A_11000_TA + I_A_11100_TA + fallow)*100 where fallow = SE074 - I_A_30300_TA*100
¤ water = Z10_WU_2000_WM_1 + Z10_WU_2000_CE_1 + Z10_WU_2000_WM_2 + Z10_WU_2000_CE_2 + Z10_WU_2000_WM_3 + Z10_WU_2000_CE_3
Tradeoffs between economic, social and environmental sustainability: The case of a selection of
European farms
17
Table 3: Definition of the indicators of social sustainability used from the FLINT data
Indicator Definition Unit FLINT code
Quality of life Farmer perceived satisfaction of their quality of life
Scale from 0 (very unsatisfied) to 10 (very satisfied)
S_6_4
Stress Farmer perceived stress in their job on a typical day
Scale from 0 (free of stress) to 10 (very stressful)
S_6_6
Social
engagement The farmer is involved in at least one association (e.g. farmer’s union, professional organisation, other farmers group,
environmental association, civil association, local government)
Yes=1 No=0
S_4_1
18
Tradeoffs between economic, social and environmental sustainability: The case of a selection of European farms2.2 Data
After cleaning the database for aberrant and outlier data, the total sample used here contains 1,090 farms. Table 4 lists the TF considered and the number of farms in each TF. Grazing livestock farms were the most numerous, followed by field crop farms and permanent crop farms. The smallest sub-samples were for horticultural farms, mixed cropping farms and mixed livestock farms.
Table 4: Number of farms per type of farming (TF) TF1 – Field crops TF2 – Horti-culture TF3 – Permanent crops TF4 – Grazing livestock TF5 – Grani-vores TF6 – Mixed cropping TF7 – Mixed livestock TF8 – Mixed crops-livestock
Total
255
35
165
409
82
21
15
108
Source: the authors, based on FADN and FLINT data
Tradeoffs between economic, social and environmental sustainability: The case of a selection of
European farms
19
Table 5. On average, horticulture farms are among the smallest farms in terms of UAA but they use the most labour and capital, although the highest average value of capital is found for field crop farms when it is related to labour. A farm is considered to be producing under label if it produces under an organic certified label, or under an EU public quality label or under another collective quality label. The highest share of farms producing under label is found in the permanent crop sample.
20
Tradeoffs between economic, social and environmental sustainability: The case of a selection of European farmsTable 6 shows the descriptive statistics of the sample regarding the sustainability indicators. In terms of economic sustainability, in general farms specialised in horticulture perform better than other farms, while mixed livestock farms and mixed crops-livestock farms are the worst performers. As regards the environmental indicators, horticulture farms have the lowest GHG emitted per Euro of output, while livestock farms have the highest. Horticulture farms also perform best in terms of N balance per Euro of output, and the poorest performers are mixed crops-livestock farms. Field crop farming performs best with respect to the share of EFA in total farm area, but do worst with respect to water consumption.
Tradeoffs between economic, social and environmental sustainability: The case of a selection of
European farms
21
Table 5: Average structural characteristics of the farms for the whole sample per type of farming (TF)
TF1 – Field crops TF2 – Horti-culture TF3 – Permanent crops TF4 – Grazing livestock TF5 – Grani-vores TF6 – Mixed cropping TF7 – Mixed livestock TF8 – Mixed crops-livestock
UAA (ha) (SE025) 160(255) 24(35) 21(165) 74(409) 28(82) 123(21) 71(15) 173(108)
Number of LU (SE080) NC NC NC 100(409) 464(82) NC 126(15) 115(108) Labour (AWU) (SE010) 3.13(255) 8.43(35) 2.71(165) 1.95(408) 2.42(81) 3.64(21) 2.35(15) 3.76(108) Capital (Euros) (SE436) 1111268 (255) 2011834 (35) 466851 (165) 1025139 (409) 1175509 (82) 1075608 (21) 484072 (15) 817110 (108) Capital to labour (Euros per AWU) (SE436 / SE010) 683771 (255) 487751 (35) 205785 (165) 556531 (408) 545093 (81) 451000 (21) 210271 (15) 264991 (108) Share of rented land in UAA (%) (SE030*100/SE025) 19(255) 58(35) 30(165) 11(408) 19(81) 42(21) 6(15) 16(108) Share of hired labour in total labour (%) (SE020*100/SE010) 60(255) 28(35) 36(165) 49(409) 38(65) 61(21) 50(15) 51(108) Share of crop output in total output (%) (SE135*100/SE131) 90(255) 92(35) 94(165) 12(409) 15(80) 90(21) 18(15) 50(108) Share of livestock output in total output (%) (SE206*100/SE131) 3(255) 0(35) 3(165) 85(409) 81(80) 3(21) 75(15) 46(108) Total subsidies – excluding investments (Euros) (SE605) 22208(255) 2748(35) 3714(165) 25580(409) 16811(82) 20754(21) 8059(15) 46002(108) Produces under label (dummy EI_2_1 = 1 if yes) 0.91(81) 1(8) 1(95) .98(189) 1(23) 1(9) 1(5) 1(26) Is non-organic (dummy A_CL_140_C = 1 if yes) 0.95(255) 0.89(35) 0.81(165) 0.9(409) 0.96(82) 0.81(21) .93(15) 0.94(108)
Not in LFA (dummy
A_CL_160_C = 1) 0.4(255) 0.94(35) 0.49(165) 0.19(409) 0.6(82) 0.43(21) 0.07(15) 0.23(108)
Note: The number of observations is given between brackets. ‘NC’ indicates not computed. Source: the authors, based on FADN and FLINT data
22
Tradeoffs between economic, social and environmental sustainability: The case of a selection of European farmsTable 6: Average indicators of economic, environmental and social sustainability for the whole sample
per type of farming (TF)
TF1 – Field crops TF2 – Horti-culture TF3 – Permanent crops TF4 – Grazing livestock TF5 – Grani-vores TF6 – Mixed cropping TF7 – Mixed livestock TF8 – Mixed crops-livestock Economic indicators Output per ha (Euros) 1859(255)284304(35) 8007(165) 4023(409) NC 3121(21) 2075(15) 1420(108) Output per LU (Euros) NC NC NC 1887(409) 1066(80) NC 1352(15) 2027(107) Output per capital 0.37(255) 0.88(35) 0.4(165) 0.27(409) 0.44(80) 0.27(21) 0.26(15) 0.29(108)
Output per AWU
(Euros) 98281(255)157296(35)43092(165)94693(408)192213(79) 92656(21) 53318(15) 60906(108) Operational costs
to output 0.38(254) 0.26(35) 0.12(165) 0.48(409) 0.67(80) 0.27(21) 0.47(15) 0.51(108) Farm NVA per ha
(Euros) 468(255)122478(35) 4447(165) 1102(409) NC -1754(21) 349(15) 238(108) Farm NVA per LU
(Euros) NC NC NC 529(409) 165(82) NC 239(15) 376(107) Farm NVA per
capital (Euros) 0.07(255) 0.37(35) 0.24(165) 0.07(409) 0.06(82) 0.05(21) 0.03(15) 0.04(108) Farm NVA per
AWU (Euros) 24173(255) 67167(35)23819(165)24125(408) 16392(81) 33641(21) 5214(15) 8905(108) Family farm
income per FWU (Euros) 12306(255)163797(35)35783(165)17134(409) 7479(82) 14051(21) 1423(15) 4178(108) Environmental indicators GHG emissions per ha (t eq CO2) 0.098(153) 0.051(33) 0.121(101) 8.364(267) NC 0.077(15) 4.607(9) 2.123(70) GHG emissions per LU (t eq CO2) NC NC NC 4.518(267) 2.13(49) NC 3.02(9) 2.815(69) GHG emissions per Euro of output (t eq CO2) 0.11(153) 0.001(33) 0.049(101) 2.99(267) 2.268(49) 0.101(15) 2.357(9) 1.554(70) N balance per ha (kg N) 5.3(151) 332.7(33) 10.9(101) 8.4(266) NC 6.3(14) 6.5(9) 9.9(71) N balance per LU (kg N) NC NC NC 4(266) 4(49) NC 6.5(9) 8.70(70) N balance per Euro of output (kg N) 3.2(151) 1.5(33) 3.0(101) 2.8(266) 4.0(49) 2.0(14) 3.9(9) 6.10(71) Water consumption per ha (cubic meters) 954(212) 3712(33) 894(104) 69(258) NC 595(18) 39(13) 45(92) Water consumption per LU (cubic meters) NC NC NC 36(258) 11(75) NC 39(13) 38(92) Water consumption per 656(212) 13(33) 206(104) 20(258) 20(73) 333(18) 30(13) 28.94(92)
Tradeoffs between economic, social and environmental sustainability: The case of a selection of European farms
23
Euro of output (cubic meters) Share of EFA (%) 12(255) 3(35) 6(165) 5(409) NC 4(21) 8(15) 8(108) Share of grass-based rotation area (%) 17(32) 35(4) 25(8) 38(151) NC Insuff. obs. 12(8) 19(27) Share of extensive grassland (%) 25(219) 40(10) 7(105) 49(361) NC 28(15) 33(15) 49(95) Share of UAA withnitrate risk (%) 38(255) 33(35) 38(165) 25(409) NC 35(21) 28(15) 31(108) Share of UAA with
erosion mitigation (%) 53(48) Insuff. obs. 67(51) 52(61) NC 100(2) 83(3) 67(26) Social indicators Quality of life (scale 0-10) 7.38(248) 8.16(25) 6.98(165) 6.79(398) 6.81(80) 7.52(21) 5.60(15) 6.58(107) Stress (scale 0-10) 5.86(253) 4.41(34) 6.33(164) 5.71(398) 6.14(81) 5.5(20) 5.60(15) 6.19(107) Social engagement (0 or 1) 0.75(255) 0.74(35) 0.70(165) 0.78(409) 0.70(82) 0.71(21) 0.53(15) 0.64(108)
Note: The number of observations is given between brackets. ‘NC’ indicates not computed as it would not be
meaningful. ‘Insuff. obs.’ indicates insufficient observations for statistical confidentiality reasons, that is to say less than three valid observations. The economic performance indicators related to UAA in ha have not been used to create the clusters in TF4, TF5 and TF6, but these indicators are nonetheless indicated in the table for information for TF4 (grazing livestock farms) and TF6 (mixed livestock farms), as these farms also rely on UAA (contrary to granivores farms-TF5). Similarly, the economic performance indicators related to the number of LU have not been used to create the clusters in TF8 (mixed crops-livestock farms), but they are nonetheless indicated in the table for information, as these farms have a non-negligible number of LU.
24
Tradeoffs between economic, social and environmental sustainability: The case of a selection of European farms3 RESULTS
3.1 Tradeoffs between economic, environmental
and social sustainability
As explained above, for each TF, clusters have been created on the basis of all the economic indicators listed in
Tradeoffs between economic, social and environmental sustainability: The case of a selection of
European farms
25
Table 1, and then environental and social sustainability is compared across clusters. For each TF, Tables 7 to 14 display the profiles of the clusters as regard the economic indicators. The economic indicators are shown in the first part of the tables. For all TF, when looking at the indicators which are significantly different between clusters, in general average economic performance increases from cluster 1 to cluster 3 (on average, cluster 1 has the lowest economic performance, while cluster 3 the highest) or from cluster 1 to cluster 2 in cases where there are only two clusters (although it is less clear for the granivores sub-sample TF5 and the mixed livestock sub-sample TF7).
26
Tradeoffs between economic, social and environmental sustainability: The case of a selection of European farmsTable 7 shows for field crop farms (TF1) that the best-performing cluster in terms of economic performance (cluster 3) is also the best-performing one (or second-best performing one in one case) as regards all environmental indicators for which the test of equality is significant: GHG per Euro of output, N balance per Euro of output, water consumption per Euro of output, share of area with nitrate risk. However, this cluster has the lowest portion of total farm area under EFA, suggesting that biodiversity is neglected. There is no significant difference between the other indicators across clusters. Table 8 shows that for horticulture farms (TF2), the economically better performing cluster (cluster 2, except for operational costs per output) has lower environmental performance for all indicators for which there is a significant difference in means, namely: GHG per ha, N balance per ha, water consumption per ha and share of EFA. For permanent crop farms (TF3) (Table 9), cluster 2 which has the highest economic performance on average, has the highest environmental performance for all indicators for which the test is significant: GHG per ha and Euro of output, N balance per ha, water consumption per ha and Euro of output, and share of EFA. Mixed cropping farms (TF6) (Table 12) that are highly performing in economic terms (cluster 2), are better performing only in terms of N balance per Euro of output; the other environmental indicators are not significantly different between the two clusters. It should be noted that in this sub-sample, one cluster has only a few number of farms (4) which could explain the lack of statistical differences.
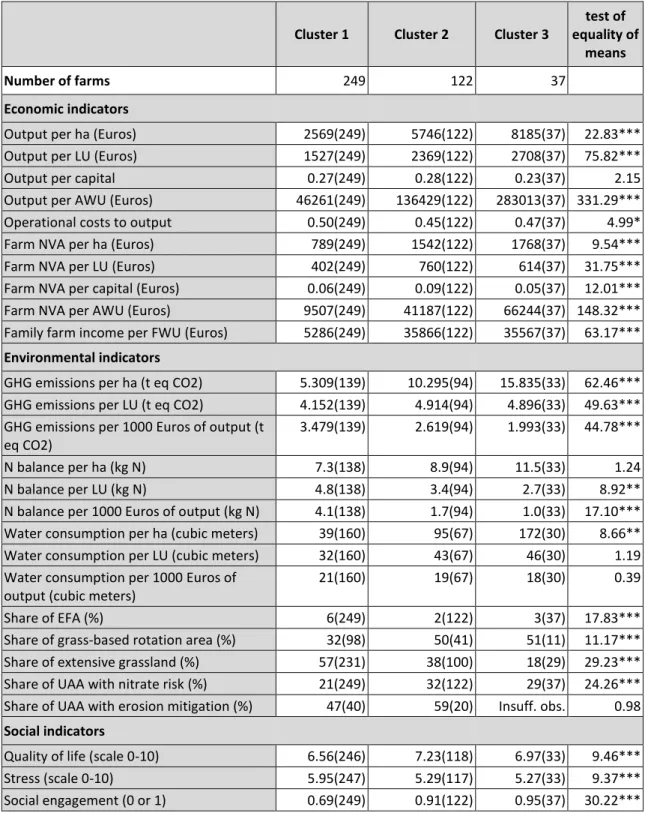
In summary, regarding crop TFs, the cluster that is best performing in economic terms is better or equally performing in environmental terms, except for horticulture TF for which the reverse is true. As for the livestock TF, as shown by Table 10 for grazing livestock (TF4), cluster 3 is the best performing cluster economically along all indicators, except for operational costs to output, farm NVA per LU and family farm income per FWU for which the performance of this cluster is close to the highest one (in cluster 2), and except for farm NVA per capital for which it has the lowest performance. As regards the environmental indicators that are significantly different across clusters, cluster 3 is the worst (or second worst) environmental performer in terms of GHG emissions per ha and LU, water consumption per ha, share of EFA, share of extensive grassland, and share of UAA with nitrate risk. By contrast, cluster 3 performs the best in terms of N balance (related to any size unit) and share of grass-based rotation area. Table 11 for granivores (TF5) is not clear-cut in terms of economic performance. Cluster 3 has the highest average economic performance per AWU and FWU, as well as in terms of output per ha, but the worst in terms of operational costs to output and NVA per LU. Regarding environmental performance, cluster 3 performs best in terms of water consumption per LU and Euro of output, share of UAA with nitrate risk; it performs worst in terms of GHG per ha, water per ha and share of EFA; the other indicators are not significantly different. In the mixed livestock sub-sample (TF7) (Table 13), cluster 2 is better performing only in terms of output per capital and AWU (the other economic indicators are not significantly different between the two clusters). No environmental indicator is significantly different across clusters, again maybe due to the small number of farms within clusters.
The results for the mixed crops-livestock farms (TF8) (Table 14) are very clear: the increase in economic performance (from cluster 1 to cluster 3) goes in parallel with an increase in environmental performance in terms of GHG per Euro of output, N balance per Euro of output, water per Euro of output and share of UAA with nitrate risk. The rest of the indicators are not significantly different across clusters.
The last part of Tables 7 to 14 show the social performance of farms. For field crop farms (TF1) (Table 7), an increase in economic performance (from cluster 1 to cluster 3) goes hand in hand with an increase in social performance (i.e. increase in average quality of life perception, decrease in average stress perception, and more farmers socially engaged). The same conclusion can be drawn for grazing livestock farms (TF4) except that the most performing cluster (cluster 3) is in second position as regard quality of life. Simularly, for mixed crops-livestock farms (TF8) the best performing cluster in terms of economic performance is also the best performing in terms of quality of life perception and social engagement (no statistical difference in terms of stress). For two TF, one social indicator is highest for the best economically performing cluster (highest quality of life for TF5-granivores; more socially engaged farmers for TF7-mixed livestock), the other indicators being not significantly different. Finally, for three TF (TF2-horticulture, TF3-permanent farms, TF6 mixed cropping), there is no difference in any of the three social indicators.
Tradeoffs between economic, social and environmental sustainability: The case of a selection of
European farms
27
Table 7: Average indicators of economic, environmental and social sustainability of the clusters of type
of farming 1 - Field crops
Cluster 1 Cluster 2 Cluster 3
test of equality of means
Number of farms 129 115 10
Economic indicators
Output per ha (Euros) 1238(129) 2290(115) 5004(10) 31.46***
Output per LU (Euros) NC NC NC NC
Output per capital 0.33(129) 0.43(115) 0.15(10) 20.75***
Output per AWU (Euros) 35380(129) 129060(115) 561337(10) 162.64***
Operational costs to output 0.40(129) 0.38(115) 0.23(10) 22.22***
Farm NVA per ha (Euros) 256(129) 556(115) 2206(10) 20.67***
Farm NVA per LU (Euros) NC NC NC NC
Farm NVA per capital (Euros) 0.06(129) 0.07(115) 0.07(10) 0.39
Farm NVA per AWU (Euros) 7523(129) 22488(115) 259513(10) 26.49***
Family farm income per FWU (Euros) 3601(129) 3786(115) 223794(10) 14.07***
Environmental indicators
GHG emissions per ha (t eq CO2) 0.129(86) 0.058(56) 0.066(10) 2.98
GHG emissions per LU (t eq CO2) NC NC NC NC
GHG emissions per 1000 Euros of output (t eq CO2)
0.164(86) 0.045(56) 0.014(10) 13.35***
N balance per ha (kg N) 5.5(86) 4.9(54) 6.1(10) 0.49
N balance per LU (kg N) NC NC NC NC
N balance per 1000 Euros of output (kg N) 4.4(86) 1.6(54) 1.8(10) 16.21*** Water consumption per ha (cubic meters) 1354(113) 541(90) 73(8) 35.06***
Water consumption per LU (cubic meters) NC NC NC NC
Water consumption per 1000 Euros of output (cubic meters)
833(113) 499(90) 14(8) 35.68***
Share of EFA (%) 10(129) 15(115) 5(10) 11.11***
Share of grass-based rotation area (%) 24(12) 13(19) Insuff. obs. 1.18
Share of extensive grassland (%) 30(104) 20(105) 22(9) 3.25
Share of UAA with nitrate risk (%) 42(129) 35(115) 32(10) 10.22***
Share of UAA with erosion mitigation (%) 49(26) 58(22) Insuff. obs. 0.48
Social indicators
Quality of life (scale 0-10) 6.99(129) 7.79(108) 8.00(10) 12.14***
Stress (scale 0-10) 6.37(128) 5.36(114) 4.80(10) 12.59***
Social engagement (0 or 1) 0.60(129) 0.89(115) 0.90(10) 26.78***
Note: The number of observations is given between brackets. ‘NC’ indicates not computed as it would not be
meaningful. ‘Insuff. obs.’ indicates insufficient observations for statistical confidentiality reasons, that is to say less than three valid observations. Chi-square and significance are reported in the last column. *, **, *** indicate significance at 10, 5, 1% level respectively. The test of equality of means is computed to compare all three clusters together, except when there are insufficient observations in one cluster; in this case the test is computed to compare the two remaining clusters.
28
Tradeoffs between economic, social and environmental sustainability: The case of a selection of European farmsTable 8: Average indicators of economic, environmental and social sustainability of the clusters of type
of farming 2 – Horticulture
Cluster 1 Cluster 2 Cluster 3
test of equality of means Number of farms 13 22 Economic indicators
Output per ha (Euros) 17947(13) 441696(22) 53.80***
Output per LU (Euros) NC NC NC
Output per capital 0.30(13) 1.23(22) 3.91**
Output per AWU (Euros) 175013(13) 146827(22) 0.48
Operational costs to output 0.22(13) 0.28(22) 6.27**
Farm NVA per ha (Euros) 7204(13) 190594(22) 43.16***
Farm NVA per LU (Euros) NC NC NC
Farm NVA per capital (Euros) 0.12(13) 0.51(22) 4.46**
Farm NVA per AWU (Euros) 76557(13) 61618(22) 0.62
Family farm income per FWU (Euros) 106418(13) 197703(22) 2.49
Environmental indicators
GHG emissions per ha (t eq CO2) 0.019(12) 0.069(21) 9.98***
GHG emissions per LU (t eq CO2) NC NC NC
GHG emissions per 1000 Euros of output (t eq CO2)
0.002(12) 0.00015(21) 1.98
N balance per ha (kg N) 25.8(12) 508.0(21) 9.19***
N balance per LU (kg N) NC NC NC
N balance per 1000 Euros of output (kg N) 2.1(12) 1.1(21) 1.46
Water consumption per ha (cubic meters) 316(11) 5410(22) 19.52***
Water consumption per LU (cubic meters) NC NC NC
Water consumption per 1000 Euros of output (cubic meters)
14(11) 12(22) 0.20
Share of EFA (%) 8(13) 0(22) 3.63*
Share of grass-based rotation area (%) 35(4) Insuff. obs.
Share of extensive grassland (%) 25(8) 100(2)
Share of UAA with nitrate risk (%) 42(13) 28(22) 1.47
Share of UAA with erosion mitigation (%) Insuff. obs. Insuff. obs.
Social indicators
Quality of life (scale 0-10) 8.10(10) 8.20(15) 0.07
Stress (scale 0-10) 4.62(13) 4.29(21) 0.19
Social engagement (0 or 1) 0.77(13) 0.73(22) 0.08
Note: The number of observations is given between brackets. ‘NC’ indicates not computed as it would not be
meaningful. ‘Insuff. obs.’ indicates insufficient observations for statistical confidentiality reasons, that is to say less than three valid observations. Chi-square and significance are reported in the last column. *, **, *** indicate significance at 10, 5, 1% level respectively. When there are insufficient observations in one cluster, the test is not computed.
Tradeoffs between economic, social and environmental sustainability: The case of a selection of
European farms
29
Table 9: Average indicators of economic, environmental and social sustainability of the clusters of type
of farming 3 - Permanent crops
Cluster 1 Cluster 2 Cluster 3
test of equality of means Number of farms 145 20 Economic indicators
Output per ha (Euros) 6206(145) 21067(20) 7.36***
Output per LU (Euros) NC NC NC
Output per capital 0.39(145) 0.44(20) 0.34
Output per AWU (Euros) 32401(145) 120605(20) 48.3***
Operational costs to output 0.13(145) 0.08(20) 13.87***
Farm NVA per ha (Euros) 3307(145) 12709(20) 6.09**
Farm NVA per LU (Euros) NC NC NC
Farm NVA per capital (Euros) 0.24(145) 0.26(20) 0.09
Farm NVA per AWU (Euros) 17398(145) 70366(20) 46.08***
Family farm income per FWU (Euros) 18355(145) 162141(20) 5.54**
Environmental indicators
GHG emissions per ha (t eq CO2) 0.125(98) 0.001(3) 19.22***
GHG emissions per LU (t eq CO2) NC NC NC
GHG emissions per 1000 Euros of output (t eq CO2)
0.050(98) 0.001(3) 14.90***
N balance per ha (kg N) 11.2(98) 2.1(3) 5.38**
N balance per LU (kg N) NC NC NC
N balance per 1000 Euros of output (kg N) 3.1(98) 1.1(3) 2.43
Water consumption per ha (cubic meters) 1024(89) 125(15) 7.91***
Water consumption per LU (cubic meters) NC NC NC
Water consumption per 1000 Euros of output (cubic meters)
239(89) 10(15) 11.67***
Share of EFA (%) 5(145) 12(20) 6.14**
Share of grass-based rotation area (%) 27(7) Insuff. obs.
Share of extensive grassland (%) 7(86) 5(19) 0.23
Share of UAA with nitrate risk (%) 38(145) 40(20) 0.45
Share of UAA with erosion mitigation (%) 65(45) 85(6) 1.72
Social indicators
Quality of life (scale 0-10) 6.96(145) 7.15(20) 0.22
Stress (scale 0-10) 6.38(144) 5.95(20) 0.9
Social engagement (0 or 1) 0.69(145) 0.75(20) 0.3
The number of observations is given between brackets. ‘NC’ indicates not computed as it would not be meaningful. ‘Insuff. obs.’ indicates insufficient observations for statistical confidentiality reasons, that is to say less than three valid observations. Chi-sqwuare and significance are reported in the last column. *, **, *** indicate significance at 10, 5, 1% level respectively. The test of equality of means is computed to compare all three clusters together, except when there are insufficient observations in one cluster, the test is not computed.
30
Tradeoffs between economic, social and environmental sustainability: The case of a selection of European farmsTable 10: Average indicators of economic, environmental and social sustainability of the clusters of type
of farming 4 - Grazing livestock
Cluster 1 Cluster 2 Cluster 3
test of equality of
means
Number of farms 249 122 37
Economic indicators
Output per ha (Euros) 2569(249) 5746(122) 8185(37) 22.83***
Output per LU (Euros) 1527(249) 2369(122) 2708(37) 75.82***
Output per capital 0.27(249) 0.28(122) 0.23(37) 2.15
Output per AWU (Euros) 46261(249) 136429(122) 283013(37) 331.29***
Operational costs to output 0.50(249) 0.45(122) 0.47(37) 4.99*
Farm NVA per ha (Euros) 789(249) 1542(122) 1768(37) 9.54***
Farm NVA per LU (Euros) 402(249) 760(122) 614(37) 31.75***
Farm NVA per capital (Euros) 0.06(249) 0.09(122) 0.05(37) 12.01***
Farm NVA per AWU (Euros) 9507(249) 41187(122) 66244(37) 148.32***
Family farm income per FWU (Euros) 5286(249) 35866(122) 35567(37) 63.17***
Environmental indicators
GHG emissions per ha (t eq CO2) 5.309(139) 10.295(94) 15.835(33) 62.46***
GHG emissions per LU (t eq CO2) 4.152(139) 4.914(94) 4.896(33) 49.63***
GHG emissions per 1000 Euros of output (t eq CO2)
3.479(139) 2.619(94) 1.993(33) 44.78***
N balance per ha (kg N) 7.3(138) 8.9(94) 11.5(33) 1.24
N balance per LU (kg N) 4.8(138) 3.4(94) 2.7(33) 8.92**
N balance per 1000 Euros of output (kg N) 4.1(138) 1.7(94) 1.0(33) 17.10***
Water consumption per ha (cubic meters) 39(160) 95(67) 172(30) 8.66**
Water consumption per LU (cubic meters) 32(160) 43(67) 46(30) 1.19
Water consumption per 1000 Euros of output (cubic meters)
21(160) 19(67) 18(30) 0.39
Share of EFA (%) 6(249) 2(122) 3(37) 17.83***
Share of grass-based rotation area (%) 32(98) 50(41) 51(11) 11.17***
Share of extensive grassland (%) 57(231) 38(100) 18(29) 29.23***
Share of UAA with nitrate risk (%) 21(249) 32(122) 29(37) 24.26***
Share of UAA with erosion mitigation (%) 47(40) 59(20) Insuff. obs. 0.98
Social indicators
Quality of life (scale 0-10) 6.56(246) 7.23(118) 6.97(33) 9.46***
Stress (scale 0-10) 5.95(247) 5.29(117) 5.27(33) 9.37***
Social engagement (0 or 1) 0.69(249) 0.91(122) 0.95(37) 30.22***
Note: The number of observations is given between brackets. ‘Insuff. obs.’ indicates insufficient observations for
statistical confidentiality reasons, that is to say less than three valid observations. Chi-square and significance are reported in the last column. *, **, *** indicate significance at 10, 5, 1% level respectively. The test of equality of means is computed to compare all three clusters together, except when there are insufficient observations in one cluster; in this case the test is computed to compare the two remaining clusters. The economic performance indicators related to UAA in ha have not been used to create the clusters for this type of farming, but they are nonetheless indicated in the table for information, as these farms also rely on UAA (contrary to granivores farms for example).
Tradeoffs between economic, social and environmental sustainability: The case of a selection of
European farms
31
Table 11: Average indicators of economic, environmental and social sustainability of the clusters of type
of farming 5 – Granivores
Cluster 1 Cluster 2 Cluster 3
test of equality of means Number of farms 55 15 9 Economic indicators
Output per ha (Euros) 11611(44) 47322(12) 518923(6) 7.16**
Output per LU (Euros) 979(55) 1443(15) 1004(9) 6.58**
Output per capital 0.45(55) 0.39(15) 0.46(9) 2.77
Output per AWU (Euros) 69758(55) 310981(15) 742602(9) 58.9***
Operational costs to output 0.63(55) 0.75(15) 0.78(9) 23.00***
Farm NVA per ha (Euros) 3221(44) 472(12) 52867(6) 3.57
Farm NVA per LU (Euros) 195(55) 111(15) 59(9) 10.92***
Farm NVA per capital (Euros) 0.07(55) 0.02(15) 0.03(9) 7.45**
Farm NVA per AWU (Euros) 7748(55) 14808(15) 54240(9) 6.88**
Family farm income per FWU (Euros) 3243(55) -4128(15) 17766(9) 1.67
Environmental indicators
GHG emissions per ha (t eq CO2) 9.935(36) 64.595(8) 451.379(4) 8.44**
GHG emissions per LU (t eq CO2) 1.752(36) 3.523(8) 2.768(4) 4.66*
GHG emissions per 1000 Euros of output (t eq CO2)
2.157(36) 2.604(8) 2.491(4) 0.61
N balance per ha (kg N) 13.6(36) 517.8(9) 612.5(3) 4.32
N balance per LU (kg N) 3.1(36) 7(9) 6.3(3) 2.34
N balance per 1000 Euros of output (kg N) 2.9 (36) 7.9(9) 5.4(3) 2.91
Water consumption per ha (cubic meters) 142(40) 484(10) 1646(6) 8.14**
Water consumption per LU (cubic meters) 13(50) 9(13) 4(9) 12.41***
Water consumption per 1000 Euros of output (cubic meters)
26(50) 8(13) 4(9) 8.21**
Share of EFA (%) 6(44) 2(12) 0(6) 3.50**
Share of grass-based rotation area (%) 8(5) Insuff. obs. Insuff. obs.
Share of extensive grassland (%) 42(34) 50(9) 20(5) 1.57
Share of UAA with nitrate risk (%) 40(44) 19(12) 19(6) 13.15***
Share of UAA with erosion mitigation (%) 63(5) Insuff. Obs. Insuff. obs.
Social indicators
Quality of life (scale 0-10) 6.43(54) 7.36(14) 7.89(9) 12.98***
Stress (scale 0-10) 6.46(54) 5.67(15) 5.22(9) 3.14
Social engagement (0 or 1) 0.65(55) 0.80(15) 0.78(9) 1.50
Note: The number of observations is given between brackets. ‘Insuff. obs.’ indicates insufficient observations for
statistical confidentiality reasons, that is to say less than three valid observations. Chi-square and significance are reported in the last column. *, **, *** indicate significance at 10, 5, 1% level respectively. The test of equality of means is computed to compare all three clusters together. When there are insufficient observations in two clusters, the test is not computed.
32
Tradeoffs between economic, social and environmental sustainability: The case of a selection of European farmsTable 12: Average indicators of economic, environmental and social sustainability of the clusters of type
of farming 6 - Mixed cropping
Cluster 1 Cluster 2 Cluster 3
test of equality of means Number of farms 17 4 Economic indicators
Output per ha (Euros) 2758(17) 4664(4) 2.22
Output per LU (Euros) NC NC NC
Output per capital 0.28(17) 0.23(4) 0.63
Output per AWU (Euros) 45875(17) 291476(4) 8.62***
Operational costs to output 0.27(17) 0.29(4) 0.27
Farm NVA per ha (Euros) -2631(17) 1974(4) 1.74
Farm NVA per LU (Euros) NC NC NC
Farm NVA per capital (Euros) 0.04(17) 0.08(4) 0.17
Farm NVA per AWU (Euros) 14983(17) 112937(4) 7.81***
Family farm income per FWU (Euros) -1422(17) 79813(4) 8.76***
Environmental indicators
GHG emissions per ha (t eq CO2) 0.099(11) 0.018(4) 1.59
GHG emissions per LU (t eq CO2) NC NC NC
GHG emissions per 1000 Euros of output (t eq CO2)
0.136(11) 0.004(4) 2.04
N balance per ha (kg N) 8(10) 2(4) 1.57
N balance per LU (kg N) NC NC NC
N balance per 1000 Euros of output (kg N) 3(10) 0.4(4) 3.91**
Water consumption per ha (cubic meters) 648(15) 328(3) 0.32
Water consumption per LU (cubic meters) NC NC NC
Water consumption per 1000 Euros of output (cubic meters)
387(15) 57(3) 1.03
Share of EFA (%) 4(17) 6(4) 0.29
Share of grass-based rotation area (%) Insuff. obs. Insuff. obs.
Share of extensive grassland (%) 24(11) 40(4) 0.44
Share of UAA with nitrate risk (%) 36(17) 31(4) 0.29
Share of UAA with erosion mitigation (%) Insuff. obs. Insuff. obs.
Social indicators
Quality of life (scale 0-10) 7.41(17) 8.00(4) 0.50
Stress (scale 0-10) 5.81(16) 4.25(4) 1.83
Social engagement (0 or 1) 0.65(17) 1.00(4) 1.98
Note: The number of observations is given between brackets. ‘NC’ indicates not computed as it would not be
meaningful. ‘Insuff. obs.’ indicates insufficient observations for statistical confidentiality reasons, that is to say less than three valid observations. Chi-square and significance are reported in the last column. *, **, *** indicate significance at 10, 5, 1% level respectively. When there are insufficient observations in one cluster, the test is not computed.
Tradeoffs between economic, social and environmental sustainability: The case of a selection of
European farms
33
Table 13: Average indicators of economic and environmental sustainability of the clusters of type of
farming 7 - Mixed livestock
Cluster 1 Cluster 2 Cluster 3
test of equality of means Number of farms 7 6 Economic indicators
Output per ha (Euros) 1690(7) 2395(6) 0.84
Output per LU (Euros) 1464(7) 1272(6) 0.16
Output per capital 0.16(7) 0.39(6) 7.90***
Output per AWU (Euros) 17386(7) 59554(6) 15.62***
Operational costs to output 0.52(7) 0.38(6) 2.53
Farm NVA per ha (Euros) 274(7) 348(6) 0.09
Farm NVA per LU (Euros) 296(7) 178(6) 0.32
Farm NVA per capital (Euros) 0.02(7) 0.05(6) 0.77
Farm NVA per AWU (Euros) 2104(7) 5776(6) 0.98
Family farm income per FWU (Euros) 1578(7) 105(6) 0.12
Environmental indicators
GHG emissions per ha (t eq CO2) 3.687(7) Insuff. obs.
GHG emissions per LU (t eq CO2) 2.672(7) Insuff. obs.
GHG emissions per 1000 Euros of output (t eq CO2) 2.322(7) Insuff. obs.
N balance per ha (kg N) 7.5(7) Insuff. obs.
N balance per LU (kg N) 7.5(7) Insuff. obs.
N balance per 1000 Euros of output (kg N) 4.55(7) Insuff. obs.
Water consumption per ha (cubic meters) 40(7) 39(5) 0.00
Water consumption per LU (cubic meters) 57(7) 19(5) 0.82
Water consumption per 1000 Euros of output (cubic meters)
22.84(7) 17.31(5) 0.24
Share of EFA (%) 5(7) 14(6) 1.23
Share of grass-based rotation area (%) 10(4) 14(4) 0.19
Share of extensive grassland (%) 22(7) 42(6) 0.75
Share of UAA with nitrate risk (%) 33(7) 20(6) 2.2
Share of UAA with erosion mitigation (%) Insuff. obs. Insuff. obs.
Social indicators
Quality of life (scale 0-10) 4.86(7) 5.50(6) 0.22
Stress (scale 0-10) 5.29(7) 6.17(6) 0.57
Social engagement (0 or 1) 0.14(7) 0.83(6) 8.21**
Note: The number of observations is given between brackets. ‘NC’ indicates not computed as it would not be
meaningful. ‘Insuff. obs.’ indicates insufficient observations for statistical confidentiality reasons, that is to say less than three valid observations. Chi-square and significance are reported in the last column. *, **, *** indicate significance at 10, 5, 1% level respectively. When there are insufficient observations in one cluster, the test is not computed. The economic performance indicators related to UAA in ha have not been used to create the clusters for this type of farming, but they are nonetheless indicated in the table for information, as these farms also rely on UAA (contrary to granivores farms for example).
34
Tradeoffs between economic, social and environmental sustainability: The case of a selection of European farmsTable 14: Average indicators of economic, environmental and social sustainability of the clusters of type
of farming 8 - Mixed crops-livestock
Cluster 1 Cluster 3 Cluster 3
test of equality of means Number of farms 46 52 10 Economic indicators
Output per ha (Euros) 1133(46) 1368(52) 3006(10) 8.70**
Output per LU (Euros) NC NC NC NC
Output per capital 0.22(46) 0.32(52) 0.43(10) 12.49***
Output per AWU (Euros) 19897(46) 79993(52) 150291(10) 99.53***
Operational costs to output 0.56(46) 0.48(52) 0.39(10) 12.16***
Farm NVA per ha (Euros) 169(46) 144(52) 1048(10) 11.41***
Farm NVA per LU (Euros) NC NC NC NC
Farm NVA per capital (Euros) 0.03(46) 0.02(52) 0.16(10) 7.72**
Farm NVA per AWU (Euros) 3458(46) 5413(52) 52112(10) 20.24***
Family farm income per FWU (Euros) 2299(46) -8309(52) 77753(10) 15.13***
Environmental indicators
GHG emissions per ha (t eq CO2) 2.007(38) 1.861(25) 3.688(7) 1.99
GHG emissions per LU (t eq CO2) NC NC NC NC
GHG emissions per 1000 Euros of output (t eq CO2)
1.788(38) 1.285(25) 1.241(7) 8.24**
N balance per ha (kg N) 16.3(38) 2.2(26) 3.2(7) 3.04
N balance per LU (kg N) NC NC NC NC
N balance per 1000 Euros of output (kg N) 10(38) 2(26) 1(7) 8.05**
Water consumption per ha (cubic meters) 61(44) 31(41) 21(7) 0.86
Water consumption per LU (cubic meters) NC NC NC NC
Water consumption per 1000 Euros of output (cubic meters)
32(44) 29(41) 5(7) 6.56**
Share of EFA (%) 8(46) 9(52) 4(10) 2.57
Share of grass-based rotation area (%) 7(6) 23(18) 12(3) 4.42
Share of extensive grassland (%) 56(35) 47(50) 36(10) 2.12
Share of UAA with nitrate risk (%) 36(46) 28(52) 24(10) 6.30**
Share of UAA with erosion mitigation (%) 100(3) 64(21) Insuff. obs. 1.94
Social indicators
Quality of life (scale 0-10) 5.78(46) 7.06(52) 7.89(9) 26.33***
Stress (scale 0-10) 5.83(46) 6.54(52) 6(9) 1.96
Social engagement (0 or 1) 0.46(46) 0.73(52) 1.00(10) 14.19***
Note: The number of observations is given between brackets. ‘NC’ indicates not computed as it would not be
meaningful. ‘Insuff. obs.’ indicates insufficient observations for statistical confidentiality reasons, that is to say less than three valid observations. Chi-square and significance are reported in the last column. *, **, *** indicate significance at 10, 5, 1% level respectively. The test of equality of means is computed to compare all three clusters together, except when there are insufficient observations in one cluster; in this case the test is computed to compare the two remaining clusters. The economic performance indicators related to the number of LU have not been used to create the clusters in this TF, but they are nonetheless indicated in the table for information, as these farms have a non-negligible number of LU.
Tradeoffs between economic, social and environmental sustainability: The case of a selection of
European farms
35
3.2 Structural characteristics of the most
sustainable farm cluster in each farm type
Tables 15 to 22 display for each TF the structural characteristics of the clusters. For field crop farms (TF1), cluster 3 was shown above to be the top performer in terms of economic, environmental and social performance (except as regard the share of EFA). Table 15 shows that this cluster has on average a medium UAA but the lowest labour and the highest capital. Farms in this cluster use on average the least external labour and land, and have the lowest share of total output stemming from crops. Farms in this cluster also receive the least subsidies per farm on average. More farms are far less likely to be in Less Favoured Areas (LFA) compared to the other two clusters.