HAL Id: hal-01213887
https://hal.inria.fr/hal-01213887
Submitted on 11 Dec 2015
HAL is a multi-disciplinary open access
archive for the deposit and dissemination of
sci-entific research documents, whether they are
pub-lished or not. The documents may come from
teaching and research institutions in France or
abroad, or from public or private research centers.
L’archive ouverte pluridisciplinaire HAL, est
destinée au dépôt et à la diffusion de documents
scientifiques de niveau recherche, publiés ou non,
émanant des établissements d’enseignement et de
recherche français ou étrangers, des laboratoires
publics ou privés.
Crowd Art: Density and Flow Based Crowd Motion
Design
Kevin Jordao, Panayiotis Charalambous, Marc Christie, Julien Pettré,
Marie-Paule Cani
To cite this version:
Kevin Jordao, Panayiotis Charalambous, Marc Christie, Julien Pettré, Marie-Paule Cani. Crowd Art:
Density and Flow Based Crowd Motion Design. 8th ACM SIGGRAPH Conference on Motion in
Games, MIG ’15, Nov 2015, Paris, France. pp. 167-176, �10.1145/2822013.2822023�. �hal-01213887�
Crowd Art: Density and Flow Based Crowd Motion Design
Kevin Jordao1∗Panayiotis Charalambous1† Marc Christie2 Julien Pettr´e1 Marie-Paule Cani31Inria Rennes, France 2University of Rennes 1 & IRISA, France
3University of Grenoble-Alpes, CNRS Laboratory Jean Kuntzmann & Inria Rhˆone-Alpes, France
Figure 1: Our system can be used to populate a large city like environment such as the Wall Street area in New York with crowds of different density and direction constraints in minutes. Resulting crowd motion can then be played endlessly always satisfying the user’s intent.
Abstract
Artists, animation and game designers are in demand for solutions to easily populate large virtual environments with crowds that sat-isfy desired visual features. This paper presents a method to in-tuitively populate virtual environments by specifying two key fea-tures: localized density, being the amount of agents per unit of sur-face, and localized flow, being the direction in which agents move through a unit of surface. The technique we propose is also time-independant, meaning that whatever the time in the animation, the resulting crowd satisfies both features. To achieve this, our ap-proach relies on the Crowd Patches model. After discretizing the environment into regular patches and creating a graph that links these patches, an iterative optimization process computes the local changes to apply on each patch (increasing/reducing the number of agents in each patch, updating the directions of agents in the patch) in order to satisfy overall density and flow constraints. A specific stage is then introduced after each iteration to avoid the creation of local loops by using a global pathfinding process. As a result, the method has the capacity of generating large realistic crowds in minutes that endlessly satisfy both user specified densities and flow directions, and is robust to contradictory inputs. At last, to ease the design the method is implemented in an artist-driven tool through a painting interface.
CR Categories: Computer Graphics [I.3.7]: Three-Dimensional Graphics and Realism—Animation;
Keywords: crowd animation, crowd design, crowd patches
1
Introduction
Virtual crowds are important in a number of fields, such as civil engineering, architectural design, safety and entertainment. In the
∗e-mail@kevin.jordao@inria.fr
†e-mail@panayiotis.charalambous@inria.fr
latter, virtual characters efficiently replace crowds of extras to pop-ulate outdoor movie scenes or bring life to game scenes that now reach the size of entire cities. In such cases, ideally, game and 3D scene designers want crowd characters to follow sketches, guide-lines or scenarios, that result into a virtual population visually matching some expected features.
In related work, a number of crowd simulation techniques have been proposed to automatically compute human-like and collision-free animation trajectories. However, playing with the parameters of such simulators does not provide a direct control over the visual aspect of a crowd motion. Expertise and many trial-and-error itera-tions are therefore required to match the desired results. More direct control techniques have also been proposed through crowd manip-ulation tools such as using velocity fields, deforming trajectories, imitating example motions or locally guiding agents. Nevertheless, to our knowledge, no method empowers designers with the simul-taneous control of two key visual features: local crowd density and local flow direction. Furthermore, while the instantaneous control of density and flow seems to remain a challenge, there is also an interest in maintaining these visual features over time, i.e., animate the crowd so that both density and flow direction stay constant over time in spite of the characters’ motion.
To address these challenges, we propose a novel optimization process to compute crowd animation which takes as input user-specified levels of densities and flow directions, and generates a crowd animation that fulfills the specifications independently of time. Our representation relies on crowd patches [Yersin et al. 2009] which are pieces of repeated crowd animations that can be assembled to form large crowd animations obeying boundary con-straints.
Generating an assembly of patches in which patches locally match a user-defined level of density and flow direction while maintain-ing boundary constraints is addressed by proposmaintain-ing an optimization process that operates on the patch graph – a graph whose nodes are patches and edges are faces that connect patches together. Opti-mization is performed along patch parameters in the graph that are (i) the number of way-points at the boundaries of patches to ac-count for density, and (ii) the connections between possible entry end exit way-points to account for flow direction. The resulting an-imation progressively converges to match the expected constraints, by using the difference between the actual features and the expected constraints as a cost function. Another computational stage is how-ever necessary both to avoid unwanted behaviours such as
charac-ters walking in small loops, and to globally create flows that satisfy the user inputs. To this end, we first identify distant patches which satisfy the less the user inputs. A path-planning process is then proposed to compute paths in the patch graph linking such patches together. Along these paths, entry and exit points are created to construct a trajectory for characters.
Our contributions are the following:
• an optimization technique to compute crowd animations that satisfy different sizes under localized density and directional flow constraints;
• a process to avoid local loops in characters’ trajectories by computing paths linking unsatisfactory patches;
• an artist-driven tool for designing crowds. Designers can cate crowds very rapidly using an existing paint tool. User re-quirements are specified by combining image layers which specify dynamic and static density, direction and obstacles. Our paper is organized as follows. Section 2 overviews the avail-able methods to simulate and control a crowd animation. Section 3 provides a global description of our solution and of its main compo-nents. Our optimization technique to compute patches with desired density and flow direction is detailed in Section 4. Section 5 intro-duces a simple interface for users to sketch those inputs. Finally, results are discussed in Section 6 followed by limitations and con-clusions (Sections 7 and 8).
2
Related Work
Crowd simulation is the process by which the motion of many char-acters is computed in the purpose of, for example, populating and animating virtual scenes. Broadly speaking, simulation methods can be divided into macroscopic ones that consider the crowd as an entity [Treuille et al. 2006; Narain et al. 2009] and microscopic ones that handle individual characters to capture more heteroge-neous behavior, as pioneered by Reynolds’ [1987]. Additionally, crowd models can either be user defined or indirectly extracted from data of reference crowds [Lerner et al. 2007; Ju et al. 2010; Char-alambous and Chrysanthou 2014]. For animation purposes, one of the most important challenges in any crowd simulation is to be able to control the simulation outcome such as the resulting crowd den-sity and flow direction. Depending on the approach, this can be achieved with varying degrees of success.
Macroscopic approaches tend to allow for easier control of flow direction; Chenney [2004] propose tiling flow fields to guide the motion of crowds, Kapadia et al. [2011] annotate complex parts of the environment, Patil et al. [2011] propose using artist defined navigation fields, whereas Courty and Corpetti [2007] propose a data driven method to extract flow fields from videos. Treuille et al. [2006] suggest calculating at simulation time dynamic potential fields whereas Narain et al. [2009] propose a hybrid approach to model large and highly dense crowd movement based on density constraints. More recently, Allain et al. [2014] proposed an op-timization approach to deform simulation generated trajectories to account for user defined constraints such as flow. Stylianou et al. [2004] proposed a stochastic approach for achieving density and flux constraints for street networks of cities. Although these meth-ods help in achieving flow constraints, it is difficult to achieve het-erogeneous density constraints that are also maintained over time as agents constantly move in the simulation.
Controlling density and flow directions in microscopic approaches [Reynolds 1987; Reynolds 1999] proves to be even more difficult to achieve due to the emergent nature of these systems. Ulicny et al.
[2004] and Normoyle et al. [2014] for example proposed simple in-terfaces to define agents and their goals. Some of these approaches use density values as input to the navigation algorithms; Best et al. [2014] for example propose simulating character behavior based on the relationship between density and speed. These methods can achieve density control to a limited scale for a limited time. Recently, methods to smoothly morph crowds between different formations have been proposed [Takahashi et al. 2009; Xu et al. 2014; Gu and Deng 2011]. Ju et al. [2010] introduced an approach by which different crowds can be blended together to create a new simulation; using this approach it would be possible to have density and direction control but simulations would be limited to the source data and heterogeneous density would be difficult to achieve. Lai et al. [2005] introduced a motion graph approach to simulating groups of crowds using pre-existing data; this approach allows for direction control of the entire group but has limitations due to constant group size and limited variance in data.
Crowd motion post-processing methods have also been introduced [Jordao et al. 2014; Kwon et al. 2008; Kim et al. 2014]. By us-ing these techniques, density and flow control of crowds can be achieved at a limited scale. Jordao et al. [2014] for example trans-form a scene composed of crowd patches [Yersin et al. 2009] to match an environment; this allows for some direction control but very limited density control. Additionally, these approaches are user centric and are therefore time-consuming with limitations in accuracy and are dependent on the quality of the source data. In the context of all these previous crowd animation techniques, our solution is the first system that enables locally controlling both crowd density and motion flows. In contrast with both post-processing and simulation methods, we generate endless anima-tions that constantly satisfy user density and flow constraints. In simulation-based approaches for example, we do not need to con-stantly reconsider agent goals to maintain density levels over time. Additionally, we propose a very intuitive way to control motion pa-rameters without needing any expertise in crowd simulation sys-tems to achieve crowd motion design. Actually, the framework we propose aims in balancing the benefits of most of the above approaches; it requires minimal user intervention, provides accu-rate control of heterogeneous density and flow direction, supports crowds of vastly different sizes that can reach hundreds of thou-sands of characters and has inexpensive run-time performance.
3
Overview
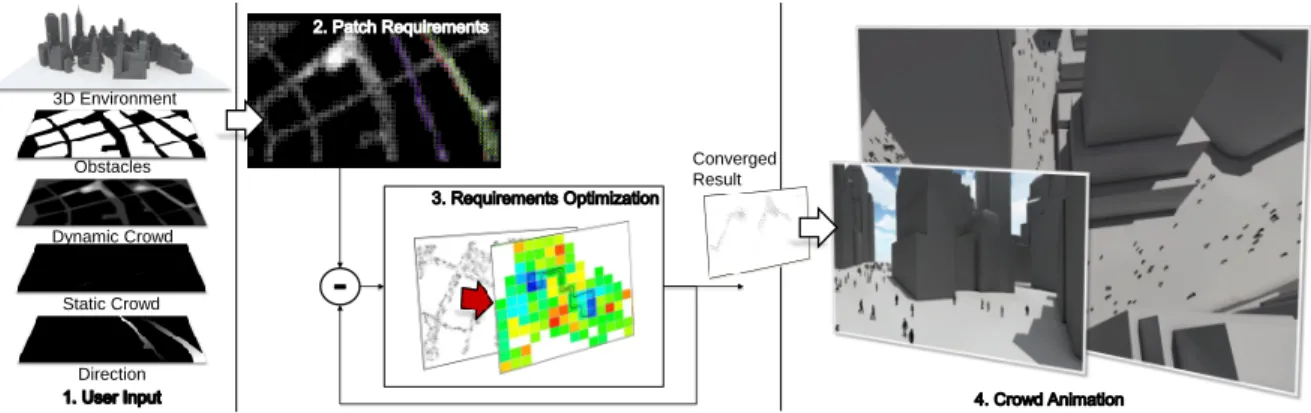
Our solution to controlling crowd density and direction first re-quires (i) the provision of an interface to design the crowd require-ments and (ii) an optimization process by which the crowd is gen-erated (Figure 2). In the first step, users can use a painting interface to draw areas of static and dynamic people as well as paint motion directions through color gradients (Section 5). They can use and combine as many layers of constraints as necessary; additionally these maps can be overlayed on top of environment maps to match obstacle free regions. Secondly, these maps are merged and dis-cretized to generate a graph describing density and flow direction requirements for the environment. Each node of the graph corre-sponds to a crowd patch [Yersin et al. 2009]. These patches are then constructed and iteratively optimized to satisfy the user con-straints (Section 4).
3.1 Crowd Patches
The proposed framework is built on top of the Crowd Patches plat-form proposed by Yersin et al [Yersin et al. 2009]. A crowd patch (Figure 3) is a pre-calculated periodic animation of a virtual crowd
3D Environment Obstacles Dynamic Crowd Static Crowd Direction Converged Result
Figure 2: Overview of the Crowd Art platform. (1) Users define a set of maps that annotate the environment with crowd information. (2) These maps are merged to generate a set of crowd patches under density and direction constraints (color indicates direction). (3) Crowd patch parameters are iteratively optimized to satisfy user requirements which are then used for (4) real-time animation of large crowds.
that when combined with other patches under boundary constraints can be used to populate a large environment with minimal run-time cost. More formally, a crowd patch is a tuple {A, π, D, S}
where A ⊂ R2is the convex 2D geometrical area where the
an-imation takes place, π is the period of the anan-imation and D and S are the sets of dynamic and static objects, respectively. Static
objectsare simple obstacles whose geometry is fully contained
in-side the patch, whereas dynamic objects are animated ones; i.e., they are moving in time according to a set of constrained spatio-temporal trajectories. There are two categories of dynamic objects:
endogenousand exogenous characters (Denand Dexrespectively).
Endogenous characters remain inside A for the entire duration π of the patch whereas exogenous leave A and enter other patches.
t x y
π
l
Figure 3: Patches and Patterns Adjacent patches can be connected if they have matching mirror patterns. Shading on the base of the patch indicates density and arrows represent flow direction.
3.2 Synthesizing Crowds using Crowd Patches
A patch can be considered as a spatio-temporal right prism with base area A and height π. By defining spatio-temporal control points on each of the lateral faces of the prism (called patterns), input and output points (I/O points) can be defined. These points act as portals between patches where characters can respectively enter or leave the patch (Figure 3). Two patches can be connected if they have matching patterns but with points of opposite purpose; i.e., input and output points switch roles. Therefore large π-periodic crowd animations can be created by assembling patches. Here there is one important constraint; the total number of input and output points of a patch must be equal; i.e., exogenous characters entering a patch must leave it at some time.
Crowd Patches Pipeline Crowd animation systems that use crowd patches as building blocks for crowds are typically
decom-posed into 4 stages (Figure 2):
1. Patch decomposition. The scene to be populated is divided into smaller convex areas where periodic crowd animations will be computed.
2. Patches definition. Patches parameters are then
com-puted/defined so that boundary constraints are not violated. 3. In-Patch trajectories generation. Boundary points in single
patches are connected and internal collision free trajectories are generated.
4. Animation. Finally, characters are placed on the trajectories like trains on rails and the animation can be played.
Typically, stages 1 and 2 are either manually set or automatically generated for very simple scenes with simple constraints (such as uniform density). For more difficult scenarios, such as big envi-ronments with varying density and flow, the computation of pa-rameters for each patch is a complex and constrained endeavor. We propose here an optimization-based approach to automatically compute such parameters (Section 4). To handle internal trajecto-ries (Step 3), we extend the stable matching algorithm proposed by Ramirez et al. [2014]) and deal with collision avoidance using a ve-locity based approach based on RVO (while [Ramirez et al. 2014] use a force based approach).
3.3 Density and Direction Control in Patches
We aim in computing parameters of our crowd patches from user-defined density and flow directions over period π. Density in a patch can be defined as:
ρ = 1 π Z π 0 ρ(t)dt = 1 Aπ Z π 0 |D(t)|dt. (1)
Assuming patches of constant size A and period π, density can be changed only by the number of characters |D(t)| that are present in the patch at any given time. Recall that we have two kinds of
char-acters; endogenous Denand exogenous Dex. Endogenous affect
density during the entire period of the patch, whereas exogenous af-fect density dynamically and are dependant of the number of input and output points and inter-connections between them (Figure 3). Equation 1 therefore can be written as:
ρ = |Den| A + 1 Aπ Z π 0 |Dex(t)|dt. (2)
10 20 30 40 50 # I/O Points 0.05 0.10 0.15 0.20 0.25 0.30 De ns ity (p eo pl e/ m 2) ρdyn=1 Aπ Zπ 0 |Dex(t)|dt
Density in Crowd Patches Size: 10
Size: 20 Size: 30
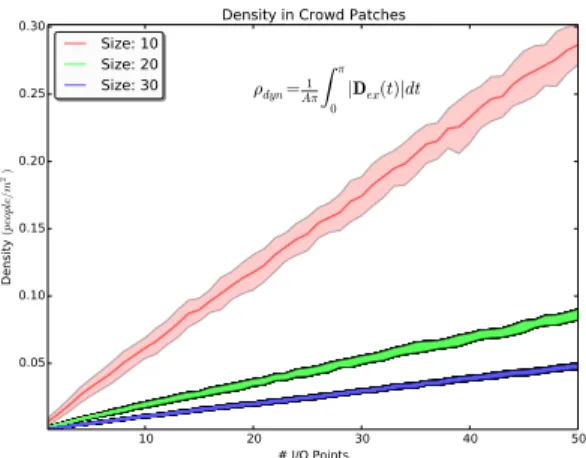
Figure 4: Density and I/O points Experimental data demonstrating the correlation between density and the number of I/O points for patches of different size and same period (π = 30 secs). Shaded regions represent the variance in density.
Therefore density can be controlled in two ways: (a) by modifying
endogenous characters Den and (b) by modifying input and
out-put points on the sides of the patch (this changes Dex(t)). Density depends on the exact spatio-temporal configuration of input/output points; by approximation we can actually correlate density only to the number of these points. This is justified by the experimental measurements shown in Figure 4 that demonstrate a direct correla-tion between the two with small variance (due to temporal place-ment and optimal connections between points). To compute these data, we generated multitudes of patches of different parameters (area A, period π), and different numbers and placement of IO points; static characters were not considered. For each of these
patches, we found optimal connections1between points and then
measured the resulting density (Equation 2).
Flow direction in patches can be defined by the way input/output points are placed and how they are interconnected. A connection between an input and output point defines a single direction dithat
lasts tiseconds. By knowing all connections D = {di: i ∈ [1, n]}
in a patch, we define the main flow direction of a patch as:
d = n X
i=1
tidi. (3)
One can observe the difference of density and flow direction be-tween two neighboring patches in the simple example displayed in Figure 3.
4
Optimizing Crowd Requirements
In this section we explain how to construct an assembly of crowd
patches with locally controlled density and flow direction. An
optimization-based strategy is employed to find the optimal crowd patches parameters without violating boundary conditions between neighboring patches (see Figure 3).
Optimization Strategy The main principle behind our optimiza-tion strategy is to add or remove sets of input and output points at boundaries of patches at each step of the optimization loop aiming 1Optimal connections were retrieved using the approach of Ramirez et al. [2014].
to get as close as possible to the user inputs. We measure a signed error for each patch. The error is computed as a combination of (i) a density error measuring the difference in terms of number of char-acters between existing and expect values in a patch and (ii) a direc-tion error measuring the difference between the expected direcdirec-tion and the weighted sum of actual characters’ directions (Equation 3). Given that every change on a patch impacts its neighboring patches – therefore changing neighboring densities and flows, the steps are repeated until convergence. Convergence is met when error change is negligible.
Constraints During optimization, two types of constraints need to be satisfied: user and patch constraints. User constraints define de-sired density and direction where needed; every patch has a density constraint whereas direction is optional and can be defined in parts of the environment. Patch constraints on the other hand concern cardinality of input and output points as well as compatibility be-tween patterns of neighboring patches (Section 3.1); i.e., patches must be connectable and periodic. Additionally, there is a
maxi-mum allowed density value ρmaxfor all patches.
Representation Our problem is modelled as a graph G = (V, E); nodes V and edges E indicate patches and connections between patches respectively. Each node u ∈ V stores the measured density ρu,cin the patch, the required density ρu,r, the measured direction du,c(if needed) and the required direction du,r. Directions are unit length 2D vectors.
4.1 Algorithm
For all the remaining, please consult Algorithm 1; numbers near the paragraph titles indicate lines in the algorithm.
Initialization (Alg. 1, lines 1, 2) The graph is initialized by setting all patches to have the same density value so that each one of them has the exact same number of input/output points and can be easily connected without violating patch constraints (setting all patches to a zero density value is a possible initialization). The initial values for density affect the speed of convergence which is also depen-dant on the complexity of the density and direction requirements (Section 6). Given the initial density value, we use a regression on experimental data in order to compute the initial number of input and output points in patch. Figure 4 displays the relation between density (vertically) and number of input/output points for different patch sizes. Additionally patch size A and period π are uniformly set by the user depending on accuracy requirements; smaller patch sizes lead to better approximation of density.
Finally, during initialization the graph is split into strongly con-nected components using Tarjan’s algorithm [Tarjan 1972]; op-timizations are then performed independently on each connected component (Section 4.2). Splitting the graph first reduces the over-all complexity of the process and then over-allows to concentrate the modifications in strongly connected areas (i.e. where there are more possibilities of connections between components).
Measuring Convergence (Alg. 1, lines 3, 22) To measure the error to the desired solution, we define a function E(G) that composes density and direction errors of the entire scene at each iteration step (Eρ(G) and Ed(G) respectively):
E(G) = Eρ(G) + Ed(G) (4)
density scaled to the maximum allowed density ρmax2: Eρ(G) = 1 ρmax s 1 |V | X u∈V (ρu,r− ρu,c)2 (5)
We then define Ed(G) based on the angle between du,cand du,r:
Ed(G) = 1 |Vd| X u∈Vd (1 − du,r.du,c) (6)
where Vd⊆ V represents the subset of patches that have direction
requirements. Now the interesting aspect here is that rather than
computing the current direction du,rfrom existing trajectories, we
actually optimize the assignments between inputs and output points and then measure the direction. The assignments are based on opti-mal matching by extending the work of [Ramirez et al. 2014]. The direction is measured using the weighted average direction of con-nections (a connection being a straight line between I/O points). Weights are simply defined as the duration between the input/ouput points of a connection. Ramirez et al. [2014] optimize the con-nections between pairs of input/output points in a patch by using a score function that gives more imortance to points on opposing patterns based on the preferred speed of each agent. We extend this in two ways; by defining a new matching function that addi-tionally takes into account the direction contraints and by setting the preferred speed of agents in any given patch based on the den-sity requirements. We base the latter on the fact that people tend to move slower in dense rather than sparse situations [Seyfried et al. 2005].
4.2 Optimization steps
During each step of Algorithm 1, three basic operations are per-formed to minimize Equation 4: (i) finding areas with large errors, (ii) selecting subsets of them and (iii) removing/adding points in patches that lie on these paths of minimal cost between them. Error and Local Optima (Alg. 1, lines 4-8) At every optimization step, we set an error value on each node u ∈ V of the graph:
e(u) = eρ(u) + sgn(eρ(u))ed(u) (7)
eρ(u) = ρu,c− ρu,ris the signed error in density, ed(u) = |1 − du,r.du,c|/2 is the error in direction and sgn(.) is the sign function.
Positive values of eρ(u) indicate that the node has more density
than requested whereas negative indicate that the node is lacking
density. Values of ed(u) near 0 indicate good direction whereas
values near 1 indicate opposite direction. Local positive maxima of e(u) in G indicate neighborhoods of patches that either have an abundance of density or direction is not correct, whereas local
negative minimaindicate areas that need characters and have bad
direction (Figure 5).
Fixing errors (Alg. 1, lines 7, 8, 9, 16) We use these positive max-ima and negative minmax-ima patches as starting points to fix problems in the patches. First, all of them are found and grouped together based on distance, type (maxima with maxima and minima with minima) and if they belong in the same connected component; these groups typically consist of 2–5 optima. Then, circular paths that aim in minimizing error between the patches of a single group are found. We emphasize that these paths are not actual paths; rather they act as on/off switches between patches that open doors so that
2This is currently user defined and set to 0.35 characters.m−2.
Algorithm 1: Optimizing density and main direction constraints. Each mutation manipulates I/O points and affects a set of patches. input : Graph G = (V, E) of density and main direction user
constraints.
output: Graph G = (V, E) modified to satisfy all user and patch constraints. 1 InitRandomSolution(G); 2 SC ← StronglyConnectedComponents(G); 3 while not converged do
/* Mutate Graph G */
4
for each component Gi= (Vi, Ei) ∈ SC do
/* Update error values on nodes and edges */
5
U pdateSignedError(Gi, Vi);
6
U pdateEdgeW eights(Gi, Ei);
/* Find error optima and fix them in groups */
7
max ← ErrorM axima(Vi) > 0;
8
min ← ErrorM inima(Vi) < 0;
9 M G ← CreateGroups(max);
10 for each group of maxima m ∈ M G do
11
path ← M inimumCostP ath(Gi, m);
/* Check if points can be deleted */ 12 if CanRemove(path) then 13 RemoveP oints(path); 14 end 15 end 16 M G ← CreateGroups(min); 17 for each group of minima m ∈ M G do
18
path ← M inimumCostP ath(Gi, m);
19 AddP oints(path); 20 end 21 end 22 globalError ← measureGlobalError(G) 23 end 24 return G;
when the time comes, connections can be made that satisfy user constraints. Also, by forcing circular paths we ensure that pairs of input and output points are added together so that boundary con-straints are not violated. Additionally, we limit the matching of op-tima based on distance so that it is easier to find paths and minimize error instead of actually increasing it.
Path finding between optima (Alg. 1, lines 10-15, 17-20) Having
a set O = {Oi : 1 ≤ i ≤ k} of k optima, a path between each
pair {Oi, O(i+1)%k}, ∀i ∈ [1, k] of optima is found. In the case
where these optima are positive maxima, points must be deleted (Figure 5 right). To do so, a path between two maxima is found that
minimizes the derivative e0(u) between any two patches in the path
(i.e., the direction of slower descent). More importantly, each pat-tern that connects two patches in the entire path must have enough I/O points to allow for deletion. After the entire path between all maxima is found, pairs of input and output points that connect con-secutive patches are deleted. In the case where the optima are neg-ative minima, the operation is slightly easier since we do not need to make sure that points exist or not on each pattern touched by the
path (Figure 5). Here, we again aim in minimizing e0(u) and when
the entire path is found, points are added instead of deleted. We note that in both cases, it is possible to have patches in the path where error increases; this effect is minimized by following patches with “high” same sign errors and by adding a penalty if we
Figure 6: Convergence Algorithm 1 convergence for some of the experiments presented in Section 6.
cross the boundary where we have e(u) = 0. Even though some patches can have an increase in error, these are typically fixed on a following update step. Finally, instead of modifying all groups of maxima and minima found at each step, we select a few; this selection is simply a linear function of the number of patches in a
given connected component3.
Internal Trajectories (Alg. 1, line 22) At the end of each
opti-mization step, current density and direction values (ρu,cand du,c
respectively), must be computed for each patch. To speed up cal-culations, simplified trajectories are found that do not take into ac-count collision avoidance; this simplification does not affect accu-racy (Section 4.1). Accurate trajectories are calculated at the end of optimization using the approach described in Section 3.2.
Algorithm Convergence (Alg. 1, line 3) The proposed approach converges to a globally good solution (Equation 4) after a few min-utes (Figure 6). Convergence depends on the initial configuration of each patch, the complexity of the user constraints, the number of paths updated at each step and and the number of requested char-acters. See Table 1 for the convergence time of the experiments discussed in Section 6.
5
User Interface
This section describes the user interface for specifying crowd den-sity and direction requirements. The proposed approach is paint-driven and exploits tools familiar to artists such as brushes, selec-tions, movement, gradients, strokes, etc. The system was integrated in an open source image processing tool [GIMP Team 2001–2015] as a set of plugins. An artist can define a crowd by painting a set of grayscale layers on top of the environment map; these layers are essentially metadata having all the information needed to generate a crowd with density and direction controls. We define four basic types of layers (Figure 7): dynamic and static density, direction and obstacles; a user can create as many layers of a specific type as she pleases. Additionally, layer and pixel opacity are used to assign weights to layers and pixels respectively.
Crowd Maps Dynamic and static density layers are used to define the density of exogenous and endogenous characters respectively. Density is defined through the intensity of pixels; the brighter the values the higher the density. Direction is defined by drawing dark
3If G
i = (Vi, Ei) ⊂ G = (V, E) is a connected component, we update at each step bVi/400c + 1 paths.
0.2 0.4 0.4 Dynamic Density 0.5 0.25 0.25 Static Density Obstacles Environment Direction Constraints Graph
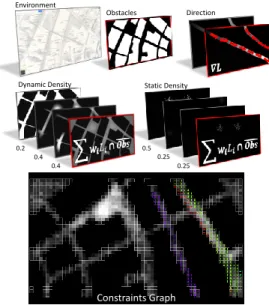
Figure 7: Defining Constraints Users can annotate an environ-ment with various information using image layers; these include obstacles, dynamic and static density and directions. Layers are separately accumulated to generate final constraints. (bottom) Fi-nally, a graph of density and direction contraints is generated.
to bright gradients and finding the layer’s 2D gradient. Finally, obstacle layers are used to easily mask out areas where density must be zero; this can also be achieved by careful painting of density. We found that this approach eases the process for various kinds of pre-existing environment maps where obstacles can be selected based on color.
Layer Merging Layers are then separately merged together to gen-erate three grayscale layers describing the final requirements for overall (a) dynamic density, (b) static density and (c) direction. All direction and density layers are accumulated together using weights based on pixel and layer opacity. Additionally areas where obsta-cles are present are removed.
From maps to crowd patches Having global merged layers, three additional parameters are defined: the desired number of charac-ters, the crowd patches size and global period π; these parameters affect the quality and accuracy of the generated crowd. Each crowd patch is defined by a square set of pixels depending on maps reso-lution and patch size; desired density and direction for a patch are computed by the average of the pixel values. Empty patches are re-moved and a graph of interconnected patches is generated based on neighborhood information (Figure 7 bottom); this graph is given as input to the optimization approach described in Section 4 to gener-ate the desired crowd. We found that users need only a few minutes to populate scenes such as the ones shown in Section 6.
6
Results
We evaluate our method according to different types of scenarios. First, simple scenarios explore how accurately our method actu-ally match users’ inputs; both for density and flow requirements. Secondly, we demonstrate our approach in typical use cases that include populating city like environments. Finally, we analyze the performance of our approach.
Please refer to the accompanying video4for animated versions of
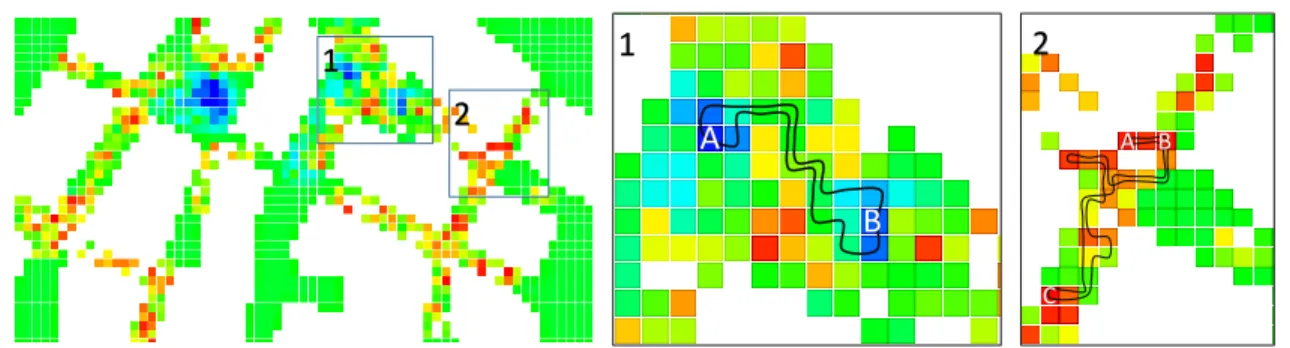
1
2
1
2
A
B
A B CFigure 5: Fixing errors. (left) The leftmost image shows the signed error map at one step of the optimization. Green values indicate 0, cold and hot colors indicate negative and positive values respectively. The darkest blue indicate negative minima and red positive maxima. (middle) Two minima A and B have been selected based on distance and a path of minimal cost is found between A and B and back; pairs of output/input points are added on the sides that connect two patches of the path increasing density. (right) Three maxima have been selected and paths from A to B, B to C and C to A are found; pairs of input/output points are removed on the path only if points can be removed from all patches on the path. Observe that in this case, patches that were ok (green) were modified to fix erroneous ones.
the paper results; this is especially useful for the flow experiments. We emphasize here that all resulting animations can be efficiently and endlessly played with user requirements being constantly satis-fied; i.e., direction and flow direction remain constant over time and the optimized result is never violated. In comparison with previous approaches, only our method provides such a feature. For all pre-sented examples, patches were defined so that A ranged between
16 and 100m2.
6.1 Density Control
Our system is capable of generating crowds of different density re-quirements (Figure 8); to simulate different density patterns, users provide grayscale density maps, the required number of characters and the size of the area and patches. We remind the reader that users can provide two kinds of density maps; dynamic and static. Here we demonstrate dynamically moving crowds and not static which are trivial to handle.
The proposed system is capable of handling very diverse inputs such as simple uniform density (not shown), lanes of discrete den-sity, smooth gradients and even complex ones such as paintings with minimal errors (Figure 8). The demonstrated examples con-sist of crowds of different sizes, ranging from the relatively small of 1000 characters up to very large ones of 100000 characters. We note that characters move around the environment between areas of high and low density and are not localized.
6.2 Flow Direction Control
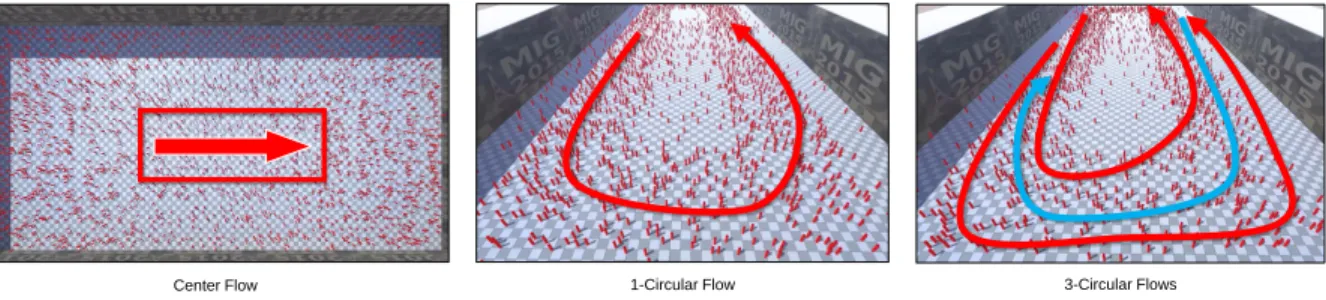
Flow direction can easily be controlled with our approach; we pro-vide here the description of the experiments and the results. We set up three simple scenarios; a uniform density crowd with a flow constraint in a part of the crowd (Center Flow), a circular mov-ing crowd (1-Circular Flow) and finally three circular motions (3-Circular Flows); in both of the circular motions there is a small number of characters moving in the remainder of the region with-out any direction constraint (Figure 9).
In Center Flow, uniform density is achieved and the characters in the middle follow the requested direction. Importantly, in this sce-nario, flows emerge in other parts of the environment that guide the characters from the end of the flow, around the flow and back at the beginning. In both 1-Circular Flow and 3-Circular Flow, circular lanes of characters are satisfied; characters in the areas without any flow constraints enter the lanes, follow them and either leave them
to satisfy density constraints around the lanes or just follow the mo-tions. These kind of control can be used to generate scenes such as strikes or people entering/leaving a train station.
6.3 Use Cases
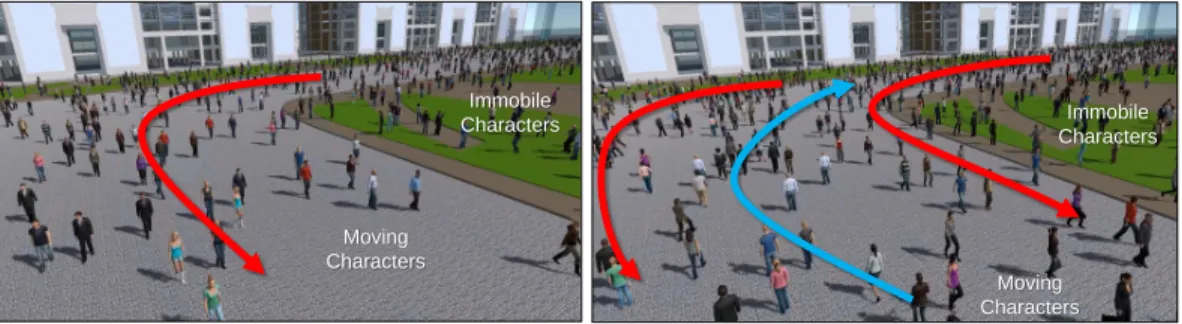
Having demonstrated our system in typical scenarios, we can pop-ulate virtual environments with combinations of constraints. We demonstrate these results in two example scenarios; a single street around a park under different constraints (Figure 10) and a simula-tion of the Wall Street area in New York city (Figures 1 and 11). Changing User Requirements A user can change the requirements for the same environment quite easily as demonstrated in Figure 10; here the scene is populated with a set of immobile characters (static density) that are lying on the lown and a set of moving characters with different flows around them. Moving characters avoid both dynamic and static ones.
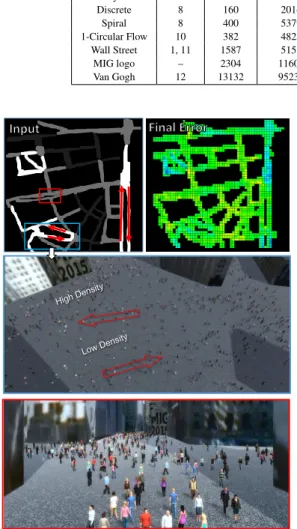
Wall Street It is also easy and intuitive to populate large city-like environments such as the one shown in Figures 1 and 11. We popu-late this environment with a non uniform crowd of 5000 characters and additionally add direction constraints in some areas (Figure 11). Obstacles such as buildings are additionally marked through the user interface. Our system converges to a good solution satisfying density and flow constraints with minimal error in just a few steps. Massive Crowds Finally, we demonstrate that our system can scale to very large crowds of hundreds of thousands of characters under complex constraints such as the one in Figure 12. This scene
con-sists of ~100000 moving characters in an area of 0.8km2(~13000
patches) satisfying an image based density pattern. The system con-verges to density patterns that are close to the requested even though characters move in areas where the requested density was very low; this happens because of the high contrast between high and low density areas. The resulting animation is endless and collision free.
6.4 Performance
The proposed framework can take up to a few minutes to find crowd patches configurations under user constraints (Table 1); these re-sults do not include the time to resolve internal collisions for the patches which is out of the scope of this work. We provide time for both optimization and resolving collisions using our velocity based implementation for completeness; notice that this time is sig-nificantly larger than the time to optimize patch parameters.
Op-Discrete Density Smooth Density (HLH) Smooth Density (Spiral) Van Gogh High Low High -High Medium High Medium-High -High High
High Low High
Figure 8: Density Control Our system can simulate crowds of different density patterns ranging from the very simple discrete density cases of a few thousand characters to the very complex ones (e.g., paintings) of hundreds of thousands. We note that characters move continuously between densities without violating the overall density requirements.
Center Flow 1-Circular Flow 3-Circular Flows
Figure 9: Flow Direction Control Our system allows for easy control of flow direction.
timization time is affected by the number of patches, number of characters and the complexity of user constraints; it typically takes minutes. All of the performance measurements were collected on a 64-bit Linux based system having an 8 core Intel®Xeon(R) CPU E5-1620 clocked at 3.60GHz, with 16GB of RAM and a GeForce GTX 680/PCIe/SSE2 GPU card.
7
Limitations
The current framework allows for density and direction patterns that are constant over time. This limits simulating day and night cycles for example. Based on crowd patches, this makes such functionality difficult to achieve: a dynamic patches update system needs to be developed.
Patches are initially organized using a regular grid, making it dif-ficult to fit in a given complex environment and detailed user con-straints. In addition, only a single direction constraint can be set; this limits the potential animations that can be produced, such as bidirectional flows inside patches. Our algorithm though is not dependant on a grid implementation; it considers graphs of crowd patches of any shape. Finally, implicit flow direction derived from density gradients is not taken into account.
We do not find and reuse identical patches at various locations therefore the crowd patches technique is not optimally used. Us-ing a finite set of precomputed patches would certainly and drasti-cally increase performance; this could allow for interactivity, and to design the crowd motion at the same time it is being visualized.
There are cases that the algorithm will fail to get a very accurate so-lution due to bad and/or highly contradicting user constraints. An-other example of that is defining directions of motion that go from very high density areas to very low density ones; this results in low density constraints being violated.
Finally, to calculate final collision free patch trajectories we are us-ing an extension of of the stable matchus-ing approach proposed by Ramirez et al. [2014]. This technique fails in generating high qual-ity trajectories for very high densqual-ity patches therefore we are con-sidering alternative approaches.
8
Conclusion
A method to intuitively design crowd motion with simultaneous control of density and direction has been presented. These two quantities are essential to define the visual aspect of crowd motion, but no previous methods allow users to easily control them over large-scale crowd motion: many of our demonstrations required minimal time to define. Our framework is robust to various kind of inputs such as simple user strokes, city maps or digital images and is particularly efficient to populate environments with ambi-ent crowds of certain patterns such as cities and expressive artistic crowds. Users can create crowds using our prototype system in minutes, with no specific knowledge, no need to annotate environ-ments and no need to tune complex sets of parameters. Addition-ally, generated crowds satisfy user constraints endlessly and not just for a short period of time.
Immobile Characters Moving Characters Immobile Characters Moving Characters
Figure 10: Same environment, different constraints. With the proposed system it is easy to change constraints in an area.
Input Density
Optimized Density
Optimized Crowd Animation
Figure 12: Massive Crowds Our system can handle complex density patterns based on images or photographs such as this one based on a
painting. We demonstrate here the generated patches’ density and direction results for a massive crowd of 100000 characters in a0.8km2
area. Notice that there is some error in the resulting density due to the complexity of the pattern. We note that the resulting animation is collision free and can be played real time (no rendering).
as more diverse flow directions inside patches (e.g., bi-directional or cross sections); this can be achieved for example by having mul-tiple directions in each patch. Another possible improvement is adding sources and sinks (buildings, subway stations, etc.); this will remove circular paths and improve convergence. Importantly, we are considering conducting user studies to asses the quality or results and the user experience of our approach both by naive and expert users.
Another future work direction is to consider an approach to find an optimal set of convex crowd patches that fit precisely obstacles and user requirements. Finally, we would like to be able to transi-tion between different constraints to model situatransi-tions like different hours of the day for the same places; e.g., parks, business areas, etc. These transitions should look natural and be continuous, so a careful method of morphing between patches should be considered.
Acknowledgements
This work is funded by the French National Research Agency ANR, projects Chrome (ANR-12-CORD-0013CHROME). Part of this work was supported by the ERC Advanced grant ”Expressive”.
The authors would like to thank Tristan LEBOUFFANTfor his help
on preparing our demonstrations.
References
ALLAIN, P., COURTY, N., ANDCORPETTI, T. 2014. Optimal crowd editing. Graphical Models 76, 1, 1–16.
BEST, A., NARANG, S., CURTIS, S., AND MANOCHA, D.
2014. Densesense: Interactive crowd simulation using density-dependent filters. In Symp. on Computer Animation, 97–102. CHARALAMBOUS, P.,ANDCHRYSANTHOU, Y. 2014. The PAG
Crowd: A Graph Based Approach for Efficient Data-Driven Crowd Simulation. Comp. Graph. Forum 33, 95–108.
CHENNEY, S. 2004. Flow tiles. In Proceedings of the 2004 ACM SIGGRAPH/Eurographics symposium on Computer animation, Eurographics Association, 233–242.
COURTY, N., ANDCORPETTI, T. 2007. Crowd motion capture. Computer Animation and Virtual Worlds 18, 4-5, 361–370.
GIMP TEAM, T., 2001–2015. GIMP: GNU Image Manipulation
Program. http://www.gimp.org/.
GU, Q., AND DENG, Z. 2011. Formation sketching: an
ap-proach to stylize groups in crowd simulation. In Proceedings of Graphics Interface 2011, Canadian Human-Computer Com-munications Society, 1–8.
JORDAO, K., PETTRE´, J., CHRISTIE, M.,ANDCANI, M.-P. 2014. Crowd sculpting: A space-time sculpting method for populating virtual environments. In Comp. Graph. Forum, vol. 33, Wiley Online Library, 351–360.
JU, E., CHOI, M. G., PARK, M., LEE, J., LEE, K. H., AND
TAKAHASI, S. 2010. Morphable crowds. In Proc. of ACM SIGGRAPH Asia, ACM, SIGGRAPH Asia ’10, 140:1–140:10.
Table 1: Performance for most of the experiments presented in this work.
Performance
Scenario Figure Patches Characters Iterations Time (s) Internal Traj. Time (s) Error Density HLH 8 200 1097 276 8 184 0.0713 Discrete 8 160 2014 221 9 597 0.0697 Spiral 8 400 5379 310 27 1569 0.0457 1-Circular Flow 10 382 4825 340 22 268 0.0673 Wall Street 1, 11 1587 5158 67 7 51 0.0671 MIG logo – 2304 11601 135 36 1632 0.0376 Van Gogh 12 13132 95236 250 1181 ~7 hrs 0.0756
Figure 11: City simulation (top) User requirements and error in the optimization. (middle-bottom) Views of the final generated scene.
KAPADIA, M., SINGH, S., REINMAN, G.,ANDFALOUTSOS, P. 2011. A behavior-authoring framework for multiactor simula-tions. Comp. Graph. and Applications, IEEE 31, 6, 45–55. KIM, J., SEOL, Y., KWON, T.,ANDLEE, J. 2014. Interactive
ma-nipulation of large-scale crowd animation. ACM Trans. Graph. 33, 4 (July), 83:1–83:10.
KWON, T., LEE, K. H., LEE, J., AND TAKAHASHI, S. 2008.
Group motion editing. ACM Trans. Graph. 27, 3 (Aug.), 80:1– 80:8.
LAI, Y.-C., CHENNEY, S., ANDFAN, S. 2005. Group motion
graphs. In Proc. of the 2005 ACM SIGGRAPH/Eurographics symposium on Computer animation, ACM, 281–290.
LERNER, A., CHRYSANTHOU, Y.,ANDLISCHINSKI, D. 2007. Crowds by example. Comp. Graph. Forum 26, 3 (September), 655–664.
NARAIN, R., GOLAS, A., CURTIS, S., ANDLIN, M. C. 2009. Aggregate dynamics for dense crowd simulation. In ACM Trans.
on Graphics (TOG), vol. 28, ACM, 122.
NORMOYLE, A., LIKHACHEV, M., ANDSAFONOVA, A. 2014. Stochastic activity authoring with direct user control. In Pro-ceedings of the 18th Meeting of the ACM SIGGRAPH Sympo-sium on Interactive 3D Graphics and Games, ACM, New York, NY, USA, I3D ’14, 31–38.
PATIL, S., VAN DEN BERG, J., CURTIS, S., LIN, M. C.,AND
MANOCHA, D. 2011. Directing crowd simulations using navi-gation fields. Visualization and Computer Graphics, IEEE Trans. on 17, 2, 244–254.
RAMIREZ, J. G. R., LANGE, D., CHARALAMBOUS, P., ES
-TEVES, C.,ANDPETTRE´, J. 2014. Optimization-based com-putation of locomotion trajectories for crowd patches. In Proc. of the Seventh International Conference on Motion in Games, ACM, New York, NY, USA, MIG ’14, 7–16.
REYNOLDS, C. W. 1987. Flocks, herds, and schools: A distributed behavioral model. Computer Graphics 21, 4, 24–34.
REYNOLDS, C. W. 1999. Steering behaviors for autonomous char-acters. In Game Developers Conference, 763–782.
SEYFRIED, A., STEFFEN, B., KLINGSCH, W.,ANDBOLTES, M. 2005. The fundamental diagram of pedestrian movement revis-ited. Journal of Statistical Mechanics: Theory and Experiment 10(Oct.), 2.
STYLIANOU, S., FYRILLAS, M. M., ANDCHRYSANTHOU, Y. 2004. Scalable pedestrian simulation for virtual cities. In Pro-ceedings of the ACM symposium on Virtual reality software and technology, ACM, 65–72.
TAKAHASHI, S., YOSHIDA, K., KWON, T., LEE, K. H., LEE, J.,
ANDSHIN, S. Y. 2009. Spectral-based group formation control.
Comp. Graph. Forum 28, 2, 639–648.
TARJAN, R. 1972. Depth first search and linear graph algorithms. SIAM Journal on Computing.
TREUILLE, A., COOPER, S.,ANDPOPOVIC´, Z. 2006. Continuum crowds. In Proc. of ACM SIGGRAPH 2006, ACM, SIGGRAPH ’06, 1160–1168.
ULICNY, B., CIECHOMSKI, P.D. H.,ANDTHALMANN, D. 2004. Crowdbrush: interactive authoring of real-time crowd scenes. In Proc. of the 2004 ACM SIGGRAPH/Eurographics symposium on Computer animation, Eurographics Association, 243–252.
XU, M., WU, Y., YE, Y., FARKAS, I., JIANG, H.,ANDDENG,
Z. 2014. Collective crowd formation transform with mutual informationbased runtime feedback. Comp. Graph. Forum. YERSIN, B., MA¨IM, J., PETTRE´, J.,ANDTHALMANN, D. 2009.
Crowd patches: Populating large-scale virtual environments for real-time applications. In Proc. of the 2009 Symposium on Inter-active 3D Graphics and Games, ACM, I3D ’09, 207–214.