Comparing Urban Agriculture
in Four Areas of Portland, Oregon
Mapping and Survey Results
Prepared by:
Laura Combs, MURP Nathan McClintock, PhD
Acknowledgements & Credits
Funded by the National Science Foundation Geography and Spatial Sciences Program
Grant #1539750: Urban Agriculture, Policymaking, and Sustainability Principal Investigators:
Nathan McClintock, PhD, Portland State University Eugene McCann, PhD, Simon Fraser University
For more information on this project, please contact: Nathan McClintock (urbanag@pdx.edu)
Photo by G. Manser
This work is licensed under a Creative Commons Attribution-NonCommercial-NoDerivatives 4.0 International License. See: https://creativecommons.org/licenses/by-nc-nd/4.0/
Introduction
This report summarizes the results of a mail survey of urban agriculture practices in four areas of Portland, completed in Summer 2016, a mapping study conducted at the same time, and an internet survey of community gardeners conducted in Spring 2017.
The two surveys and mapping study are part of a wider research project entitled Urban agriculture, policy-making, and sustainability, led by Dr. Nathan McClintock of the Toulan School of Urban Studies & Planning at Portland State University and Dr. Eugene McCann of the Department of Geography at Simon Fraser University in Vancouver, British Columbia. Funded by the National Science Foundation, this project incorporates geospatial and survey data, interviews and focus groups with urban agriculture advocates, practitioners, policymakers, as well as an analysis of policy and discourses surrounding urban agriculture’s role in urban sustainability. In particular, we are examining urban agriculture policies and practices in both Portland and Vancouver, BC in order to understand how they contribute to the development of urban spaces, as well as the ways in which urban agriculture practitioners, advocates and policy-makers facilitate urban food production. A nearly identical survey was
Study Areas in Portland:
• Inner North/Northeast
• Cully
• Inner Southeast
• East Portland
Total Survey Respondents:
572
Total Respondents with
Home Gardens:
479
distributed to households in Vancouver, BC. Data from both surveys will be used to compare the gardening practices and motivations between the two cities.
The first survey was mailed to a random sample of 3,000 households across four distinct areas of the city in June 2016: Inner North/ Northeast (census tracts roughly paralleling the boundaries of Piedmont, Woodlawn, and King), Cully, Inner Southeast (census tracts including parts of Hosford-Abernethy, Buckman, and Sunnyside), and Outer Southeast (Centennial and Hazelwood), or what we refer to hereafter as “East Portland.” The two-page survey, sent in English, Spanish, Russian, and Mandarin, consisted of about 30 questions, spanning topics from garden size, yield, and gardener demographics, to the motivations behind home gardening and suggestions for increased city support. We examined these same four geographic areas using Bing and Google Earth imagery to look for concentrations of gardens, using ArcGIS software to identify any spatial patterns or trends.
Finally, to identify differences between home gardeners and community gardeners, we complemented the mail survey with an online survey consisting of questions that were nearly identical to those in the mail survey. A link to the online survey was circulated citywide via a monthly e-newsletter to plot holders in all 52 community gardens managed by the City of Portland’s Community Gardens program.
Earl Boyles Community Garden
Introduction
Neighborhood Snapshots
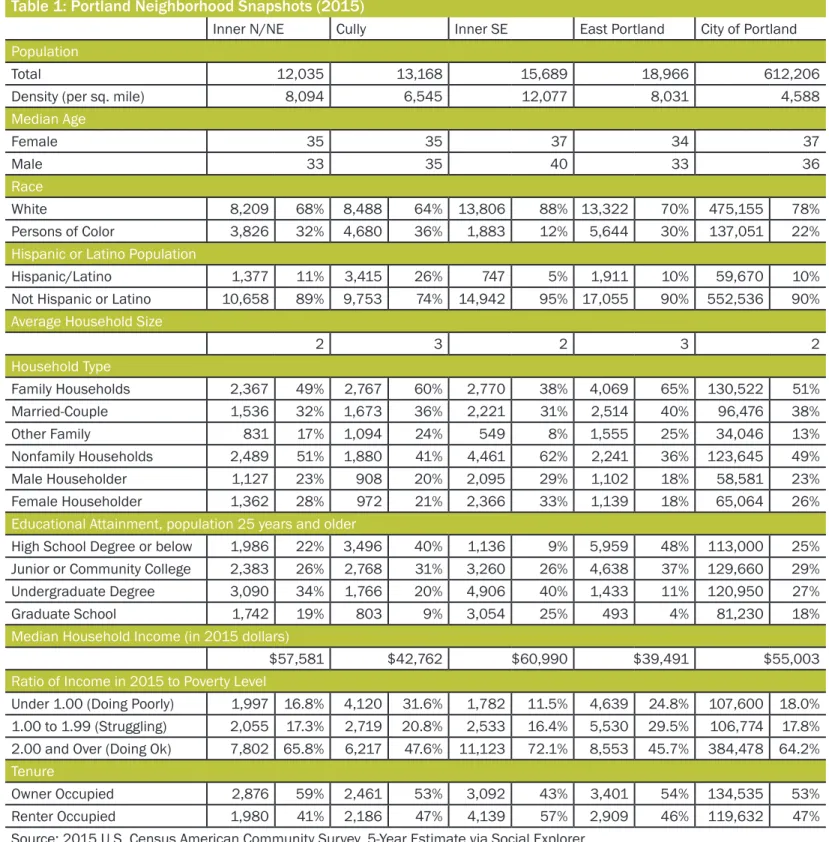
To provide a brief demographic and socio-economic context for the research study areas in the broader context of the City of Portland, we have included selected statistics below. It is also helpful to compare these statistics (for example, educational attainment, income, home ownership, and race/ethnicity) to those of our survey respondents. This can help us identify similarities and differences between gardeners and the surrounding population in each study area.
Table 1: Portland Neighborhood Snapshots (2015)
Inner N/NE Cully Inner SE East Portland City of Portland
Population
Total 12,035 13,168 15,689 18,966 612,206
Density (per sq. mile) 8,094 6,545 12,077 8,031 4,588
Median Age Female 35 35 37 34 37 Male 33 35 40 33 36 Race White 8,209 68% 8,488 64% 13,806 88% 13,322 70% 475,155 78% Persons of Color 3,826 32% 4,680 36% 1,883 12% 5,644 30% 137,051 22%
Hispanic or Latino Population
Hispanic/Latino 1,377 11% 3,415 26% 747 5% 1,911 10% 59,670 10%
Not Hispanic or Latino 10,658 89% 9,753 74% 14,942 95% 17,055 90% 552,536 90%
Average Household Size
2 3 2 3 2 Household Type Family Households 2,367 49% 2,767 60% 2,770 38% 4,069 65% 130,522 51% Married-Couple 1,536 32% 1,673 36% 2,221 31% 2,514 40% 96,476 38% Other Family 831 17% 1,094 24% 549 8% 1,555 25% 34,046 13% Nonfamily Households 2,489 51% 1,880 41% 4,461 62% 2,241 36% 123,645 49% Male Householder 1,127 23% 908 20% 2,095 29% 1,102 18% 58,581 23% Female Householder 1,362 28% 972 21% 2,366 33% 1,139 18% 65,064 26%
Educational Attainment, population 25 years and older
High School Degree or below 1,986 22% 3,496 40% 1,136 9% 5,959 48% 113,000 25%
Junior or Community College 2,383 26% 2,768 31% 3,260 26% 4,638 37% 129,660 29%
Undergraduate Degree 3,090 34% 1,766 20% 4,906 40% 1,433 11% 120,950 27%
Graduate School 1,742 19% 803 9% 3,054 25% 493 4% 81,230 18%
Median Household Income (in 2015 dollars)
$57,581 $42,762 $60,990 $39,491 $55,003
Ratio of Income in 2015 to Poverty Level
Under 1.00 (Doing Poorly) 1,997 16.8% 4,120 31.6% 1,782 11.5% 4,639 24.8% 107,600 18.0%
1.00 to 1.99 (Struggling) 2,055 17.3% 2,719 20.8% 2,533 16.4% 5,530 29.5% 106,774 17.8%
2.00 and Over (Doing Ok) 7,802 65.8% 6,217 47.6% 11,123 72.1% 8,553 45.7% 384,478 64.2%
Tenure
Survey Response Rates by
Study Area:
Survey response rates differed somewhat across the four study areas. The study area in Inner North/Northeast Portland had over double the response rate as those from the East Portland study area, despite doubling the number of surveys sent to East Portland households. Response rates in Inner Southeast and Cully fell between the other two. Survey respondents appeared to self-select from the group of people participating in urban agriculture, as they accounted for 84% of all responses (479 in total). The majority of people who responded to the survey, regardless of whether they gardened, were women (72%) between 35-69 years old, part of a couple without kids (31%) and living above the poverty level (74%).
We proceed with the caveat that the results presented here are representative only of the survey respondents, and may not necessarily be generalizable to the larger population. While our sample size would allow us to generalize our results to the overall population with a margin of error of + or – 6%, such an interpretation would somewhat inaccurate, as results are likely skewed due to both self-selection bias and non-response error, despite our efforts to reach out in multiple languages. In other words, the views of those most interested in the survey topic are likely overrepresented, while the views of other gardeners, especially those whose first language is not English, are underrepresented here. Given the low number of responses from non-English speakers and the disproportionate number of women who responded, we have neither weighted the results nor attempted to compare results along gender or racial/ethnic lines. We also want to underscore that our study is not a thorough census to quantify exactly how much urban agriculture exists in these four areas of Portland, but rather an effort to understand how motivations and practices are similar and how they differ across the city.
Looking Closer: Response Rates
• Inner N/NE: 211
(37%)
• Cully: 119 (21%)
• Inner SE: 150 (26%)
• East Portland: 92
(16%)
Results of Mapping
Analysis
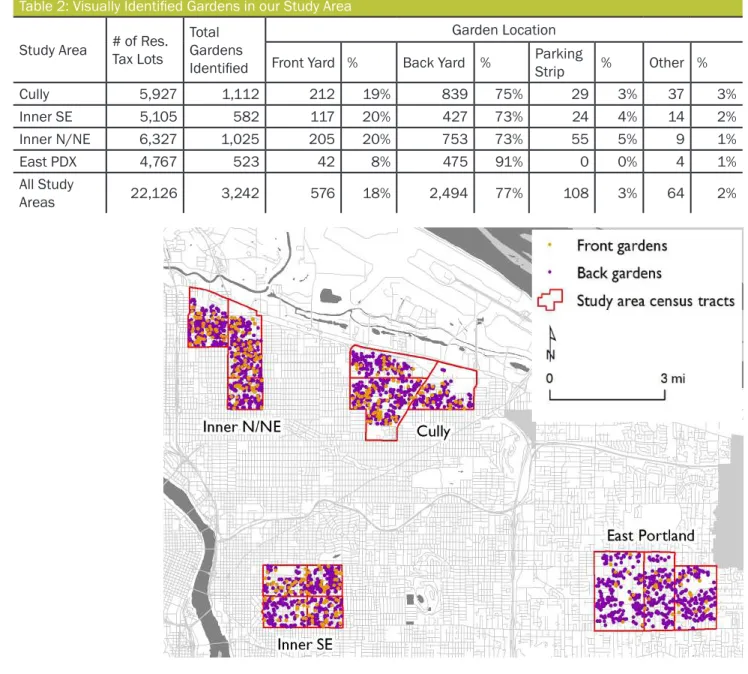
Examining high-resolution aerial imagery from Bing and, in some cases, Google Streetview, we were able to identify the location of gardens within the designated study areas. Garden beds are often identifiable, for example, by the right angles or rectangular shape of planter boxes. After mapping these points, were then able to perform a variety of statistical analyses to identify spatial patterns related to the distribution of gardens in our study areas. In future publications, we plan to compare the mapping results with the survey results presented in this report. The numbers reported here are most likely an undercount, given that highly irregular planting areas, gardens under 1m2 (about 3
x 3 ft), and shaded areas are nearly impossible to identify. As with the survey, however, we underscore that ours is not an effort to inventory all gardens, but rather to identify patterns of interest.
Table 2: Visually Identified Gardens in our Study Area
Study Area # of Res. Tax Lots Total Gardens Identified
Garden Location
Front Yard % Back Yard % Parking Strip % Other %
Cully 5,927 1,112 212 19% 839 75% 29 3% 37 3% Inner SE 5,105 582 117 20% 427 73% 24 4% 14 2% Inner N/NE 6,327 1,025 205 20% 753 73% 55 5% 9 1% East PDX 4,767 523 42 8% 475 91% 0 0% 4 1% All Study Areas 22,126 3,242 576 18% 2,494 77% 108 3% 64 2%
Home Gardeners: Comparing Study Areas
For the rest of this report, we restrict our results for those survey respondents who reported producing food in their home gardens. Comparing study areas within Portland can help us better understand patterns from the mapping portion of the research in greater detail, while revealing the primary motivations behind home gardening, and whether these differ between neighborhoods or populations.
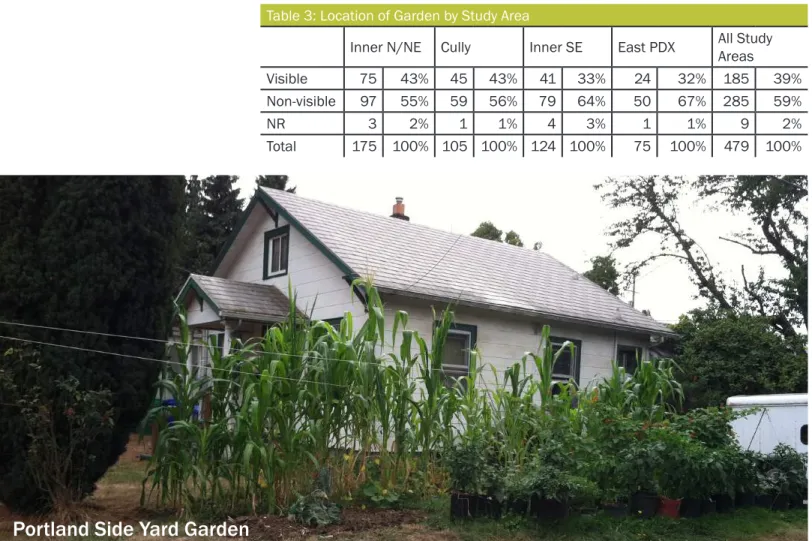
“Spatial contagion” is the idea that similar events tend to cluster geographically. In the case of gardening, people are more likely to establish gardens if there are other gardens visible on their street. This concept may help explain high concentrations of visible gardens in some areas, notably Cully and Inner N/NE.
Across the board, most gardens are not visible from the street (what we call “non-visible” in the table below), meaning they are planted in the backyard rather than in the front yard or parking strip. This can be for many reasons from size constraints to concern about vandalism. Inner NE and Cully had the highest percentages of visible agriculture, 10% higher than the study area counterparts in Southeast.
Garden Location
Table 3: Location of Garden by Study Area
Inner N/NE Cully Inner SE East PDX All Study Areas
Visible 75 43% 45 43% 41 33% 24 32% 185 39%
Non-visible 97 55% 59 56% 79 64% 50 67% 285 59%
NR 3 2% 1 1% 4 3% 1 1% 9 2%
Total 175 100% 105 100% 124 100% 75 100% 479 100%
• Most gardens are
backyard gardens or
are not visible from the
street.
• Home gardens visible
from the street are
most common in Cully
and Inner NE Portland.
Home Gardeners: Comparing Study Areas
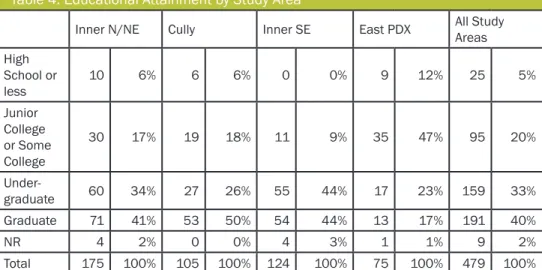
Educational
Attainment
Table 4: Educational Attainment by Study Area
Inner N/NE Cully Inner SE East PDX All Study Areas High School or less 10 6% 6 6% 0 0% 9 12% 25 5% Junior College or Some College 30 17% 19 18% 11 9% 35 47% 95 20% Under-graduate 60 34% 27 26% 55 44% 17 23% 159 33% Graduate 71 41% 53 50% 54 44% 13 17% 191 40% NR 4 2% 0 0% 4 3% 1 1% 9 2% Total 175 100% 105 100% 124 100% 75 100% 479 100%
• Surveyed gardeners
have higher educational
attainment levels
overall
• 40% of surveyed
gardeners have a
graduate degree
Overall, surveyed gardeners have a higher level of educational attainment than the surrounding population. This may be an artifact of response bias; people who respond to surveys, by and large, have completed more formal schooling. That said, there are some interesting trends that characterize who is engaged in gardening. In Cully, for example, where there is a high concentration of commercial urban agriculture due in part to larger lot sizes, half of respondents have graduate degrees, as compared to only 9% of Cully’s overall population.
There are also statistically significant differences in educational attainment between the different study areas. Most respondents with a only a high school education or some college reside in East Portland, while the most with an undergraduate degree reside in Inner SE. These differences mirror differences in educational attainment levels among the overall population in each area (as reported by the US Census), and tend to correlate with income levels. According to our mapping analysis, the share of visible urban agriculture is higher in those areas with higher levels of educational attainment.
People of Color
& Immigrants
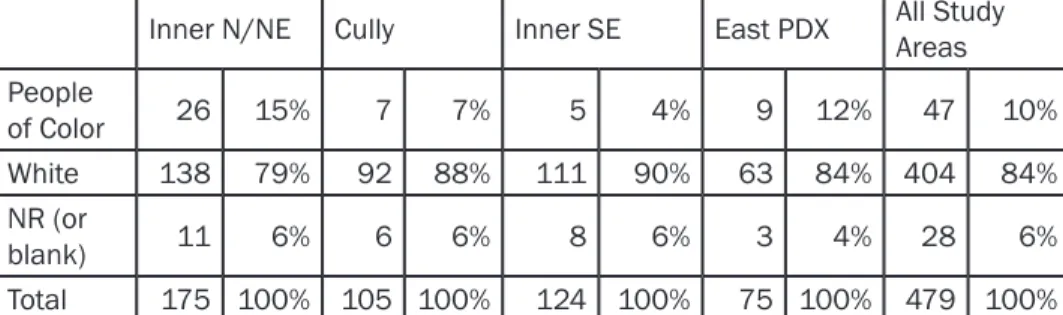
Surveyed gardeners mostly identified as white. Responses from people who identified as people of color mostly came from Inner N/NE and East Portland study areas, but were still vastly underrepresented compared to the overall neighborhood demographics (see table 1). For example, while 36% of Cully residents were people of color in 2015, only 7% of surveyed Cully gardeners identified as people of color.
Immigrants or the children of immigrants also responded in small numbers, only 12% respondents. Immigrant gardeners or their children who garden in East Portland, however, comprised 17% of respondents.
Home Gardeners: Comparing Study Areas
Surveyed gardeners tended to be more affluent than the larger populations in three of our four study areas (Inner N/NE, Inner SE, and Cully). In East Portland study area, however, respondents were overall less affluent than the surrounding population. Respondents with “visible” gardens also tended to be more affluent. Households making between $50,000 and $75,000 were the group with the highest proportion of gardens in the front or side yards.
Table 5: Survey Respondents by Study Area Identifying as People of Color
Inner N/NE Cully Inner SE East PDX All Study Areas People of Color 26 15% 7 7% 5 4% 9 12% 47 10% White 138 79% 92 88% 111 90% 63 84% 404 84% NR (or blank) 11 6% 6 6% 8 6% 3 4% 28 6% Total 175 100% 105 100% 124 100% 75 100% 479 100%
• People of color
are largely
underrepresented
in every study area.
Citywide, people
of color comprise
approximately 22%
of the population,
while only 10% of the
surveyed gardeners
identified as people of
color.
• Many gardeners come
from other countries,
including: Mexico,
Korea, Columbia,
Germany, England,
Canada, Greece, Italy,
and Poland
Table 7: Household Size by Study Area
Inner N/NE Cully Inner SE East PDX All Study Areas
1 24 14% 19 18% 11 9% 12 16% 66 14% 2 65 37% 36 34% 51 41% 25 33% 177 37% 3 43 25% 22 21% 27 22% 20 27% 112 23% 4 23 13% 19 18% 27 22% 11 15% 80 17% 5 to 8 15 9% 5 5% 4 3% 7 9% 31 6% NR 5 3% 4 4% 4 3% 0 0% 13 3% Total 175 100% 105 100% 124 100% 75 100% 479 100%
Household Size
• Most gardeners
reported living in a
2-person household
(37% across all study
areas)
• Inner SE has the highest
proportion of gardeners
living in 4-person
households
In general, household size is important for understanding the context of income levels and the household demand for food. Most gardeners across study areas live in two-person households. Inner SE had the smallest share of single-person households and the largest share of four-person households (which should be considered when observing higher income levels among Inner SE gardeners). Inner N/NE and Inner SE had the highest number respondents living in two-person households.
Home Gardeners: Comparing Study Areas
Table 8: Surveyed Gardeners Living Above or Below the Poverty Line
Inner N/NE Cully Inner SE East PDX All Study Areas
Above 128 73% 81 77% 101 81% 50 67% 360 75% Below 32 18% 18 17% 9 7% 19 25% 78 16% NR 15 9% 6 6% 14 11% 6 8% 41 9% Total 175 100% 105 100% 124 100% 75 100% 479 100%
Poverty
• 75% of surveyed
gardeners live above
the poverty line
• 25% of East Portland
gardeners live below
the poverty line, as
compared to 18% from
Inner N/NE, 17% in
Cully, and 7% in Inner
SE
About three-quarters of those responding to the survey with urban agriculture are above the poverty line, and the rates are even higher for those with front yard gardens (78% above the poverty level). The difference between visible and non-visible gardening is approximately the same for those above and below the poverty line.
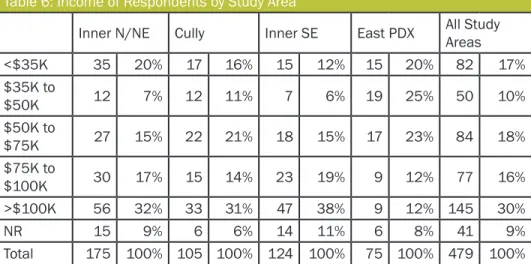
Table 6: Income of Respondents by Study Area
Inner N/NE Cully Inner SE East PDX All Study Areas
<$35K 35 20% 17 16% 15 12% 15 20% 82 17% $35K to $50K 12 7% 12 11% 7 6% 19 25% 50 10% $50K to $75K 27 15% 22 21% 18 15% 17 23% 84 18% $75K to $100K 30 17% 15 14% 23 19% 9 12% 77 16% >$100K 56 32% 33 31% 47 38% 9 12% 145 30% NR 15 9% 6 6% 14 11% 6 8% 41 9% Total 175 100% 105 100% 124 100% 75 100% 479 100%
Income
• Gardeners in East
Portland tended to be
less affluent than the
wider neighborhood
population, while those
in Cully, Inner N/NE,
and Inner SE tended to
be more affluent
However, when considering patterns related to household income, it is important to also consider the size of each household; analysis based on income alone can lead to false conclusions about the resources available to that household – a household income of $100,000, for example, goes farther for a couple with no kids than it does for a household of six. Analyzing responses based on a respondent’s position in relation to a poverty threshold, which is calculated based on household size and income. We used a measure widely used in surveys: 150% of the federal poverty level.
Home Gardeners: Comparing Study Areas
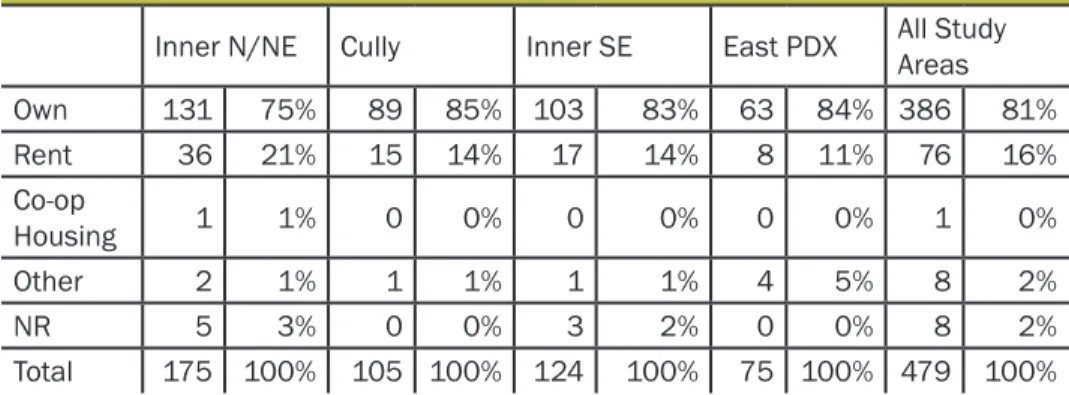
Homeownership appears to be an important predictor of engagement in home gardening. Most survey respondents with urban agriculture own their home – 81% overall. The highest proportion of homeowners were from the Cully study area, while rentership rates were highest in Inner N/NE.
Likely due to this higher rate of rentership, 15% of respondents in Inner N/NE cited “owning my home” as one way to increase their involvement in urban agriculture, significantly higher than in the other study areas.
• 81% of surveyed home
gardeners own their
homes
Housing Tenure
Table 9: Housing Tenure of Surveyed Gardeners by Study Area
Inner N/NE Cully Inner SE East PDX All Study Areas
Own 131 75% 89 85% 103 83% 63 84% 386 81% Rent 36 21% 15 14% 17 14% 8 11% 76 16% Co-op Housing 1 1% 0 0% 0 0% 0 0% 1 0% Other 2 1% 1 1% 1 1% 4 5% 8 2% NR 5 3% 0 0% 3 2% 0 0% 8 2% Total 175 100% 105 100% 124 100% 75 100% 479 100%
Across the study areas, there is not a significant difference between neighborhood and garden size or yield. Generally, most respondents have small gardens that produce less than 25% of their produce consumption (71% of all gardens). In Cully, however, 38% of surveyed gardeners reported growing more than 25% of the produce they consume, double that of Inner SE gardeners (19%). Cully gardens between 500 and 1000 square feet made up the largest share of their gardeners’ responses (43%), significantly larger than average garden sizes in Inner SE and East Portland, and perhaps accounting for the higher contribution to produce needs. As we discuss in a later section of this report, space constraints are a key motivation for joining community gardens.
Garden Yield &
Produce Consumpton
Table 10: Garden Yield by Study Area
Inner N/NE Cully Inner SE East PDX All Study Areas
< 10% 67 38% 28 27% 62 50% 30 40% 187 39% 10-25% 53 30% 36 34% 37 30% 26 35% 152 32% 25-50% 27 15% 23 22% 13 10% 9 12% 72 15% 50-75% 18 10% 12 11% 6 5% 8 11% 44 9% 75-100% 6 3% 5 5% 5 4% 1 1% 17 4% NR 4 2% 1 1% 1 1% 1 1% 7 1% Total 175 100% 105 100% 124 100% 75 100% 479 100%
• Cully gardeners grow
slightly more of the
produce they eat
Home Gardeners: Comparing Study Areas
Only 13% of surveyed gardeners (86 respondents) also own some type of food producing animal or urban livestock (e.g., chickens, bees, goats). The largest proportion of respondents with animals live in East Portland (19%). Overall, most of this group (65 people) have chickens, while 19 have beehives.
Urban Livestock
Table 11: Survey Respondents with Urban Agriculture and Livestock by Study Area
Inner N/NE Cully Inner SE East PDX All Study Areas
Yes 27 15% 14 13% 9 7% 14 19% 64 13%
No 148 85% 91 87% 115 93% 61 81% 415 87%
Total 175 100% 105 100% 124 100% 75 100% 479 100%
• Most study areas
had relatively low
participation in
livestock production,
particularly Inner SE
which reported 7% of
survey respondents
with gardens also
raising livestock.
• The highest rates of
livestock and urban
agriculture are found
in Inner N/NE and
East Portland
What are the primary motivations for home gardening?
Understanding the main motivations and concerns driving residential food production can help policymakers and urban agriculture groups identify ways to support existing practices and find creative solutions to expand interest. Across all of our study areas, the most common reasons given for growing food at home were to have fresh produce and because the activity itself is fun (see Table 12). These reasons were closely followed by “to eat more healthily,” “knowing where my food comes from,” and “to live more sustainably.”
While the average ranking of each motivation appears pretty similar across all of the study areas, there were a few interesting and significant differences. These include:
To Save Money on Groceries - Inner SE ranked this factor much lower than the other 3 neighborhoods, likely because these survey respondents reported the highest household incomes. Conversely in East Portland, where incomes were lowest and poverty rates highest, surveyed gardeners ranked this factor as more important.
To be More Self-Sufficient and/or Self-Reliant - Respondents in Cully and Inner N/NE ranked this factor similarly, and as more important than those in Inner SE. These neighborhoods also had higher rates of livestock ownership than Inner SE.
To Have Enough to Eat - Inner SE ranked this factor significantly lower than other three neighborhoods.
“it is amazing to eat
something you grow” –
Inner SE
“better quality food than
what you can buy at stores,
good hobby” – Cully
“garden therapy, know what
is in our eggs, closer to my
food production” – Inner NE
“I love gardening and
cooking the food I grow” –
Inner NE
“I like to take care of land
and it is a family traditions
to keep a vegetable garden
at home” – Outer SE
“I come from a family of
farmers ... I love gardening
and have done it since I was
little” – Cully
“wanting fresh vegetables,
couldn’t get certain veggies
in store” - Inner NE
“environmentally
responsible, healthier
options, no pesticides” -
Inner SE
Table 12: Motivations for Growing Food (mean score from 1-5)
Inner
N/NE Cully Inner SE East PDX All Study Areas To Have Fresh Produce 4.5 4.4 4.4 4.4 4.4 For Recreation/Fun 4.2 3.8 3.9 4.1 4.0 To Eat More Healthily 4.1 4.0 3.8 3.9 4.0 To Know Where Food is From 4.2 4.0 3.7 3.9 4.0 To Live More Sustainably 4.0 3.8 3.7 3.8 3.9 Increase Self-Sufficiency 3.7 3.8 3.2 3.5 3.6 For the Environment 3.5 3.3 3.2 3.2 3.3 To Save Money on Groceries 3.2 3.2 2.7 3.4 3.1 To Improve Yard Appearance 2.7 2.7 2.4 3.0 2.7 To Connect with Community 2.6 2.8 2.4 2.7 2.6 Preparedness in Crisis or Disaster 2.3 2.2 2.0 2.7 2.3 To Have Enough to Eat 2.0 2.0 1.5 2.2 1.9 To Eat Culturally Specific Food 1.9 1.5 1.5 1.9 1.7 To Earn Money 1.2 1.2 1.1 1.5 1.2
To Earn Money- East Portland ranked this factor significantly higher than the other three study areas, perhaps for the same income-related reasons cited above; however, for all study areas this was the least important motivation for home gardening practices.
To be Prepared in Case of a Crisis or Disaster- East Portland gardeners ranked this as more important than did respondents from the other study areas.
To Know Where My Food Comes From- Inner N/NE respondents ranked this higher.
To Eat Foods Specific to My Culture- East Portland and Inner N/NE ranked this factor highest. These two study areas also had the highest proportion of people of color and immigrants among respondents.
“love the taste and being
able to control what
fertilizer and pesticides to
use” - East Portland
“hobby, enjoyment, wanting
to teach my children,
enjoying the process of
producing it” - Cully
“my parents raised us on
homegrown vegetables. I’ve
always gardened” - Inner SE
“fresh, delicious berries and
herbs. Less expensive and
fresher” - Inner NE
“gardening makes me feel
good, gives me peace” -
Inner NE
“it’s fun, great balance to
work, saves money and
makes sense” - Inner NE
“to grow plants that may
become extinct, or not
available at market” - East
Portland
“it makes me feel like I
have a real home, and
reminds me of the garden
my folks had growing up” -
Inner NE
What would increase home food production?
Similar to understanding individual motivations, hearing from community members about what they would need to increase their production -- or maybe even turn them into a home gardener if they’re not already -- is important when advocating for new policies and resources. Top 4 factors or needs:
More Free Time- This factor was ranked highest for each study area. Across all areas, 53% of respondents chose this as a way to increase food production.
More Skills or Knowledge- Survey respondents ranked having more gardening skills and knowledge as another top factor for increasing food production, particularly in Inner N/NE. This was a less important factor for East Portland, where more respondents chose a tax incentive as a motivating factor.
More Space at Home- This factor was chosen most by respondents in Inner SE (41%) and was chosen by only 23% of respondents in East Portland.
A Tax Incentive- All study areas chose a tax incentive as one of the top five reasons to increase food production.
To increase food
production, gardeners
reported that the following
would help them grow
more food...
• more free time (53%)
• more knowledge (38%)
• more space at home
(35%)
• a tax incentive (31%)
Table 13: Factors to Increase Food Production (by # of households who chose each factor)
Inner N/NE Cully Inner SE East PDX All Study Areas More free time 97 55% 63 60% 67 54% 29 39% 256 53% More skills/ knowledge 77 44% 41 39% 43 35% 22 29% 183 38% More space at home 68 39% 30 29% 51 41% 17 23% 166 35% Tax incentive 63 36% 34 32% 27 22% 24 32% 148 31% Better access to supplies 33 19% 15 14% 16 13% 15 20% 79 16% Nothing 18 10% 9 9% 14 11% 11 15% 52 11% Home ownership 26 15% 6 6% 14 11% 3 4% 49 10% Community garden access 16 9% 4 4% 16 13% 8 11% 44 9% Less regulations 17 10% 7 7% 7 6% 8 11% 39 8% Production profits 15 9% 7 7% 5 4% 5 7% 32 7%
Additional factors or needs:
Better Access to Supplies- Respondents in Inner N/NE and East Portland selected “access to supplies” more than the other two areas.
If I Owned My Home- More residents of Inner N/NE and Inner SE selected home ownership as motivating factor to grow more food, while Cully and East Portland ranked this factor below several others. Access to a Community Garden- Gardeners in Inner SE and East Portland selected “access to a community garden” more than respondents from Cully.
However, the following did not appear to be major factors:
Less Restrictive Regulations- Fewer than 10% of all survey respondents indicated that regulations limited their production. An Opportunity to Make Money from Food Production- Across all study areas, respondents indicated that the opportunity to make a profit was not a major motivation to grow food or increase production. Across all study area respondents who garden, 11% are satisfied with their current level of food production.
Engagement with Urban Agriculture Policy
Impacts of City
Regulations
Table 15: Do City Regulations Impact Your Food Production Practices?
Inner N/NE Cully Inner SE East PDX All Study Areas
Yes 15 9% 3 3% 8 6% 6 8% 32 7%
No 158 90% 102 97% 113 91% 66 88% 439 92%
NR 2 1% 0 0% 3 2% 3 4% 8 2%
• 90% of gardeners
responded that city
regulations have not
affected their food
production practices
Gardeners in Portland engage in multiple ways with local policy and planning that impacts urban food production. Engagement can mean active participation in municipal policymaking via advisory committees, policy councils, or neighborhood associations, or community-based organizations, but it can also mean the various ways in which people connect to policy on the ground, that is, how policies impact their practices. We wanted to gauge the extent to which gardeners were actively engaged in policymaking, as well as the ways that they feel that policies impact them. We also wanted to measure public support for the various kinds of policy and regulations that impact food production.
Participation in Urban
Agriculture or Food Policy
Groups
Table 14: Participation in Urban Agriculture/Food Policy Organizations or Groups
Inner N/NE Cully Inner SE East PDX All Study Areas
Yes 29 17% 16 15% 10 8% 8 11% 63 13%
No 144 82% 89 85% 112 90% 67 89% 412 86%
NR 2 1% 0 0% 2 2% 0 0% 4 1%
• Only 13% of all survey
respondents have
ever participated
in an organization,
association, or agency
that works on urban
agriculture or food
policy.
• Gardeners from Inner
N/NE comprised the
largest proportion of
those actively engaged
Organizations include: Growing Gardens, CSAs, Oregon Food Bank, Portland Fruit Tree Project, Friends of Community Gardens, Zenger Farms, Portland Urban Beekeepers, and Learning Gardens Lab
When asked “Have city regulations affected your food production practices?” a vast majority responded “no”. This suggests that either city regulations do not pose much of a burden on residential food production, or that gardeners feel that the city plays a minimal role in facilitating production, for better or for worse. Among those who replied that city regulations had impacted their production, most issues were related to limits on the amount of livestock (particularly bees and chickens), and restrictions on planting in the parking strip. One respondent raised concerns about soil and air quality and its effect on food – an issue where a lack of city regulation or oversight could affect agricultural production. Other comments regarding city regulation included:
• Neighbors’ complaints about having ducks
• Missed opportunity to plant fruit trees in the parking strip • Limits on raised beds in the parking strip
The Role of the City
Table 17: Survey Respondents Support of Potential City Involvement and Regulation of Urban Agriculture (mean score from 1-5)
Inner N/NE Cully Inner SE East PDX All Study Areas
Pay for Soil Testing for Metals and Toxins 4.3 4.1 4.4 4.2 4.3
Specify Basic Living Standards for Food Producing Animals 4.1 4.2 4.2 4.1 4.1
Use More Open Space for Community Gardens 3.9 4.0 3.9 4.2 4.0
Allow Sales from Community Gardens 3.9 3.8 3.7 3.9 3.9
Lower Property Taxes on Properties Producing Food 3.9 3.8 3.5 4.2 3.8
Allow Sales from Home Gardens 3.8 3.8 3.7 3.8 3.8
Regulate Animal Types 3.6 3.6 3.9 3.7 3.7
Regulate Nuisance 3.4 3.6 3.6 3.5 3.5
Require Permits for Food Producing Animals 2.9 3.0 3.3 3.2 3.0
Prohibit Slaughter 2.9 2.9 2.8 2.9 2.9
Call for City Support of
Urban Agriculture
Table 16: Should the City Encourage or Support Food Production?Inner N/NE Cully Inner SE East PDX All Study AreasYes 198 94% 111 93% 145 97% 83 90% 537 94%
No 12 6% 5 4% 3 2% 6 7% 26 5%
NR 1 0% 3 3% 2 1% 3 3% 9 2%
Total* 211 100% 119 100% 150 100% 92 100% 572 100%
*includes respondents not currently engaged in food production
• 94% of all survey
respondents agree
that the City should
encourage or support
food production.
• Paying for soil testing
for heavy metal
pollution was ranked
with the highest
importance out of a list
of ways for the City to
be involved with urban
agriculture practices.
Almost all survey respondents felt that the City should find ways to encourage and support food production. When asked whether they agree or disagree with the following statements (1=strongly disagree, 5=strongly agree), survey respondents who garden responded in the following ways:
Agree or strongly agree
• Help pay for soil testing for heavy metals and other toxics • Specify basic living standards for food-producing animals • Use more of the open space in parks for community gardens • Allow the sale of produce grown in a community garden • Lower property taxes on properties producing food • Allow the sale of produce grown at home
• Regulate what types of animals people can keep in the city • Regulate nuisances (smells, noise, sight)
Neither agree nor disagree
• Require permits for food-producing animals • Prohibit animal slaughter
• Regulate size and locations of sheds, coops, and greenhouses Disagree
The Role of the City
Other types of City involvement and encouragement, suggested by survey respondents include:
• “Subsidies for people who can provide for food banks”
• “Subsidize waste management company to make cheaper fees for yard debris bins”
• “Allow/encourage people to remove lawns and grow food and native plants instead” • “Classes, cheap starts or seeds”
• “Free consultants to come to home to teach organic gardening”
• “Free soil testing. Encouragement via free workshops. Training on growing techniques”
• “Seed bank, classes, produce swap”
• “Tax subsidies, free programs, educational resources” • “Free veggie starts and compost”
• “PSAs, mailed fliers, mailed education and encouragement”
• “Free/low cost workshops in partnership with community groups. Facilitated seed/ start exchanges”
• “Lower prices on water used for gardens.”
• “Make more community gardens available. Give a tax break on property taxes if there is a food garden on the property”
• “Demonstrations at fairs”
• “Raise limits for number of chickens without having to get a permit”
• “Encouraging the establishment of gardens on unused public and private land” • “Basic classes, subsidize garden beds, communal gardens “coaching,” cooking
classes”
• “Provide opportunity for sharing overflow”
• “It would be nice if the city published growing/raising rules prior to the season. Provide demos for cultivation. Advertise all community growing spaces on websites. Offer incentives to raise bees!”
• “Classes and seed/equipment sharing”
• “We should be able to sign up to get emails about local community gardens” • “Have lower cost cisterns, rain barrels, and composters for sale”
Community Gardens
Where their community
gardens are located:
• Inner N/NE - 13%
• Cully - 8%
• Inner SE - 56%
• East PDX - 9%
• Other areas - 14%
Garden yield:
• Little (<10%) - 7%
• Some (10 - 25%) - 24%
• A lot (25-50%) - 33%
• Most (50-75%) - 16%
• Almost all (75-100%) -
20%
Age of Their Garden Plot
(years):
• 0-2 - 34%
• 3-5 - 30%
• 6-10 - 18%
• 11 or more - 18%
Time commitment (hr/wk):
• 1-2 - 12%
• 2-3 - 16%
• 3-5 - 29%
• 5-7 - 18%
• 8 or more - 25%
An additional survey was circulated to gardeners participating in the City of Portland’s Community Gardens program. Portland has 52 community gardens; at least 20 of them are within 1-mile of a study area. Overall, we received 75 responses from community garden participants, the majority of whom live in Inner Southeast Portland (56% of responses). Similar to the respondents of the first survey, most community gardener respondents were female and middle aged (35-69). A smaller percentage of people under 35 responded to the Community Garden Survey than to the general survey (12% compared to 15%). The typical respondent was more likely to make less than $50,000 a year (56%), live in a detached house that they owned (53%), have a college degree (76%), and be above the poverty line (72%). As this survey was only distributed and conducted in English, we offer the same caveats regarding generalizability of our results as we do above for the mail survey. Results here are representative only of the respondents. Future research will focus on examining the experiences of non-English speaking gardeners; we are currently analyzing focus group and interview data collected from Spanish-speaking gardeners, which we will incorporate into future publications.
Community Gardens - Primary Obstacles
Satisfaction
• Very satisfied - 70%
• Somewhat satisfied -
23%
• Neutral - 5%
• Somewhat unsatisfied -
1%
Involvement in a
food-related organization? :
• Yes - 23%
• No - 77%
Time on Wait List?
• Yes – 59%
• No – 35%
While most respondents indicated that they were satisfied with their community gardening experience (70%), a majority also said they spent time on a waitlist. Lowering wait list time and increasing plot availability were common suggestions to improve and increase involvement in community gardening practices, and to make the opportunity more widely accessible to community members across Portland. Other obstacles to an optimal experience were vandalism and stealing, and a limit to function and capacity due to a lack of volunteers, organization, or funding.
Table 18: Primary Obstacles (mark all that apply)
Vandalism and stealing 21 28%
Need for volunteers 15 20%
Lack of organization 12 16%
Lack of funding 11 15%
Poor soil quality 11 15%
Lack of access to resources 6 8%
Conflicts between gardeners 5 7%
Other 33 44%
We received a variety of comments in response to this question. We have listed some of them here:
• “More get-togethers with fellow gardeners”
• “Better communication/consultation with the garden program coordinators”
• “Better communication when public goods are delivered like burlap bags, compost, mulch”
• “Common greenhouse or hoop house to encourage year round gardening”
• “Communication between gardeners is problematic”
• “More help with larger projects for the garden as a whole outside of individual plots (i.e. organizing work parties to build enthusiasm, more leadership)”
• “Plots that aren’t in the shade” • “Less big brother-y”
• “No more added requirements for volunteering” • “More social opportunities”
• “Classes on year round gardening and rotations of crops”
• “Partnering with more places to provide additional locations. (and to reduce wait list times)”
• “Shorter time on the wait list and more room” • “More commitment from other gardeners” • “Problem taking away trash”
• “Better quality free compost”
What would improve
their experience as
a community garden
member?
• “More room for growing berries”
• “More ADA plots and firmer paths to the entrance and ADA plots. Current gravel makes it hard for mobility devices”
• “Have others weed their plots, have neighbors not take produce, plots turn over frequently”
• “More community garden events”
• “Receiving a ready plot. Had to spend personal dollars to rehab the older plot that was received”
Motivations & City Support
Community Gardens
Similar to the original survey, soil testing for heavy metal pollution was considered to be an important way to the City to support community gardening. Creating more gardens through transformation of parks open space was another top way the City could increase support of community agriculture.
Table 19: Average Ranking of Suggested Ways to Increase City Support of Community Gardening (Scale of 1-5)
Pay for Soil Testing for Metals and Toxins 4.4
Use More Open Space for Community Gardens 4.2
Specify Basic Living Standards for Food Producing Animals 4.1
Lower Property Taxes on Properties Producing Food 3.7
Allow Sales from Home Gardens 3.4
Regulate Nuisance 3.3
Regulate Animal Types 3.3
Require Permits for Food Producing Animals 3.0
Allow Sales from Community Gardens 2.9
Prohibit Slaughter 2.6
Regulate Size and Locations of Sheds, Coops, Greenhouses 2.6
Community Gardens: Motivations & City Support
Table 20: Average Ranking of What Motivates Growing Food in Community Gardens (Scale of 1-5)
To Have Fresh Produce 4.6
To Know Where the Food Comes From 4.5
To Eat More Healthily 4.4
To Live More Sustainably 4.4
For Environmental Reasons 4.1
To Be More Self-Sufficient or Self-Reliant 4.0
For Recreation/Fun 3.9
To Save Money on Groceries 3.6
To Connect with Community 3.2
To Be Prepared in Crisis or Disaster 2.6
To Have Enough to Eat 2.5
To Make the Neighborhood Look Nice 2.3
To Eat Culturally Specific Foods 2.0
To Earn Money 1.2
The highest ranked motivations for community gardeners’ food production were similar to those of home gardeners – the enjoyment of growing fresh produce, the intimate knowledge of where the food came from, the healthy exercise and product, and the connection with the environment. An additionally common response was that there was a lack of space at home.
Other motivations for food production • “To teach my child how to garden”
• “Gardening helps my depression and anxieties and gets me out of the house”
• “Pure enjoyment, contribute food to charity”
• “Because I don’t have a backyard or growing space of my own” • “To get outside”
• “It provides me a place to ‘be.’ I feel important and needed. I can go just relax.”
• “Exercise, to be outdoors!”
Should the City encourage or support more community gardens? • 72 out of 75 surveys say “YES”
What kind of encouragement and/or support should the city provide? Many of these revolved around decreasing wait times and increasing access to more garden spaces throughout the city.
• “More community gardens for people”
• “Encourage more residents to join gardens in their area”
Why did you or your
household begin growing
food in a community
garden?
• “no garden space at
home”
• “enjoying eating organic
and fresh vegetables”
• “grow food for family”
• “access to tasty organic
vegetables”
• “joy and enjoyment”
• “for additional
gardening space”
• “important family
tradition”
• “for friendship and
community”
Community Gardens: Increasing Production
• When asked about
factors that would spark
more food production,
community gardeners
responded similarly to
those of the original
survey – it boils down to
needing more free time.
• Having more space is
another shared factor
between both surveys.
However, community
gardeners ranked
having additional space
at home higher than
home gardeners (43%
and 35% respectively).
Table 21: What Would Help You Produce More Food? (mark all that apply)
More free time 32 43%
More space at home 32 43%
More space at CG 27 36%
More skills/knowledge 15 20%
Tax incentive 11 15%
Home ownership 10 13%
Less growing restrictions 10 13%
Better access to supplies 9 12%
Production profits 6 8%
Nothing 6 8%
Some recommendations based on the question “Is there anything that could improve your experience as a community garden member?”
1. Locate opportunity sties for community garden infill. Decrease waitlist times and increase overall supply.
2. Promote increased accessibility and inclusion for diverse populations.
3. Expand opportunities for outreach, teaching, learning, and access to high quality resources.
4. Better communication amongst gardeners and between gardeners and program coordinators.
5. Increased social opportunities and community building.
• “More mulch and compost and many more gardens so there isn’t a waiting list”
• “More gardening opportunities in disadvantaged areas”
• “As Portland’s density increases, the city should own more spaces for community gardens and provide garden plots at a reasonable cost, as well as providing gardening education. Food literacy and sustainability is important.”
• “More people should know about the program.”
• “Support in the way of more permanent land…an increase in gardens in the areas closer to more people…the ones close in don’t seem to meet demand”
• “Increased information and outreach to immigrant and non-English speakers”
Preliminary Conclusions & Recommendations
To conclude, food production in Portland is widespread in our four study areas, with a significant portion of the population engaged in producing at least some of the food they eat. Most people grow their own food in order to have access to fresh produce and simply for the pleasure of doing so, that is, for recreation or fun. Other primary motivations included eating more healthily and knowing where food comes from. Wanting to live more sustainably was also important, but as a motivation was limited to more affluent respondents with higher levels of educational attainment.
Support for the City of Portland’s role in encouraging and supporting urban agriculture appears to be strong. Moving forward, we suggest that policymakers consider the motivations we have listed here when considering how best to foster community participation or frame discussion about urban food production. Despite Portland’s global renown for sustainability planning, framing issues in terms of environmental concerns or sustainability may not resonate with everyone, whereas framing issues in terms of motivations that appear to be more universal – fun, freshness, and healthy eating – may prove more fruitful for policymakers and planners, and may lead to more active community engagement in public policymaking and planning efforts. More specifically, we offer the following suggestions for ways to support home gardeners:
1. Expand learning opportunities for interested gardeners
2. Establish garden tool libraries to increase access to resources and supplies.
3. Continue support of non-profits and community groups focused on gardening.
4. Provide or subsidize soil tests, particularly in neighborhoods affected by pollution.
5. Provide tax incentives for food production practices.
To better support community gardeners, we suggest the following: 1. Continue to identify potential sites and establish new community
gardens in order decrease wait times and increase the overall number of plots.
2. Continue and expand outreach efforts to historically underserved groups, lower income Portlanders, and renters.
3. Expand educational opportunities within community gardens and the Community Gardens program.