Open Archive TOULOUSE Archive Ouverte (OATAO)
OATAO is an open access repository that collects the work of Toulouse researchers and
makes it freely available over the web where possible.
This is an author-deposited version published in :
http://oatao.univ-toulouse.fr/
Eprints ID : 11496
To link to this article : DOI : 10.1177/0959683609104027
URL :
http://dx.doi.org/10.1177/0959683609104027
To cite this version :
De Vleeschouwer, François and Piotrowska,
Natalia and Sikorski, Jaroslaw and Pawlyta, Jacek and Cheburkin,
Andriy and Le Roux, Gaël and Lamentowicz, Mariusz and Fagel,
Nathalie and Mauquoy, Dmitri Multiproxy evidence of `Little Ice
Age' palaeoenvironmental changes in a peat bog from northern
Poland. (2009) Holocene, vol. 19 (n° 4). pp. 625-637. ISSN
0959-6836
Any correspondance concerning this service should be sent to the repository
administrator:
[email protected]
et al., 2002a; Barber et al., 2003) and palynological (eg, Anshari et al., 2001; Davis et al., 2003; Finsinger et al., 2006) proxies.
However, climatic fluctuations during the last millennium have been rarely characterized using inorganic geochemistry (eg, Shotyk et al., 1998; Kylander et al., 2007). In addition, multiproxy analyses of northeastern European peat deposits, which include inorganic geochemistry, are scarce (eg, Lukashev et al., 1974; Twardowska et al., 1999; Vile et al., 2000; Novak et al., 2003; Mihaljevic et al., 2006; Syrovetnik et al., 2007).
Introduction
Recent studies have demonstrated the potential of ombrotrophic bogs to record past pre-industrial fluctuations of elements during the Holocene (eg, Kylander et al., 2005, 2007). Other studies have assessed the potential of peat bogs to record past climatic fluctua-tions during the last c. 3000 years using botanical (eg, Mauquoy
Abstract: ‘Little Ice Age’ (LIA) climatic deteriorations have been abundantly documented in various archives
such as ice, lake sediments and peat bog deposits. Palaeoecological analyses of peat samples have identified these climatic deteriorations using a range of techniques, for example palynology, plant macrofossils, testate amoebae or carbon isotopic analyses. The use of inorganic geochemistry and the reconstruction of dust fluxes has remained a challenge in tracing the nature of LIA climatic changes. Although the idea of enhanced erosion conditions and storminess is commonly discussed, the conditions for dust deposition in peatlands over Europe during the LIA are rarely favourable, because the natural forest cover over Europe was much more important than nowadays, pre-venting dust deposition. This intense forest canopy masks the deposition of dust in peatlands. In northern Poland,
near the Baltic shore, the Słowin´skie Błota area was deforested aroundAD1100, ie, just before the LIA, and
there-fore constitutes a key area for the reconstruction of LIA climatic change. With the support of a well-constrained chronology, climatic fluctuations are recorded in an ombrotrophic bog using inorganic geochemistry, plant macro-fossils and carbon isotopic analyses. The reconstruction of LIA climatic changes is in good agreement with other records from Poland and NE Europe. However, a c. 50-year discrepancy can be observed between various records. This discrepancy is possibly due to progressive time-dependent cooling gradient from north to south Europe.
Key words: Peat, multiproxy, ‘Little Ice Age’, geochemistry, stable isotopes, radiocarbon, lead 210, last
mil-lennium, Poland.
10.1177/0959683609104027
*Author for correspondence (e-mail: [email protected]
Multiproxy evidence of ‘Little Ice Age’
palaeoenvironmental changes in a peat
bog from northern Poland
François De Vleeschouwer,
1,2
* Natalia Piotrowska,
2
Jarosław
Sikorski,
2
Jacek Pawlyta,
2
Andriy Cheburkin,
3
Gaël Le Roux,
1
Mariusz Lamentowicz,
4
Nathalie Fagel
1
and Dmitri Mauquoy
5
(
1AGEs: Argile, Géochimie et Environment sédimentaires, Geology, Univesity of Liège, Allée du 6
Août, B18, Sart Tilman, B-4000 Liège, Belgium;
2Silesian University of Technology, Institute of
Physics, Department of Radioisotopes, GADAM Centre of Excellence, Krzywoustego 2, 44-100
Gliwice, Poland;
3Institute of Environmental Geochemistry, University of Heidelberg, Im Neuenheimer
Feld 236, B-69120 Heidelberg, Germany;
4Department of Biogeography and Palaeoecology, Institute
of Palaeogeography and Geo-ecology, Adam Mickiewicz University, Dzie¸gielowa 27, 61-680 Poznan,
Poland;
5Geography & Environment, School of Geosciences, University of Aberdeen, Elphinstone
Road, Aberdeen AB24 3UF, UK)
The climate of the last millennium is characterized by a warm period known as the ‘Medieval Warm Period’ (MWP) between
c.AD1000 and 1300. It is followed by a series of climatic
deteri-orations between c. AD1300 and 1800, the so-called ‘Little Ice
Age’ (LIA). The causes of these climatic deteriorations may be due to changes in solar activity (van Geel et al., 1999; Mauquoy
et al., 2004). Cold periods coincide with solar activity minima, as
recorded by low sunspot numbers (Stuiver and Braziunas, 1993). During periods of reduced solar activity there is an increased pro-duction of14C, as there is less solar magnetic shielding against cosmic rays (van Geel et al., 1999). The∆14C is thus anti-corre-lated with the number of sunspots. The highest∆14C values are observed during cold periods. Climatic deteriorations during the LIA have been investigated using various archives, for example, ice cores (eg, O’Brien et al., 1995; Dahl-Jensen et al., 1998), lake sediments (eg, Blass et al., 2007; Haltia-Hovi et al., 2007) and
peat deposits (eg, Mauquoy et al., 2002a). These climate recon-structions record several periods of climatic deteriorations, namely the Wolf (AD 1300–1380), Spörer (AD 1420–1470) Maunder (AD1645–1715) and Dalton (AD1790–1820) minima.
However, it remains challenging to attempt tracking these rapid climatic changes using peat inorganic geochemistry, a tool that has been abundantly used to reconstruct past human activities.
Pomeranian Baltic bogs are located on the Southern edge of the cupola-like raised bog area of Europe (Osvald, 1923, 1925; Kulczyn´ski, 1949). Palaeoenvironmental high-resolution multi-proxy studies on these mires are very rare in NE Europe. Most of the previous research has focused on past vegetation changes (Wodziczko and Thomaschewski, 1932; Otłuszewski, 1948; Otłuszewski and Borówko, 1954; Szafran´ski, 1961; Latałowa and Pedziszewska, 2003). The investigation of Herbichowa (1998) provided a Holocene record of local vegetation and basic geo-chemistry of Słowin´skie Błota bog and Staniszewskie bog. In addition, recent investigations using a multiproxy approach are currently in progress (Lamentowicz et al., 2009).
This paper attempts to use the atmospheric soil dust flux (ASD) derived from titanium concentration of a peat record to reconstruct the possible climatic events during the last millennium in northern Poland. Other proxies (carbon stable isotopes and macrofossils) and accurate age dating are also used in order to tentatively picture the various phases characterizing this cold period. Special atten-tion is given to the environmental condiatten-tions inferred by the vari-ous proxies during the LIA. A comparison with other records from this peat bog and with records over Europe allows us to draw a sketch of the LIA synchroneity over northeast Europe.
Site description
Słowin´skie Błota bog is located 8 km to the southeast of Darłowo city, and 10 km away from the Baltic Sea (Figure 1 top). Up to the end of eighteenth century, Słowin´skie Błota bog had been an open bog (ie, not covered by trees). It has been drained twice: (1) in 1880 when sur-rounding ditches were dug and (2) in 1970 when two ditches were dug through the central part of the bog. The latter were renewed in 1985 (Herbichowa, 1998). The actual vegetation is composed of sev-eral species of Sphagnum. In the outer parts, Vaccinium uliginosum,
Calluna vulgaris and Betula pubescens are present (Figure 1 bottom).
Methods
Coring and subsampling
A 1 m core (SL4) was retrieved from the central part of the bog (Figure 1 bottom), but away from the 1970 drainage ditches, using a stainless steel 10 cm × 10 cm Wardenaar corer (Wardenaar, 1986). The core was then wrapped in plastic bags and stored in a fridge. The edges of the core were removed to avoid any metal contamination by the corer. The remaining core was then sliced into 1 cm thick samples using a titanium knife. Each sample was stored in a plastic bag. In this study, we present various proxies obtained on SL4: macrofossils, inorganic geochemistry, δ13C, radiocarbon and lead dating. They are compared with selected water-table change indicators from a second core (SL2) retrieved in the same bog, 10 m away from SL4. SL2 has also been dated and analysed for biological proxies such as pollen, macrofossils and testate amoebae by Lamentowicz et al. (2009).
Chronological control
210Pb analyses
Polonium was extracted from 2 g of dry peat powder using a sequential H2O2-HNO3-HCl digestion. To control efficiency of
Figure 1 Top. Site location and surrounding eastern European Pb-Zn ore (light grey) and coal (dark grey) basins (after Bibler et al., 1998; Mukai et al., 2001). Bottom. Peatland preservation indices based on stereoscopic aerial photographs (after Herbichowa, 1998). 1, open peatland complex of Sphagno-tenelli- Rhynchosporetum albae, Sphagnetum magellanici typicum and <5% single dwarf pines of c. 2 m high; 2, open Sphagnetum magellanici pinetosum peatland with more densely (max.10%) distributed pines of 2 to 5 m high; 3, small patches of open Sphagnetum magellanici pinetosum peatland with ini-tial state of Vaccinio uliginosi-Pinetum, small patches of Sphagnetum magellanici typicum and sparse pine of 4 to 8 m high; 4 (4+5), 8 m to 20 m high pine and birch-pine cover (50% to 80%) tree (Vaccinio uliginosi-Pinetum and Betuletum pubescentis); 5, community with Calluna vulgaris on dried peat; 6, degenerated form of alder and young pine forest; 7, meadow and pasture communities (class Molinio-Arrhenatheretea) on humified peat; 8 (9+10), deciduous for-est meadow communities from Molinio-Arrhenatheretea class on mineral soils; 9, initial stage of development of peatland vegetation and young forest planted in remnants of peat exploitation; 10, anthro-pogenic vegetation (ie, recent); 11, active ditches
0 500m 1983 1 2 3 4 5 6 7 8 9 10 11 200 km Poland Lithuania Russia Latvia Ukraine Czech Rep. Germany Slovakia Austria Bielarus Russia N SL4 N Slowinskie Blota
deposition and alpha detection, a portion of HCl containing a known amount of artificial208Po was added before evaporation and deposition on a silver disc. Efficiency of deposition up to 80% was commonly achieved.
Alpha activity was measured with a spectrometer Canberra model 7401, with a surface-barrier Si semiconductor detector. The sensitive area of the detector is 300 mm2and its energy resolution is 20 keV. This enables a good separation of 210Po (E = 5.308 MeV) and208Po (E= 5.105 MeV) peaks. As absolute activities of both isotopes are rather low, each measurement lasted two days in order to obtain sufficient accuracy. The results of the calculation were corrected for radioactive decay of208Po since the moment of its calibration, and decay of210Pb since the moment of polonium extraction from sediments.
The Constant Rate of Supply (CRS) model (Appleby, 2001) was applied in order to build the210Pb age model. The activity of autigenic210Pb is assumed to be constant along the sediment col-umn. It is determined by measurements on sediments old enough
to contain no allochthonous210Pb. The activity of allochthonous lead is then calculated by subtracting the activity of autigenic lead from the total lead activity. Uncertainties were calculated using the propagation of errors technique according to ISO, Guide to the
expression of uncertainty in measurement. Results are
summa-rized in Table 1.
14C dating
Macrofossils were carefully selected from eight peat samples of SL4, after soaking in mQ water and transfer in a Petri dish, fol-lowing the protocol developed by Kilian et al. (1995) and Mauquoy et al. (2004). In this way only the parts of aboveground plants were selected for14C dating. Young carbon contamination by downward growing rootlets was therefore prevented. In the samples from Słowin´skie Błota, the main macrofossils collected were Sphagnum spp. stems and opercula, Calluna vulgaris stems,
Erica tetralix stems and inflorescences and Andromeda polifolia
leaves (Table 2). Charcoal fragments and some seeds were also
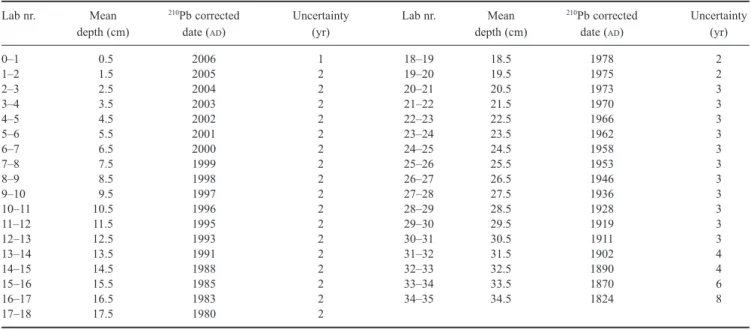
Table 1 Results of210Pb analysis
Lab nr. Mean 210Pb corrected Uncertainty Lab nr. Mean 210Pb corrected Uncertainty
depth (cm) date (AD) (yr) depth (cm) date (AD) (yr)
0–1 0.5 2006 1 18–19 18.5 1978 2 1–2 1.5 2005 2 19–20 19.5 1975 2 2–3 2.5 2004 2 20–21 20.5 1973 3 3–4 3.5 2003 2 21–22 21.5 1970 3 4–5 4.5 2002 2 22–23 22.5 1966 3 5–6 5.5 2001 2 23–24 23.5 1962 3 6–7 6.5 2000 2 24–25 24.5 1958 3 7–8 7.5 1999 2 25–26 25.5 1953 3 8–9 8.5 1998 2 26–27 26.5 1946 3 9–10 9.5 1997 2 27–28 27.5 1936 3 10–11 10.5 1996 2 28–29 28.5 1928 3 11–12 11.5 1995 2 29–30 29.5 1919 3 12–13 12.5 1993 2 30–31 30.5 1911 3 13–14 13.5 1991 2 31–32 31.5 1902 4 14–15 14.5 1988 2 32–33 32.5 1890 4 15–16 15.5 1985 2 33–34 33.5 1870 6 16–17 16.5 1983 2 34–35 34.5 1824 8 17–18 17.5 1980 2
Table 2 Description of samples chosen for14C AMS dating and results of measurements and calibration
Lab no. Sample depth 14C age 95.4% age interval Sample composition
(cm) (BP)
GdA-1097 34.5 ± 0.5 200 ± 30 1741–1857* Sphagnum spp. branches and opercula, Erica tetralix inflorescence
GdA-1088 36.5 ± 0.5 95 ± 25 1683–1738 Sphagnum spp. branches and opercula, Calluna vulgaris branches,
Erica tetralix inflorescence, seeds
GdA-1098 43.5 ± 0.5 455 ± 30 1416–1480 Sphagnum spp. branches and opercula, Calluna vulgaris branches and
leaves, Erica tetralix inflorescence, Andromeda polifolia leaves, charcoal, seeds
GdA-1099 52.5 ± 0.5 875 ± 40 1165–1261 Sphagnum spp. branches and opercula, Calluna vulgaris branches
and leaves, Erica tetralix inflorescence, charcoal
GdA-1100 57.5 ± 0.5 935 ± 30 1084–1176 Sphagnum spp. branches and opercula, Calluna vulgaris branches and
leaves, charcoal
GdA-1089 68.5 ± 0.5 1055 ± 30 974–1026 Sphagnum spp. stems
GdA-1090 79.5 ± 0.5 1130 ± 30 862–956 Sphagnum spp. stems
GdA-1091 97.5 ± 0.5 1230 ± 30 675–797 Sphagnum spp. stems
* Calibrated age range obtained as a result of summarizing distribution of probability of calibrated age and210Pb-derived age, assuming Gaussian
collected when other plants were not present in sufficient quantities for14C AMS. Before measurement, samples were pre-treated using an acid-alkali-acid washing sequence in order to remove any car-bonate, bacterial CO2and humic/fulvic acids. The graphite targets were produced according to a protocol used in the Gliwice Radiocarbon Laboratory (Goslar and Czernik, 2000). 14C meas-urements were performed at Poznan Radiocarbon Laboratory (Poland) following the protocol described by Goslar et al. (2004). X-ray fluorescence
Forty-one samples were selected along SL4 core for XRF analy-sis. Samples were freeze-dried and then powdered in an automatic agate mortar (400 rpm, 1 h). One gram of the resulting powder was analysed for selected elements at the Institute of Environmental Geochemistry (Heidelberg, Germany). Energy-dispersive Miniprobe Multielement Analyzer EMMA (Cheburkin and Shotyk, 1996)
was used to analyse Br, Rb, Sr and Zr while energy dispersive XRF spectrometer TITAN (Cheburkin and Shotyk, 2005) was used to analyse minor elements Cl, K, Ca and Ti. The two analy-sers are calibrated with various organic international standards: coals (NIST1632b, NIST1635, SARM19 and SARM 20) and plant material (NIST 1515, NIST 1547, NIST 1575, BCR60 and BCR 62). The results, detection limits and uncertainties are given in Table 3.
Plant macrofossils
Plant macrofossil samples from SL4 were boiled with 5% KOH and sieved (mesh diameter 125µm). Macrofossils were scanned using a binocular microscope (×10–50), and identified using an extensive reference collection of type material (Mauquoy and van Geel, 2007). Volume percentages were estimated for all components with the exception of seeds, Eriophorum vaginatum spindles,
Table 3 Elemental geochemistry on dry bulk samples
Mean Mean Mean Age Unc. Cl K Ca Ti Fe Br Rba Sr Zra
depth density acc. rate cal. cal. (ppm) (ppm) (ppm) (ppm) (ppm) (ppm) (ppm) (ppm) (ppm)
(cm) (g/cm³) (cm/yr) 4.5 0.023 0.830 2002 3 611 2836 4316 36 851 12.8 5.44 8.77 D.L. 5.5 0.024 0.826 2001 2 408 1820 2628 32.36 490 13.1 4.22 6.47 D.L. 6.5 0.024 0.973 2000 2 390 1850 2539 27.3 622 13.7 3.78 6.51 D.L. 7.5 0.024 1.120 1999 2 452 1493 1657 34.9 574 12.1 3.37 5.34 D.L. 8.5 0.027 1.024 1998 2 380 1330 1472 35.1 677 16.1 3.06 5.51 D.L. 9.5 0.03 0.883 1997 2 421 1237 1065 38.7 718 17.3 3.71 5.89 D.L. 10.5 0.032 0.590 1996 2 487 1411 1113 69 1024 14.8 2.52 4.94 D.L. 13.5 0.057 0.369 1991 2 455 1084 802 31.6 1521 21.3 3.22 8.16 D.L. 16.5 0.056 0.429 1983 3 380 923 1209 62.8 6635 29.3 3.8 16 4.11 18.5 0.05 0.358 1978 3 301 766 1134 57.7 6949 27.9 3.73 15.4 D.L. 21.5 0.044 0.275 1970 3 328 659 1310 81 5382 28.92 2.71 17.5 3.58 23.5 0.047 0.176 1962 3 278 621 1207 95.3 5181 31.3 3.39 17.7 4.13 26.5 0.065 0.117 1945 3 262 770 1250 244 3901 33.5 4.46 21.4 13.7 29.5 0.066 0.095 1920 3 307 1148 1024 272 2840 59.3 5.41 18.1 21.4 32.5 0.065 0.029 1888 5 330 748 895 138 1996 42 1.88 12.3 9.32 34.5 0.058 0.020 1820 41 205 615 772 155 2021 23.1 2.86 11.7 12.9 36.5 0.071 0.022 1719 31 309 1171 943 376 2248 35.2 6.56 19.1 35.5 38.5 0.116 0.026 1627 29 405 980 807 353 1634 45.1 5.59 17 35.6 41.5 0.101 0.031 1512 31 645 511 696 206 1152 56.8 2.95 11.7 19.7 43.5 0.141 0.033 1447 32 802 423 656 180 1139 67.3 2.38 10.8 16.1 45.5 0.149 0.036 1387 35 881 258 708 148 1231 59 1.34 11.4 14.2 47.5 0.126 0.036 1331 39 884 223 795 138 1057 60.1 1.55 13.1 16.4 51.0 0.05 0.073 1234 46 625 130 853 56 1306 54.6 D.L. 11.2 D.L. 52.5 0.048 0.054 1214 47 477 96.4 901 34.3 1183 37.5 D.L. 11.1 D.L. 54.5 0.045 0.063 1177 47 362 92 855 42.5 1229 36.6 D.L. 12 D.L. 57.5 0.03 0.071 1129 45 294 84.1 801 23.6 1319 32 D.L. 11.5 D.L. 59.5 0.033 0.077 1101 42 413 109 1137 60.1 1318 38.9 D.L. 14.47 2.6 61.5 0.031 0.089 1075 39 439 97.6 1260 38.5 1635 39.2 D.L. 15.3 D.L. 66.5 0.035 0.103 1019 30 348 94.1 1007 23.3 1505 28.1 D.L. 12.6 D.L. 68.5 0.031 0.114 1000 27 285 92 885 18.9 1271 24.3 D.L. 10.8 D.L. 71.5 0.032 0.122 974 32 374 102 1087 20.2 1332 25.8 D.L. 12.1 D.L. 73.5 0.035 0.126 957 36 433 95.2 923 32.5 880 30.8 D.L. 11.1 D.L. 77.5 0.028 0.122 925 43 406 93.5 907 22.4 1336 34 D.L. 11.4 D.L. 79.5 0.028 0.116 909 46 406 98.9 772 25.5 1026 33.7 D.L. 8.51 D.L. 82.5 0.037 0.110 883 49 366 101 837 28.3 842 33.7 D.L. 8.02 D.L. 84.5 0.04 0.106 865 51 354 103 663 32.5 735 35.5 D.L. 8.08 D.L. 86.5 0.04 0.104 846 52 441 113 721 37.1 749 44.9 D.L. 8.52 D.L. 88.5 0.028 0.101 827 54 438 104 689 30.4 679 42.3 D.L. 7.87 D.L. 91.5 0.024 0.099 797 56 462 103 684 34.5 505 37.3 D.L. 8.08 D.L. 95.5 0.031 0.098 757 59 419 112 746 34.9 688 37.6 D.L. 8.32 D.L. 97.5 0.025 0.098 736 60 413 101 720 22.5 651 33.4 D.L. 6.97 D.L. Uncertainty (%) 10 10 3 7 7 5 5 5 10 LLD 30 2.5 1.5 0.9 0.9 0.6 0.8 1 2.5 a
Sphagnum spore capsules, Meliola ellisii (Type 14) fruit-bodies
and charcoal particles, which were counted and expressed as the number (n) present in each subsample. Zonation of the macrofos-sil diagrams was made using psimpoll 4.25 (optimal splitting by information content).
Stable isotopes
Samples for isotopic investigations were taken at each centimetre of the SL4 peat monolith. Each sample was washed in distilled water. Then one Sphagnum stem was selected from each sample using low-power microscopy. Loader et al. (2007) reported statis-tically significant differences between the carbon isotopic compo-sition of bulk organic material in pendant leaves, branch leaves and stems of growing Sphagnum. Therefore all the leaves, if pres-ent, were carefully removed. Then, stems were dried in an oven at 50°C. Because isotopic composition of carbon in bulk organic material closely follows the isotopic pattern measured in α-cellu-lose and nitrocelluα-cellu-lose (Ménot-Combes et al., 2004; Skrzypek
et al., 2007), all the measurements were performed on bulk
organic material of Sphagnum stems. Fragments of stems weigh-ing about 50µg were used for each measurement. The samples were packed in tin capsules and combusted in the EuroVector EuroEA3000 elemental analyser at 1020°C. The resulting gases were separated by the gas chromatography method and CO2was transferred to a GV Instruments IsoPrime isotope ratio mass spec-trometer. The δ13C values are expressed in ‰ VPDB with an uncertainty equal or better than 0.22‰.
Results
OmbrotrophyLow strontium values have already been used to indicate the ombrotrophy of peat deposits (eg, Shotyk et al., 2002; De Vleeschouwer et al., 2007), ie, bogs that are exclusively fed by atmospheric inputs (eg, rain, snow, fog, dust). In Słowin´skie Błota, Sr values below 20 ppm (Table 3) indicate the ombrotrophic nature of the entire 1 m peat profile. The plant macrofossils (see Figure 4) also consistently indicate the presence of acidic, nutrient-poor con-ditions characteristic of ombrotrophic peat bogs.
Age–depth relationship
Calibration of radiocarbon dates was undertaken using the IntCal04 calibration curve (Reimer et al., 2004) and OxCal 4.0 software (Bronk Ramsey, 1995, 2001). A priori information from the 210Pb-derived ages was used in a P-sequence model (Bronk Ramsey, 2008). The results of calibration are summa-rized in Table 2.
From the base of the core to 34.5 cm depth,14C was used to build an age–depth model. For the sample from depth 34.5 cm the probability distribution of calendar ages obtained with both 210Pb and14C methods were combined, resulting in the interval
AD1741–1857. Above 34.5 cm the results of210Pb dating were
used.
For building the age–depth model a non-linear approach (gen-eralized additive model, GAM) was used, as described by Heegaard et al. (2005). The calculations were performed within each period on the middle-point of the 95.4% range of calibrated age, while an uncertainty equal to the half of this range was assumed. The results of 210Pb dating are described by Gaussian distribution and in their case the 1-sigma range was used. On the depth scale, the resulting age–depth relationship provides a mean age and an age range for each slice of peat (Figure 2).
From the base (c.AD675–800) of the core to 52.5 cm depth (c. AD1065–1260), the mean peat accumulation rate is rather high
(mean= 1 mm/yr). Then, the mean accumulation rate decreases towards 0.3 mm/yr from 52.5 cm depth (c.AD1065–1260) to 34.5
cm depth (AD1740–1860). For the samples between 34.5 and 0 cm
depth, the mean accumulation rate is higher, and reflects the fresh, uncompacted nature of the acrotelm peat deposits.
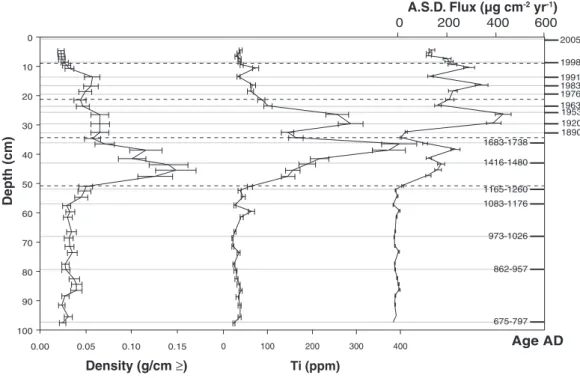
Bulk density, Ti concentration and atmospheric soil dust flux
The bulk density and Ti profiles record small variations from the base of the core to 50 cm depth (Figure 3). Then a sharp peak in bulk density occurs between 50 and 35.5 cm depth. Peak values in the Ti profile also occur in the same depth interval. From 30 to 20 cm depth, the bulk density stabilises between 0.05 g/cm³ and 0.06 g/cm³. However, at this depth, the Ti profile displays a second peak. Values of bulk density then decrease gradually towards the surface of the profile. Titanium concentration fluctuations have been used to indicate fluctuations in soil dust inputs to bogs (Görres, 1993; Holynska et al., 1998; Shotyk et al., 1998). These changes in soil dust inputs can be due to various causes, such as agricultural activ-ities (Hölzer and Hölzer, 1998) or variation in natural atmospheric soil dust fluxes (Shotyk et al., 1998).
Atmospherically derived Soil Dust (ASD) can be calculated using geochemical elements such as Ti (Shotyk et al., 2002) or Sc (Shotyk et al., 2001). Since these elements are conservative, it can be assumed that their amount in ‘soil dust’ is similar to their amount in the upper continental crust. Using the Ti concentration in upper continental crust (0.40%, McLennan, 2001), the concen-tration of ‘soil dust’ in a peat sample can be deduced (Shotyk et al., 2001). Taking into account the bulk density and the mean accu-mulation rate derived from14
C and210
Pb dates, ASD in a sample can be calculated (Shotyk et al., 2002).
The ASD flux for the Słowin´skie Błota profile can be divided into five zones (Figure 3). From the base of the core to 50 cm depth, ASD values are very low, with a mean averaging 22µg/cm2 per yr. Given the14C dates, this part of the core was deposited dur-ing the early Middle Ages. This period is followed by a period of increased ASD (mean= 156 µg/cm2per yr) between 50 cm and 35 cm depth, spanning the eleventh to the beginning of the eighteenth centuries (late Middle Ages and early Modern Era). Then ASD reaches very high values (mean= 446 µg/cm2per yr) between 30 and 25 cm depth, ie, during the first half of the twentieth century. From 24 to 13 cm depth, ie, during from c.AD1960 to 1990, values
Figure 2 Age–depth model constructed on the basis of210Pb and14C
dating (see text for details). Diamonds represent results of 210Pb
dating; cross represents midpoint of 95.4% age interval obtained as a result of summarizing210Pb and14C calibrated age; circles represent
midpoints of 95.4% calibrated14C age range (see Table 2). Error bars
and the grey-shaded area show 95.4% confidence interval of age for dated horizons and the model respectively
800 1200 1600 2000 100 80 60 40 20 0 Depth (cm) Age AD Pb
Sum (sample at 34.5cm depth) C
210
average 249µg/cm2per yr. Then the ASD decreases drastically towards lower values (mean= 204 µg/cm2
per yr) at the surface. Detecting sources using enrichment factors Ti was used to calculate enrichment factors (EF) relative to the upper continental crust (UCC). Ti has been used in other studies as a conservative element to calculate EF (eg, Kempter, 1996; Shotyk et al., 2002).
Given the location of Słowin´skie Błota, the main particle sources to the bog are rainwater, sea-salt sprays, ASD and anthro-pogenic particles from various origins (coal burning, mining and smelting). Table 4 summarizes the EF for each element in the five main intervals encountered in the 1 m core.
K, Rb and Zr show very low enrichment factors. Most of these elements are therefore fed by ASD. Conversely, the higher K EF in the surface layers could be linked to plant recycling. Ca and Sr also record low enrichment factors, the lowest one being observed between 50 cm and 25 cm depth. In the basal (100–50 cm) and uppermost (25–0 cm) part of the core, these elements record a moderate increase in enrichment factor (Ca EF and Sr EF (100–50 cm) = 4; Ca EF and Sr EF (10–0 cm) = 9 and 2,
respectively). These values may be explained by sea-salt sprays from the nearby Baltic Sea.
By contrast, Cl and Br display high enrichment factors (7< Cl EF< 84 and 445 < Br EF < 2906). These elements are strongly enriched in seawater relative to the upper continental crust, mak-ing sea-salt sprays the most likely source for Cl and Br. However, Cl, Br, Ca and Sr cannot be used as quantitative indicators of marine aerosols inputs, although partly fed by sea-salt sprays. Indeed Shotyk (1997) showed that more than 90% of the elements supplied to the bog by marine-influenced rainwater are not retained by the peat.
Plant macrofossils
The results presented in Figure 4 and Table 5 record the main fea-tures of the four macrofossils zones. Relationships between the plant macrofossil components were explored using principal com-ponents analysis (PCA) (Figure 5). The SL4 macrofossil stratigra-phy registers relatively low local water-table depths in zone SL4-1, given the abundance of Sphagnum section Acutifolia leaves, whilst charcoal fragments are sporadic and not present in significant numbers. Towards the top of the zone the samples from
Figure 3 Density (Ti), and atmospheric soil dust flux versus depth.14
C age intervals and some210
Pb reference points are also reported
0 10 20 30 40 50 60 70 80 90 100 0.00 0.05 0.10 0.15 Density (g/cm ≥) Depth (cm) Ti (ppm) 0 100 200 300 400 0 200 400 600 A.S.D. Flux (µg cm-2yr-1) Age AD 862-957 973-1026 1083-1176 1165-1260 1416-1480 675-797 2005 1998 1991 1983 1976 1963 1890 1920 1953 1683-1738
Table 4 Enrichment factors calculated in the five depth intervals of the core using values from the upper continental crust (McLennan, 2001) and Ti as a conservative element
Concentrations Values/Ti 100 cm–50 cm 50 cm–35 cm 35 cm–25 cm 20 cm–10 cm 10 cm–0 cm
in UCC (µg/g) UCC E.F. (Ti) E.F. (Ti) E.F. (Ti) E.F. (Ti) E.F. (Ti)
Cl 640 0.16 84 20 7 41 82 K 28650 7.15 0 0 1 2 7 Ca 29450 7.34 4 1 1 2 9 Br 1.6 0.0004 2906 676 445 1054 1050 Rb 110 0.03 –a 1 1 2 4 Sr 316 0.08 4 1 1 3 2 Zr 237 0.06 0 2 1 0 –a
mid-point depths 52.5–46.5 cm (c.AD1210 to AD1360), record increased mire surface wetness, given the presence of Sphagnum section Cuspidata and Sphagnum tenellum leaves. In zone SL4-2 high percentage values of Sphagnum section Cuspidata and peak percentage values of Sphagnum cuspidatum (mid-point depths between 36.5 and 34.5 cm,AD1720 toAD1820) alternate with high
values of Monocots undifferentiated, Eriophorum vaginatum epi-dermis/spindles and the highest recorded values of charcoal frag-ments. This zone therefore records the highest mire surface wetness in the peat profile and additionally the greatest distur-bance, given the abundant presence of macroscopic charcoal indi-cating the occurrence of surface peat fires (charred leaves and stems of Calluna vulgaris are present in the peat matrices in this zone). Charcoal fragments decrease markedly in zone SL4-3, whilst the disappearance of aquatic Sphagnum cuspidatum and the increased representation of Calluna vulgaris stems indicate lower local water-table depths. Local water-table depths appear to have decreased further in zone SL4-4, as Sphagnum section Acutifolia leaves return as the dominant component of the peat matrices. Fires appear to have been very infrequent in the final zone, since char-coal fragments are rare. The Eigen values of axis 1 (0.598) and axis 2 (0.209) represent 80.7% of the cumulative percentage variance of the species data (Figure 5). Axis 1 seems to be determined by a moisture/burning gradient, with hummock microform taxa on the
left (Sphagnum section Acutifolia leaves, Aulacomnium palustre and Calluna vulgaris flowers/seeds). Two groups on the right of the PCA ordination indicate hollow microform taxa (Sphagnum
cuspi-datum/section Cuspidata and Sphagnum tenellum) and plants
(Eriophorum vaginatum and Rhynchospora alba) associated with the burning of the bog surface (Sillasoo et al., 2007).
Figure 4 Percentage of plant macrofossil in SL4. Zonations made using information content in psimpoll 4.25
UOM Er icales rootlets Calluna vulgar is st ems Calluna vulgar is lea ves Calluna vulgar is seed bo xes Calluna vulgar is flo w ers Calluna vulgar is seeds (n) M onoc ots .undiff er encia ted Er iophorum vag ina tum roots Er iophorum vag ina tum epider mis Er iophorum vag ina tum spindles (n) Rh ynchospor aalba seeds (n) Aulac omnium palustr e Iden tifiable Sphag num Sphag num spor e capsules (n) Sphag num st ems Sphag num sec tion Acutif olia Sphag num sec tion Cuspida ta Sphag num cuspida tum Sphag num tenellum M eliola ellisi fruit bodies (n) Char coal <0.5mm (n) Char coal siz e 0.5-1mm (n) Char coal siz e 1-1.5mm (n) Char coal siz e 1.5-2mm (n)
Table 5 SL4 macrofossil zonation
Macrofossil zone Depth (cm) Main features
SL4–4 15.5–2 Very low presence of charcoal
fragments with abundant Sphagnum section Acutifolia leaves. Leaves of Aulacomnium palustre occur between 10.5 and 2.5 cm and form up to 5% of the peat matrices
SL4–3 27.5–15.5 Strong reduction in the number of
charcoal fragments, with a large increase in Sphagnum section Cuspidata leaves, which record peak values at 20.5 cm. Ericales rootlets and Calluna vulgaris stems increase between 18.5 and 16.5 cm
SL4–2 45.5–27.5 Abundant charcoal fragments are
present throughout the zone, with the highest number recorded between 42.5 and 40.5 cm. The major components of the peat matrices are Monocots undifferentiated and Eriophorum vaginatum epidermis and roots. High values of Sphagnum section Cuspidata leaves (up to 59%) were recorded between 36.5 and 34.5 cm. Seeds of Rhynchospora alba occur at 32.5 and 28.5 cm
SL4–1 91–45.5 Abundant Sphagnum section
Acutifolia leaves with some Eriophorum vaginatum epidermis and roots. Charcoal fragments are infrequent, and where present do not record high values. Towards the top of the zone (52.5–46.5 cm) leaves of Sphagnum section Cusidata and Sphagnum tenellum appear and increase in abundance (maximum abundance values of 15 and 20%, respectively)
Stable isotopes
The rawδ13C data are presented in Figure 6 and record a large spread of individual points. This scatter is due to the differences of carbon isotopic composition in different Sphagnum species (Hornibrook et al., 2000). The raw data points were therefore smoothed using a three-point running average filter. Mean values for the rawδ13
C data up toAD1900 are equal to−27.39‰ VPDB. The smoothed curve was zoned into four periods. The first period (AD800–1200) is characterized by rather large fluctuations ofδ13
C oscillating below (AD800–1000) and above (AD1000–1200) the
mean value for the whole core. During the second period from c.
AD1200 to c.AD1580, theδ13C values first increase up to−25.6‰
VPDB at c.AD1370, and then decrease down to the mean value for the whole core. A similar pattern was observed for the third period from c.AD 1580 to c.AD1850 with the maximum of − 25.5‰ VPDB at c.AD1700. During the fourth period (from c.AD
1850) human disturbance (exploitation of the peat) probably caused large decreases of theδ13C signal. Indeed, theδ13C value in
Sphagnum organic matter depends on several factors, the most
important being the amount of water stored in the hyaline cells. Models showed that a decreasing amount of water stored in the hyaline cells will increase isotopic fractionation resulting in a decrease of theδ13
C value (Ménot-Combes et al., 2004). The suc-cessive drainage of Słowin´skie Błota caused a drop of local water-table and lead to the decrease of water content in leaves, explaining the drop in theδ13C during this period.
Discussion
Causes of LIA deterioration in Słowin´skie Błota The ASD flux profile versus depth (Figure 3) displays five peaks around 46 cm (c.AD1370), 38 cm (c.AD1650), 28 cm (c.AD1930), 16.5 cm (c.AD1984) and 10.5 cm depth (c.AD1996). Above 30 cm
depth, ASD can be explained by increasing industrial activities, especially coal mining and burning, and lead smelting in Poland (eg, Strzyszcz and Magiera, 2001). However, the lower part of the ASD flux profile (100–30 cm) may be explained by natural changes in ‘soil dust’ inputs, possibly related to climatic fluctua-tions. When the ASD flux is plotted against time (Figure 6), the interval between c.AD1200 andAD1800 records two ASD peaks.
These occur at 46 cm (around c.AD1370) and 38 cm (c.AD1650)
and may register LIA climatic deteriorations.
In peat bogs, LIA climatic deteriorations have been detected by Barber et al. (2000) and Mauquoy et al. (2002b). In another peat bog from North Poland, Lamentowicz et al. (2008) recorded two periods of reduced peat accumulation between AD
1100–1500 and AD 1650–1900, respectively. These authors
linked the oldest period to the LIA, whereas they explained that in their case, the youngest period is due to both LIA and human activity (ie, peat exploitation). In their work, van der Linden and van Geel (2006) also detected Wolf and Spörer minima in a
Sphagnum-bog from southernmost Sweden using combined
plant macrofossil, pollen and C/N analyses. Periods of reduced
Figure 5 Principal component analysis biplot of the SL4 plant macrofossil data. The ordination was performed using CANOCO for Windows version 4.02, using the following options: focus scaling on interspecies correlations, species scores divided by standard deviation, centering/ standardization by species
Sphagnum section Cuspidata
Sphagnum cuspidatum Unidentifiable Organic Material
Sphagnum tenellum Calluna vulgaris stems Ericales rootlets
Calluna vulgaris flowers Aulacomnium palustre
Sphagnum section Acutifolia
Calluna vulgaris leaves Eriophorum vaginatum epidermis
Eriophorum vaginatum roots
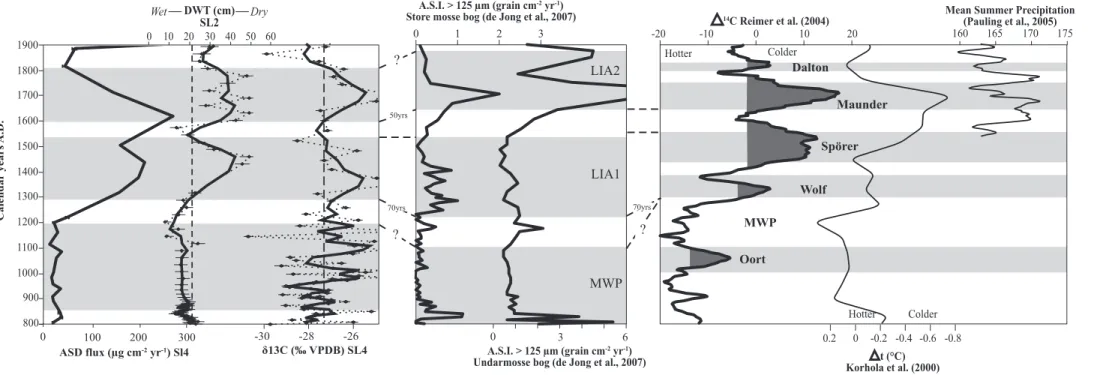
Figure 6 Atmospheric soil dust flux, mire surface wetness derived from testate amoebae andδ13
C versus time in Słowin´skie Błota. Raw data (dotted line), three-point average (solid line) and mean value (dashed vertical line) are given for both mire surface wetness andδ13
C. Comparison with aeolian sediment influx (ASI) found in two peat bog sequences (Store Mosse and Undarmosse) from south Sweden (de Jong et al., 2007),∆14
C curve (Reimer et al., 2004), temperature anomalies curve (Korhola et al., 2002) and 50-year running precipitation data presented over Northern Europe (Pauling et al., 2005)
0 0 1 2 3 LIA2 LIA1 MWP A.S.I. > 125 µm (grain cm-2yr-1)
Undarmosse bog (de Jong et al., 2007) A.S.I. > 125 µm (grain cm-2yr-1)
Store mosse bog (de Jong et al., 2007)
-20 -10 0 10 20 Oort MWP Wolf Spörer Maunder Dalton 14C Reimer et al. (2004) Hotter Colder 6 3 ? ? ? 50yrs 70yrs 70yrs 800 900 1000 1100 1200 1300 1400 1500 1600 1700 1800 1900 δ13C (‰ VPDB) SL4 ASD flux (µg cm-2yr-1) Sl4 0 100 200 300 Calendar years A.D. -30 -28 -26 Wet DWT (cm) Dry SL2 10 30 50 0 20 40 60 0.2 0 -0.2 -0.4 -0.6 -0.8 Hotter Colder t (°C) Korhola et al. (2000) 160 165 170 175
Mean Summer Precipitation (Pauling et al., 2005)
peat accumulation during the LIA may have been due to lower spring-summer temperatures slowing down the primary produc-tivity of peat-forming vegetation, and cold winters causing freezing of the bog surface (Mauquoy et al., 2004). Reductions in the rate of peat accumulation have the immediate effect of increasing the relative amount of ‘soil dust’ found in the peat profile during the LIA. During this time span, evidence for enhanced storminess and particle transport has also been demon-strated by de Jong et al. (2007) in a raised bog from South Sweden and by Meurisse et al. (2005) in peat-dune complexes from Northern France. More specifically, Maasch et al. (2005) also suggested that the LIA could be divided into two periods: a first wet oceanic period fromAD1230 toAD1620 followed by a dry period fromAD1700 toAD1950. During other cold events
such as the Younger Dryas stadial, it has also been demonstrated that erosion rates were enhanced, causing more resistant miner-als to be weathered and transported to a peat bog, drastically increasing the ASD flux (Shotyk et al., 2002). However, during the LIA, such changes are recorded when specific conditions are encountered. For instance, de Jong et al. (2007) demonstrated clearly that changes in storm regimes in Southern Sweden and short-term changes in climatic conditions that occurred during the LIA could be recorded thanks to nearby sand dune complexes providing easily erodible material that can be transported by wind up to the peat bogs. The same specific conditions can be applied to Słowin´skie Błota, which is also very near the seashore and dune complexes. Moreover, the PCA ordination of the plant macrofossil data shows a burning/disturbance gradient superim-posed on to the mire surface wetness gradient. Surface fires on peat bogs can cause increased mire surface wetness (Väliranta
et al., 2007), since hummock microforms can be destroyed,
causing a reduction of the local microrelief and therefore pro-moting increased mire surface wetness (Sillasoo et al., 2007). Given this, it is possible that the increases in mire surface wet-ness detected with the plant macrofossil analysis are due to dis-turbance by fires. Pollen data from the other high-resolution study of Słowin´skie Błota bog (SL2) showed the beginning of deforestation at c.AD1100 (Lamentowicz et al., 2009). Consequently,
increased landscape openness, surface fires and proximity to the seashore will allow soil material to be available for erosion and subsequent deposition as ASD in the mire. In other words, c. 150 years before the onset of the LIA soil was made available for future erosion, providing an ideal source of particles to be trans-ported by wind to the peat bog.
In Słowin´skie Błota, the increase of ASD is also correlated with a shift in DWT (Figure 6), reflecting that the onset of LIA is char-acterized by increased storminess and dryness of the area. Moreover, the lower Cl EF and Br EF values between 50 and 30 cm depth (Table 4) may indicate a more continental climate over North Poland during this period. These results do not correspond with the initial wet shift observed by de Jong et al. (2007) at the beginning of the LIA. However, de Jong et al. (2007) also pointed out that the climatic anomalies associated with the LIA and MWP they have evidenced in their record are reflected as periods with predomi-nantly dry or wet conditions. They noticed that these aeolian activ-ity peaks started during the recorded hydrological transitions, regardless of the direction of these shifts. In North Poland, Lamentowicz et al. (2008) explained that the development of peat bogs in this area could be driven by westerlies during wet periods, and by more continental influence during dry periods. No more pre-cise explanation has been found so far to explain why LIA is recorded by dry shifts in Baltic bog whereas it is recorded by wet shifts in other areas such as in Southwest Sweden. Therefore, we can conclude that in our record, the ASD peaks are found during LIA, but that in some locations, they can be accompanied by wet shifts whereas in other areas, they can be accompanied by dry shifts.
Timing of the LIA in NE Europe
The first dry shift recorded by the ASD flux in Słowin´skie Błota corresponds to the dry shift found by Lamentowicz et al. (2008) in another Baltic bog betweenAD1100 andAD1500. These authors
also record a second zone of climatic disturbance betweenAD1650
andAD1700–1900. They explain that this second shift starts with
a transition to wetter conditions, followed by a dry period, reflect-ing climatic instability. They claim a possible human influence superimposed to climatic dry shifts. However, the lack of evidence for human impact until AD1800–1850 together with the strong
correlation between Słowin´skie Błota bog and the peat bog stud-ied by Lamentowicz et al. (2008) support a climate-driven envi-ronmental change in both sites betweenAD1650 andAD1800. The
LIA timing found in our record fits also well with the period of decreased temperature (c.AD1400–1800) found by Jedrysek et al.
(2003) in a peat core from SW Poland, although this study is lower in resolution than our work. Our results described here are also in good agreement with the timescale found for this event in tree rings from various locations in Poland (Pazdur et al., 2007), and with results found by van der Linden and van Geel (2006), who detected climatic deteriorations during the Wolf and Spörer min-ima between AD1300 and AD 1550 in a peat bog profile from
Southern Sweden. Moreover, as in the present study, they also found a synchronous increase in bulk density during this time interval. Their bulk density values vary between 0.05 and 0.15 g/cm³ during the LIA, whilst values lower than 0.05 g/cm³ in other time intervals were recorded outside the LIA time interval.
In Słowin´skie Błota, the ages of the high ASD peaks are highly consistent with LIA intervals recorded in both southern Swedish peat deposits (Figure 6) and lake sediments from Finland (Weckström et al., 2006; Haltia-Hovi et al., 2007), which suggests that LIA climatic deteriorations may have occurred synchroneously in NE Europe. No dust peak is recorded beforeAD1300 because the
early ‘Medieval Warm Period’ is characterized by relatively stable conditions and low wind activity (de Jong et al., 2007). When com-paring our data with results from de Jong et al. (2007) and other data (Figure 6), slight age discrepancies occur between the various phases of climatic fluctuations and are linked to the various sam-pling resolutions and constraints associated with age–depth models (Figure 6). The uppermost ASD peak found in Słowin´skie Błota may correspond to the Maunder minimum. However, because of our sampling resolution, it is also possible that this ASD encom-passes the Dalton minimum. The lowermost ASD peak may record both the Wolf and Spörer minima, indifferently. Nevertheless accepting a 70-year discrepancy for the base of this zone (AD1300 in SL4 andAD1230 found by de Jong et al., 2007), the time span for
this earlier stage of the LIA is in good agreement with results from de Jong et al. (2007). It can therefore be concluded that the transition between the various LIA minima will be approximately synchro-neous in NE Europe regardless of the area.
Response to precipitation and temperature changes
A three-point running average smoothing procedure was per-formed on testate amoebae water-table reconstruction data (DWTTAin Figure 6) from Lamentowicz et al. (2009) and these were then compared with the isotopic data of SL4.δ13C in living plant organic material is controlled by photosynthesis (Farquhar
et al., 1982). Carbon isotopic fractionation between atmospheric
CO2and non-vascular plant cellulose was proposed by Figge and White (1995). Climatic factors that should be considered when analysing variations of carbon isotopic composition in non-vascu-lar plants are: temperature, humidity and the partial pressure of CO2 (Ménot-Combes et al., 2004). However, decomposition of peat organic material may disturb the ‘original’ carbon isotopic composition in peat (Kracht and Gleixner, 2000). To check if it
was possible to derive more than local climatic changes from theδ13C signal, ourδ13C results were compared with the recon-structed European summer precipitation curve for the last 500 years (Pauling et al., 2005) and reconstructed temperature anom-alies for Fennoscandia (Korhola et al., 2002). It seems that the isotopic data are not synchronized to reconstructed mean summer precipitation for Europe. In the present study, the factors driving the δ13C remain difficult to identify. Theδ13C curve is in good agreement with the reconstructed temperature data for Fennoscandia, although time-dependent discrepancies occur. Wolf and Maunder minima are clearly recorded in the δ13
C curve although the Spörer minimum remains unclear as for both ASD and DWTTA records. This slight delay between climatic events recorded by ASD, DWTTA and δ
13C in Słowin´skie Błota and Fennoscandia suggests that during last two millennia, the temper-ature over the southern Baltic shore decreased a few decades later than in Northern Europe during the LIA minima. Conversely, the shift towards higher temperature during optima occurred a few decades earlier than in Northern Europe.
Conclusions
The main natural sources of major elements recorded in the 1 m Słowin´skie Błota peat profile are ‘soil dust’ and sea-salt sprays, which account for the main part of K, Ca, Zr, Ti, Fe, and Cl and Br data variability.
‘Little Ice Age’ climatic deteriorations have rarely been identi-fied using ASD fluxes in European peat bogs. LIA climatic dete-riorations have only been detected in specific areas where peat bogs are surrounded by easily eroded material (eg, de Jong et al., 2007). In Słowin´skie Błota, the particular fact that the surrounding areas were deforested by human activities 150 years before the LIA provides a unique opportunity for soils to be extensively eroded and transported. As a result, LIA climatic changes can therefore be successfully tracked using ASD in this bog. LIA cli-matic deteriorations are recorded in the Słowin´skie Błota bog pro-file between c. AD 1200 and c.AD 1800 using the ASD, plant
macrofossils and δ13C. The results are in very good agreement with other records, claiming synchroneity of the LIA over NE Europe, regardless the causes and/or consequences of the LIA. In our record, these cooler and drier periods are characterized by increased soil dust fluxes possibly related to an increase in erosion processes and an increased continentality of climate. Multiproxy data (macrofossils, testate amoebae andδ13C) strongly support the ASD flux record by showing changing humidity and temperature conditions during this period.
Acknowledgements
We are grateful to Helen Kurzel (IEG, Heidelberg) for her help in with the XRF analyses of the samples, Konrad Tudyka and Agnieszka Wiszniowska for their help with the 14
C sample preparation, and Arkadiusz Bulak for his help with the 210Pb preparation and measurements. We also warmly thank Maarten Blaauw (Queens University, Belfast) for constructive comments on the age modelling. This work is part of a larger project ‘Climatic changes in Pomerania (N Poland) during the last mil-lennium based on multiproxy high-resolution studies’ (coord. M. Lamentowicz) granted by the Polish Ministry of Science and Higher Education (Contract No.: 2P04G03228). Geochemical analyses and14C dating were granted by an individual support from the University of Liège (‘classic credit’ to N. Fagel) and EU-funded ATIS project (‘Absolute Time Scales and Isotope Studies for Investigating Events in Earth and Human History’,
MTKD-CT-2005-029642). At the time of this research, F.D. was supported by FRIA (FNRS) fellowship.
References
Anshari, G., Kershaw, A.P. and van der Kaars, S. 2001: A late
Pleistocene and Holocene pollen and charcoal record from peat swamp forest, Lake Sentarum Wildlife Reserve, West Kalimantan, Indonesia. Palaeogeography, Palaeoclimatology, Palaeoecology 171, 213–28.
Appleby, P.G. 2001: Chronostratigraphic techniques in recent
sedi-ments. In Last, W.M. and Smol, J.P., editors, Tracking environmental change using lake sediments, volume 1: basin analysis, coring and chronological techniques. Springer, 171–203.
Barber, K.E., Maddy, D., Rose, N., Stevenson, A.C., Stoneman, R.
and Thompson, R. 2000: Replicated proxy-climate signals over the last 2000 yr from two distant UK peat bogs: new evidence for regional palaeoclimate teleconnections. Quaternary Science Reviews 19, 481–87.
Barber, K.E., Chambers, F.M. and Maddy, D. 2003: Holocene
palaeoclimates from peat stratigraphy: macrofossil proxy climate records from three oceanic raised bogs in England and Ireland. Quaternary Science Reviews 22, 521–39.
Bibler, C.J., Marshall, J.S and Pilcher, R.C. 1998: Status of
world-wide coal mine methane emissions and use. International Journal of Coal Geology 35, 283–310.
Blass, A., Bigler, C., Grosjean, M. and Sturm, M. 2007:
Decadal-scale autumn temperature reconstruction back to AD 1580 inferred from the varved sediments of Lake Silvaplana (southeastern Swiss Alps). Quaternary Research 68, 184–95.
Bronk Ramsey, C. 1995: Radiocarbon calibration and analysis of
stratigraphy: the OxCal program. Radiocarbon 37, 425–30.
—— 2001: Development of the radiocarbon calibration program OxCal. Radiocarbon 43, 355–63.
—— 2008: Deposition models for chronological records. Quaternary Science Reviews 27, 42–60.
Cheburkin, A.K. and Shotyk, W. 1996: An energy-dispersive
miniprobe multielement analyser (EMMA) for direct analyses of Pb and other trace elements in peats. Fresenius Journal of Analytical Chemistry 354, 688–91.
—— 2005: Energy-dispersive XRF spectrometer for Ti determination (TITAN). X-Ray Spectrometry 34, 69–72.
Dahl-Jensen, D., Mosegaard, K., Gundestrup, N., Clow, G.D., Johnsen, S.J., Hansen, A.W. and Balling, N. 1998: Past temperatures
directly from the Greenland Ice Sheet. Science 282, 268–71.
Davis, B.A.S., Brewer, S., Stevenson, A.C. and Guiot, J. 2003: The
temperature of Europe during the Holocene reconstructed from pollen data. Quaternary Science Reviews 22, 1701–16.
de Jong, R., Schoning, K. and Björck, S. 2007: Increased aeolian
activity during climatic regime shifts as recorded in a raised bog in south-west Sweden during the past 1700 years. Climate of the Past Discussions 3, 383–408.
De Vleeschouwer, F., Gérard, L., Goormaghtigh, C., Mattielli, N., Le Roux, G. and Fagel, N. 2007: Last two millennia atmospheric lead
and heavy metals inputs in a Belgian peat bog: regional to global human inpacts. The Science of the Total Environment 377, 297–310.
Farquhar, G.D., O’ Leary, M.H. and Berry, J.A. 1982: On the
rela-tionship between carbon isotope discrimination and photosynthesis. Australian Journal of Plant Physiology 9, 121–37.
Figge, R.A. and White, J.W.C. 1995: A high resolution Holocene and
Late Glacial atmospheric CO2record: variability tied to changes in
thermohaline circulation. Global Biogeochemical Cycles 9, 391–405.
Finsinger, W., Tinner, W., van der Knaap, W.O. and Ammann, B.
2006: The expansion of hazel (Corylus avellana L.) in the southern Alps: a key for understanding its early Holocene history in Europe? Quaternary Science Reviews 25, 612–31.
Görres, M., 1993: The Pb, Br, and Ti content in peat bogs as
indica-tor for recent and past depositions. Naturwissenschaften 80, 333–35.
Goslar, T. and Czernik, J. 2000: Sample preparation in the Gliwice
Radiocarbon Laboratory for AMS 14C dating of sediments.
Goslar, T., Czernik, J. and Goslar, E. 2004: Energy14C AMS in
Poznan Radiocarbon Laboratory, Poland. Nuclear Instruments and Methods in Physics Research B 223–224, 5–11.
Görres, M. 1991: The Pb, Br, and Ti content in peat bogs as indicator
for recent and past depositions. Naturwissenschaften 80, 333–35.
Haltia-Hovi, E., Saarinen, T. and Kukkonen, M. 2007: A 2000-year
record of solar forcing on varved lake sediment in eastern Finland. Quaternary Science Reviews 26, 678–89.
Heegaard, E., Birks, H.J.B. and Telford, R.J. 2005: Relationships
between calibrated ages and depth in stratigraphical sequences: an estimation procedure by mixed-effect regression. The Holocene 15, 612–18.
Herbichowa, M. 1998:Ekologiczne studium rozwoju torfowisk wyso-kich włas´ciwych na przykładzie wybranych obiektów z s´rodkowej cz s´ci Pobrzez.a Bałtyckiego. Wydawnictwo Uniwersytetu Gdan´skiego, Gdan´sk, 188 pp. In Polish.
Holynska, B., Ostrachowicz, B., Ostrachowicz, J., Samek, L., Wachniew, P. and Obidowicz, A. 1998: Characterisation of 210Pb
dated peat core by various x-ray fluorescence techniques. Science of the Total Environment 218, 239–48.
Hölzer, A. and Hölzer, A. 1998: Silicon and titanium in peat profiles
as indicators of human impacts. The Holocene 8, 685–96.
Hornibrook, E.R.C., Longstaffe, F.J., Fyfe, W.S. and Bloom, Y.
2000: Carbon-isotope ratios and carbon, nitrogen and sulfur abundances in flora and soil organic matter from a temperate-zone bog and marsh. Geochemical Journal 34, 237–45.
Je˛drysek, M.O., Kre˛piec, M., Skrzypek, G. and Kałuz .
ny, A. 2003:
Air-pollution effect and palaeotemperature scale versus d13C records in tree rings and in peat core (Southern Poland). Water, Air, and Soil Pollution 145, 359–75.
Kempter, H. 1996: Der Verlauf des anthropogenen Elementeintrags
in Regenwassermoore des westlichen Mitteleuropas während des jün-geren Holozäns. Paläoklimaforschung 26, 309.
Kilian, M.R., van der Plicht, J. and Van Geel, B. 1995: Dating
raised bogs: new aspects of AMS14C wiggle matching, a reservoir
effect and climatic change. Quaternary Science Reviews 14, 959–66.
Korhola, A., Vasco, K., Toivonen, H.T.T. and Olander, H. 2002:
Holocene temperature changes in northern Fennoscandia reconstructed from chironomids using Bayesian modelling. Quaternary Science Reviews 21, 1841–60.
Kracht, O., and Gleixner, G. 2000: Istotopic analysis of pyrolysis
products from sphagnum peat and dissolved organic matter from peat. Organic Geochemistry 31, 645–54.
Kulczyn´ski, S. 1949: Peat bogs of Polesie.Mémoires de l’Académie Polonaise des Sciences et des Lettres. Bulletin des Sciences Naturelles, B. Sco. Nat. 15, 356 pp.
Kylander, M.E., Weiss, D., Martinez-Cortízas, A., Spiro, B., Sanchez, R. and Coles, B. 2005: Refining the pre-industrial
atmos-pheric Pb isotope evolution curve in Europe using and 8000 year old peat core from NW Spain. Earth and Planetary Science Letters 240, 467–85.
Kylander, M.E., Muller, J., Wust, R.A.J., Gallagher, K., Garcia-Sanchez, R., Coles, B.J. and Weiss, D.J. 2007: Rare earth element
and Pb isotope variations in a 52 kyr peat core from Lynch’s Crater (NE Queensland, Australia): proxy development and application to paleoclimate in the Southern Hemisphere. Geochimica et Cosmochimica Acta 71, 942–60.
Lamentowicz, M., Cedro, A., Miotk-Szpiganowicz, G., Mitchell, E.A.D., Pawlyta, J. and Goslar, T. 2008: Last millennium
palaeoen-vironmental changes from a Baltic bog (Poland) inferred from stable isotopes, pollen, plant macrofossils and testate amoebae. Palaeogeography, Palaeoclimatology, Palaeoecology 265, 93–106.
Lamentowicz, M., Milecka, K., Gałka, M., Cedro, A., Pawlyta, J., Piotrowska, N., Lamentowicz, Ł. and van der Knaap, W.O. 2009:
Climate- and human-induced hydrological change since AD 800 in an ombrotrophic mire in Pomerania (N Poland) tracked by testate amoe-bae, macro-fossils, pollen, and tree-rings of pine. Boreas DOI 10.1111/j.1502–3885.2008.00047.x.
Latałowa, M. and Pe˛dziszewska, A. 2003: Zbiorowiska les´ne z
udzi-ałem grabu (Carpinus betulus) i buka (Fagus sylvatica) na Wysoczyz´nie Gdan´skiej w póz´nym Holocenie. Wste˛ pne wyniki badan´. In Gołębiewski, R., editor, Ewolucja pojezierzy i pobrzez.y
południowobałtyckich. Fundacja Rozwoju Uniwesytetu Gdan´skiego, 95–100. In Polish
Loader, N.J., McCarroll, D., van der Knaap, W.O., Robertson, I.
and Gagen, M. 2007: Characterizing carbon isotopic variability in Sphagnum. The Holocene 17, 403–10.
Lukashev, K.I., Kobalev, V.A. and Zhukhovitskaya, A.L. 1974:
Forms of aluminium and silicon in peat of Belorussia. Doklady Akademii Nauk SSSR 218, 681–84.
Maasch, K.A., Mayewski, P.A., Rohling, E.J., Stager, J.C., Karlen, W., Meeker, L.D. and Meyerson, E.A. 2005: A 2000-year context for
modern climate change. Geografiska annaler. Series A: Physical Geography 87, 7–15.
Mauquoy, D. and van Geel, B. 2007: Mire and peat macros. In Elias,
S.A., editor, Encyclopedia of Quaternary science, volume 3. Elsevier, 2315–36.
Mauquoy, D., Engelkes, T., Groot, M.H.M., Markesteijn, F., Oudejans, M.G., van der Plicht, J. and van Geel, B. 2002a:
High-resolution records of late-Holocene climate change and carbon accu-mulation in two north-west European ombrotrophic peat bogs. Palaeogeography, Palaeoclimatology, Palaeoecology 186, 275–310.
Mauquoy, D., van Geel, B., Blaauw, M. and van der Plicht, J.
2002b: Evidence from northwest European bogs shows ‘Little Ice Age’ climatic changes driven by variations in solar activity. The Holocene 12, 1–6.
Mauquoy, D., van Geel, B., Blaauw, M., Speranza, A. and van der Plicht, J. 2004: Changes in solar activity and Holocene climatic shifts
derived from14C wiggle-match dated peat deposits. The Holocene 14,
45–52.
McLennan, T. 2001: Relationships between the trace element
com-position of sedimentary rocks and upper continental crust. Geochemistry, Geophysics and Geosystems 2, 2000GC000109.
Ménot-Combes, G., Combes, P.P. and Burns, S.J. 2004: Climatic
information fromδ13C in plants by combining statistical and
mecha-nistic approaches. The Holocene 14, 931–39.
Meurisse, M., Van Vliet-Lanoé, B., Talon, B. and Recourt, P. 2005:
Complexes dunaires et tourbeux holocènes du littoral du Nord de la France. Comptes Rendus Geosciences 337, 675–84. In French.
Mihaljevic, M., Zuna, M., Ettler, V., Sebek, O., Strnad, L. and Golias, V. 2006: Lead fluxes, isotopic and concentration profiles in a
peat deposit near a lead smelter (Pribram, Czech Republic). The Science of The Total Environment 372, 334–44.
Mukai, H., Machida, T., Tanaka, A., Vera, Y.P. and Uematsu, M.
2001: Lead isotope ratios in the urban air of eastern and central Russia. Atmospheric Environment 35, 2783–93.
Novak, M., Emmanuel, S., Vile, M.A., Erel, Y., Véron, A., Paces, T., Wieder, R.K., Vanecek, M., Stepanova, M., Brizova, E. and Hovorka, J. 2003: Origin of lead in eight Central European peat bogs
determined from isotope ratios, strengths, and operation times of regional pollution sources. Environmental Science and Technology 37, 437–45.
O’Brien, S.R., Mayewski, P.A., Meeker, L.D., Meese, D.A., Twickler, M.S. and Whitlow, S.I. 1995: Complexity of Holocene
cli-mate as reconstructed from a Greenland ice core. Science 270, 1962–64.
Osvald, H. 1923:Die Vegetation des Hochmoores Komosse. Svenska växtsociologiska sällskapets handlingar, 1. In German.
—— 1925: Die Hochmore Europas. Veröffentlichungen des Geobotanischen Institutes der Technische Hochschule Stiftung Rübel in Zürich 3, 707–23. In German.
Otłuszewski, W. 1948: Badania pyłkowe nad torfowiskami dolnej
Łeby. Badania Fizjograficzne nad Polska˛ Zachodnia˛ 1, 97–128.
Otłuszewski, W. and Borówko, Z. 1954: Analiza pyłkowa torfowiska
‘Bielawskie Błota’. In Czubin´ski, Z., editor, Bielawskie Błota – gina˛ce torfowisko atlantyckie Pomorza. Ochrona Przyrody 22, 140–52. In Polish.
Pauling, A., Luterbacher, J., Casty, C. and Wanner, H. 2005: Five
hundred years of gridded high-resolution precipitation reconstructions over Europe and the connection to large-scale circulation. Climate Dynamics 26, 387–405.
Pazdur, A., Nakamura, T., Pawelczyk, S., Pawlyta, J., Piotrowska, N., Rakowski, A., Sensula, B. and Szczepanek, M. 2007: Carbon
isotopes in tree rings: climate and the Suess effect interferences in the last 400 years. Radiocarbon 49, 775–88.
Reimer, P.J., Baillie, M.G.L., Bard, E., Bayliss, A., Beck, J.W., Bertrand, C., Blackwell, P.G., Buck, C.E., Burr, G., Cutler, K.B., Damon, P.E., Edwards, R.L., Fairbanks, R.G., Friedrich, M., Guilderson, T.P., Hughen, K.A., Kromer, B., McCormac, F.G., Manning, S., Bronk Ramsey, C., Reimer, R.W., Remmele, S., Southon, J.R., Stuiver, M., Talamo, S., Taylor, F.W., van der Plicht, J. and Weyhenmeyer, C.E. 2004: IntCal04 terrestrial radiocarbon age
calibration, 26–0 ka BP. Radiocarbon 46, 1029–58.
Shotyk, W. 1997: Atmospheric deposition and mass balance of major
and trace elements in two oceanic peat bog profiles, northern Scotland and the Shetland Islands. Chemical Geology 138, 55–72.
Shotyk, W., Weiss, D., Appleby, P.G., Cheburkin, A.K., Frei, R., Gloor, M., Kramers, J.D., Reese, S. and van der Knaap, W.O.
1998: History of atmospheric lead deposition since 12,37014C yr BP
from a peat bog, Jura mountains, Switzerland. Science 281, 1635–40.
Shotyk, W., Weiss, D., Kramers, J.D., Frei, R., Cheburkin, A.K., Gloor, M. and Reese, S. 2001: Geochemistry of the peat bog at Etang
de la Gruère, Jura Mountains, Switzerland, and its record of atmos-pheric Pb and lithogenic trace metals (Sc, Ti, Y, Zr, and REE) since 12,370 14C yr BP. Geochimica et Cosmochimica Acta, 65, 2337–60.
Shotyk, W., Krachler, M., Martinez-Cortizas, A., Cheburkin, A.K.
and Emons, H. 2002: A peat bog record of natural, pre-anthropogenic enrichments of trace elements in atmospheric aerosols since 12 370 14C yr BP, and their variation with Holocene climate change. Earth and Planetary Science Letters 199, 21–37.
Sillasoo, U., Mauquoy, D., Blundell, A., Charman, D., Blaauw, M., Daniell, J.G.R., Toms, P., Newberry, J., Chambers, F.M. and Karofeld, E. 2007: Peat multi-proxy data from Männikjärve bog as
indi-cators of Late Holocene climate changes in Estonia. Boreas 36, 20–37.
Skrzypek, G., Kaluzny, A. and Jedrysek, M.O. 2007: Carbon stable
isotope analyses of mosses – comparisons of bulk organic matter and extracted nitrocellulose. Journal of the American Society for Mass Spectrometry 18, 1453–58.
Strzyszcz, Z. and Magiera, T. 2001: Record of industrial pollution in
Polish ombrotrophic peat bogs. Physics and Chemistry of the Earth (A) 26, 859–66.
Stuiver, M. and Braziunas, T.F. 1993: Sun, ocean, climate and
atmospheric14
CO2: an evaluation of causal and spectral relationships.
The Holocene 3, 289–305.
Syrovetnik, K., Malmstrom, M.E. and Neretnieks, I. 2007:
Accumulation of heavy metals in the Oostriku peat bog, Estonia: determination of binding processes by means of sequential leaching. Environmental Pollution 147, 291–300.
Szafran´ski, F. 1961: Polodowcowa historia lasów obszaru na północ
od Wysoczyzny Staniszewskiej. Badania Fizjograficzne nad Polska˛ą Zachodnia¸ 8, 91–131. In Polish.
Twardowska, I., Kyziol, J., Goldrath, T. and Avnimelech, Y. 1999:
Adsorption of zinc onto peat from peatlands of Poland and Israël. Journal of Geochemical Exploration 66, 387–405.
Väliranta, M., Korhola, A., Seppä, H., Tuittila, E., Sarmaja-Korjonen, K., Laine, J. and Alm, J. 2007: High-resolution
recon-struction of wetness dynamics in a southern boreal raised bog, Finland, during the late Holocene: a quantitative approach. The Holocene 17, 1093–107.
van der Linden, M. and van Geel, B. 2006: Late Holocene climate
change and human impact recorded in a south Swedish ombrotrophic peat bog. Palaeogeography, Palaeoclimatology, Palaeoecology 240, 649–67.
van Geel, B., Raspopov, O.M., Renssen, H., van der Plicht, J., Dergachev, V.A. and Meijer, H.A.J. 1999: The role of solar forcing
upon climate change. Quaternary Science Reviews 18, 331–38.
Vile, M.A., Wieder, R.K. and Novak, M. 2000: 200 years of Pb
dep-osition throughout the Czech Republic: patterns and sources. Environmental Science and Technology 34, 12–21.
Wardenaar, E.P.C. 1986: A new hand tool for cutting peat profiles.
Canadian Journal of Botany 65, 1772–73.
Weckström, J., Korhola, A., Erästö, P. and Holmström, L. 2006:
Temperature patterns over the past eight centuries in Northern Fennoscandia inferred from sedimentary diatoms. Quaternary Research 66, 78–86.
Wodziczko, A. and Thomaschewski, M. 1932: Staniszewskie Błoto na
Kaszubczyz´nie. Acta Societatis Botanicorum Poloniae 9, 1–10. In Polish.