Open Archive Toulouse Archive Ouverte (OATAO)
OATAO is an open access repository that collects the work of Toulouse researchers and makes it freely available over the web where possible.
This is an author-deposited version published in: http://oatao.univ-toulouse.fr/
Eprints ID: 4499
To link to this article:
http://dx.doi.org/10.1021/je100163q
To cite this version: Liaw, Horng-Jang and Gerbaud, Vincent and Wu, Hsuan-Ta (2010) Flash Point Measurements and Modeling for Ternary
Partially Miscible AqueousOrganic Mixtures. Journal of Chemical &
Engineering Data, vol. 55 (n° 9). pp. 3451-3461. ISSN 0021-9568
Any correspondence concerning this service should be sent to the repository administrator: [email protected]
Flash Point Measurements and Modeling for Ternary Partially
Miscible Aqueous−Organic Mixtures
Horng-Jang Liaw a, Vincent Gerbaud b,c, Hsuan-Ta Wu a
a
Department of Occupational Safety and Health China Medical University
Taichung, Taiwan, R.O.C.
b
Université de Toulouse, INP-ENSIACET, UPS, LGC (Laboratoire de Génie Chimique), 4 allée Emile Monso - BP 84234 - 31432 TOULOUSE cedex 4 – France
c
CNRS, LGC (Laboratoire de Génie Chimique), 4 allée Emile Monso - BP 84234 - 31432 TOULOUSE Cedex 01 – France
Address correspondence to: Dr. Horng-Jang Liaw
Department of Occupational Safety and Health China Medical University
91 Hsueh-Shih Rd., Taichung, Taiwan Tel: 886-4-22053366 ext. 6209
Fax: 886-4-22030418
Flash Point Measurements and Modeling for Ternary Partially
Miscible Aqueous−Organic Mixtures
Horng-Jang Liaw a, Vincent Gerbaud b,c, Hsuan-Ta Wu a
a
Department of Occupational Safety and Health, China Medical University 91 Hsueh-Shih Rd., Taichung, Taiwan
b
Université de Toulouse, INP-ENSIACET, UPS, LGC (Laboratoire de Génie Chimique), 4 allée Emile Monso - BP 84234 - 31432 TOULOUSE cedex 4 – France
c
CNRS, LGC (Laboratoire de Génie Chimique), 4 allée Emile Monso - BP 84234 - 31432 TOULOUSE Cedex 01 – France
ABSTRACT
Flash point is the most important variable used to characterize the fire and explosion hazard of liquids. This paper presents the first partially miscible aqueous−organic mixtures flash point measurements and modeling for the ternary type-I mixtures, water + ethanol + 1-butanol, water + ethanol + 2-butanol, and the type-II mixture, water + 1-butanol + 2-butanol. Results reveal that the flash points are constant in each tie line. Handling the non-ideality of the liquid phase through the use of activity coefficient models, the general flash-point model of Liaw et al. extended to partially miscible mixtures predicts the experimental data well when using literature LLE and the VLE activity coefficient model binary parameters to estimate sequentially the span and flash point in each tie line and the flash point in the mutual solubility region, respectively. The constant flash-point behavior in a tie line is also observed and predicted, in agreement with the VLLE tie line property that a single vapor is in equilibrium with all liquid composition on a tie line. For the aqueous−organic mixtures here studied, a deviation between prediction and measurements is observed, arising from the failure of the constant lower flammable limit assumption in the mutual solubility inert-rich region. Potential application for the model concerns the assessment of fire and explosion hazards and the development of inherently safer designs for chemical processes containing partially miscible aqueous−organic mixtures.
Keywords: Flash point; Prediction; Partially miscible mixtures; Vapor−liquid−liquid
Introduction
The fire and explosion hazard of liquids is primarily characterized by their flash point.1 The flash point is the temperature determined experimentally at which a liquid emits sufficient vapor to form a combustible mixture with air.2 Recently, the importance of flash point in the usage and storage of combustible and flammable liquid mixtures was dramatically highlighted in Taiwan after a series of explosions of essential oils and the Shengli event.3-5 In addition, combustible and flammable liquids are the major hazardous materials both involved in chemical transportation and responsible for road tanker accidents mostly.6 The requirements of transportation for combustible and flammable liquids are primarily related to their flash-point values.7
The United Nations encouraged the worldwide implementation of the GHS (Globally Harmonized System of Classification and Labeling of Chemicals) in 2008 and within it; the flash point of mixtures is the critical property in the classification of flammable liquids. Unfortunately, mixture flash-point data is scarce, which may explain the decision of the EC (European community) CLP (Classification, Labeling and Packaging) to delay the classification of mixtures until 2015.8 The flash points of partially miscible mixtures are the least studied despite their use in the liquid−liquid extraction processes9,10
and heterogeneous distillation processes11 encountered in many chemical plants. A review of the literature revealed that the only published data available for partially miscible mixtures are those reported in our previous studies.12-15
Since the cost of deriving flash-point data from test instruments is very high, NT$20,000/US$600 per sample in Taiwan, several alternative models for predicting the flash points of different type of mixtures have been proposed, especially for miscible mixtures.1,3-5,16-23 Models based on the assumption of ideal solutions1,16-18 show limitations when applied to non-ideal mixtures, which are the most frequent ones. Models taking into account the non-ideality of the solution through liquid-phase activity coefficients have a wider application range and predicted efficiently the flash point of miscible mixtures.3-5,19,20,22,23
Non-ideality of the liquid phase is in particular responsible for the occurrence of extreme flash-point behavior such as minimum and maximum flash-point behavior,21,24-27 with strong implications on the fire and explosion hazard assessment for the concerned mixtures. The extreme behavior was set in parallel
with minimum-boiling and maximum-boiling azeotropic behavior in vapor−liquid equilibrium. In vapor−liquid equilibrium, stronger non-ideality with positive deviation from ideality within a mixture may often results in the partial miscibility of the liquid phase, eventually coupled with the occurrence of a so-called heteroazeotrope. An analogous partial-miscibility behavior was observed for the flash points of binary partially miscible mixtures of flammable solvents12 or of aqueous−organic mixtures13
and for ternary partially miscible mixtures of flammable solvents14. In all three studies, a model handling the non-ideality of the solution, testing for partial miscibility span and computing the flash point was successfully used in a predictive manner, using literature binary interaction parameters. In this manuscript, we extend its use for multi-component partially miscible aqueous−organic mixtures and validate it on the data of ternary partially miscible solutions: water + ethanol + 1-butanol, water + ethanol + 2-butanol, and water + 1-butanol + 2-butanol.
Experimental Protocol
An HFP 362-Tag Flash Point Analyzer (Walter Herzog GmbH, Germany), which meets the requirement of ASTM D56 standard28, was used to measure the flash points for three ternary mixtures (water + ethanol + 1-butanol, water + ethanol + 2-butanol, and water + 1-butanol + 2-butanol) at different compositions. The basic system configuration of the Tag close cup tester is given in Fig. 1. The apparatus consists of an external cooling system, test cup, heating block, electric igniter, sample thermometer, thermocouple (sensor for fire detection) and indicator/operating display. The apparatus incorporates control devices that program the instrument to heat the sample at a specified rate within a temperature range close to the expected flash point. The literature data and the estimated one under ideality assumption were used as the expected flash point for pure substance and mixture, respectively. The flash point is automatically tested using an igniter at specified temperature test intervals. The values of expected flash point and change temperature determine which test interval is used. If the expected flash point is lower than or equal to the change temperature, heating rate-1 is used and the igniter is fired at test interval-1. If the expected flash point is higher, heating rate-2 is adopted and the igniter is fired at test interval-2. In the standard method, the change
temperature is laid down by the standard and cannot be changed. The first flash-point test series is initiated at a temperature equivalent to the expected flash point minus the start-test value. If the flash point is not determined when the test temperature exceeds the sum of the expected flash point plus the end-of-test value, the experimental iteration is terminated. The instrument operation was conducted according to the standard ASTM D56 test protocol28 using the following parameters: start test 5 K; end of test 20 K; heat rate-1, 1 K⋅min-1; heat rate-2, 3 K⋅min-1
; change temperature 60 ºC; test interval-1, 0.5 K; and, test interval-2, 1.0 K. The liquid mole fraction was estimated from the mass divided by molecular weight, with the mass measuring by a Setra digital balance (EL-410D: sensitivity 0.001 g, maximum load 100 g). A magnetic stirrer provided sufficient agitation for the test samples. The prepared mixtures were stirred for 30 min before the flash-point test. A Milli-Q plus was used for water purification. Ethanol (99.5 vol%) was purchased from NASA enterprises (USA). 1-Butanol (99.8 vol%) was obtained from J.T. Baker. 2-Butanol (99.0 %) was sourced from Panreac (Spain).
Mathematical Formulation
Flash-Point Equations for Partially Miscible Aqueous-Organic Mixtures. Upon the basis of the definition of flash point,29 it is necessary to estimate the vapor-phase composition of flammable substances from a vapor−liquid equilibrium equation to predict their flash point. Furthermore, for partially miscible mixtures liquid–liquid equilibrium must be solved to check the ability of the liquid phase to demix. Non-ideality of the liquid solution must be taken into account, as it is a major cause of demixtion. This is done by considering liquid-phase activity coefficients thermodynamic models.30 NRTL31 and UNIQUAC thermodynamic models32 are applicable to both vapor−liquid and liquid−liquid equilibria, unlike Wilson model33 which cannot be used for liquid–liquid equilibrium.30
Within the mutual-solubility region, only one liquid phase is present, and the variation of the partial pressure of each component with liquid-phase composition is identical to that for a miscible aqueous−organic mixture. Thus, the flash point in such a region can be evaluated by the method for a multi-component i miscible analogue5 that for a ternary mixture with a non-flammable aqueous phase taken as component 1 becomes:
) 1 ( 1 , 3 3 3 3 , 2 2 2 2 1 , P P x P P x P P x sat fp sat sat fp sat i sat fp i sat i i iγ = γ + γ =
∑
≠ (2) log i i i sat i C T B A P + − = sat fp iP, , the vapor pressure of the pure flammable component, i, at its flash point, Ti,fp,
can be estimated using the Antoine equation (eq 2). Liquid-phase activity coefficients γi are evaluated using an activity coefficient model, like NRTL or
UNIQUAC. Vapor phase is assumed to behave as a perfect gas as is usual under low to moderate pressure conditions.34
Within the partially miscible region, two liquid phases are in equilibrium with compositions defining a so-called tie line. A property of vapor−liquid−liquid equilibrium is that any liquid composition located on this tie-line, in particular, the composition of both liquid phases in equilibrium, is in equilibrium with a single vapor composition located on the so-called vapor line.34, 35 As the flash point is related to the vapor composition, it should keep constant whatever the liquid composition on the liquid−liquid equilibrium tie line. For a binary mixture, a single tie line exists and the flash point is constant for the whole composition range within the partial miscibility region.12, 13 For a ternary mixture several tie lines lead to several flash-point values within the partial miscibility region.14 For two liquid phases in equilibrium in which the reference fugacity is the same, the equilibrium compositions can be estimated by the equilibrium equality of the compound fugacities in each phase, and such an equality is reducible as:
(3) , , 1 ) ( ) (xiγi α = xiγi β i= L N
where α and β refer to the two coexisting liquid phases.
The flash point within each tie line can be calculated by substituting into eqs 1 and 2 the estimated value of equilibrium composition estimated by eq 3 by an iterative procedure described in Figure 2 analogous to that used for calculating the boiling and dew points of mixtures.36
Use of Binary Parameters. Use of existing binary parameters in the activity coefficient models makes the aforementioned model predictive. Since the binary interaction parameters of NRTL and UNIQUAC models are accessible for the studied mixtures, the two models were used in this study. However, the flash point mixes LLE equation (eq 3), and flash-point equation based on VLE calculation (eq
1). Ideally, the same set of parameter should be used for eq 1 and 3, which is possible if VLLE data regressed parameter exist, which is rare. On the other hand it is acknowledged that binary parameter regressed on LLE data are not suitable for predicting VLE data.37 Thus we validated in a former study14 the iterative procedure described in Figure 2: The flash point in the mutual solubility region was estimated by the VLE parameters. For the partially miscible region, LLE parameters are used in eq 3 to estimate the tie line equilibrium liquid compositions, and the relevant flash point is computed using first VLE parameters to ensure no discontinuity in the calculated flash-point surface, and second using the liquid–liquid equilibrium composition approaching the lower boiling pure component. This is the so-called VLLE model in this study.
Results and Discussion
Parameters Used in This Manuscript. The flash-point model for ternary partially miscible aqueous−organic mixtures was used for water + ethanol + 1-butanol, water + ethanol + 2-butanol, and water + 1-butanol + 2-butanol mixtures and validated against the corresponding experimental data. Liquid-phase activity coefficients were estimated by using the NRTL31 and UNIQUAC equations.32 Binary interaction parameters obtained either from the LLE or VLE data are used in this study, with parameters adopted from the literature38-40 (Tables 1, 2). The parameters for relative van der Waals volume (r) and the surface area (q) for the pure components needed in the UNIQUAC equation (also obtained from the literature30) are listed in Table 3 along with the Antoine coefficients sourced from the literature.39
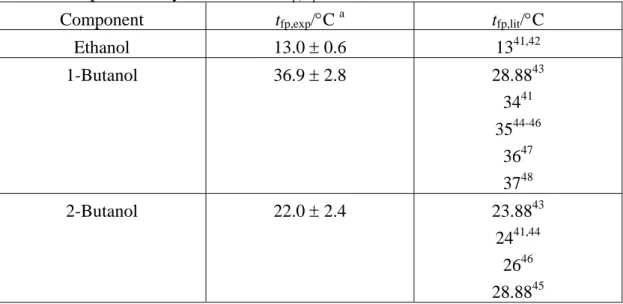
Pure Component Flash Points. The flash points for the pure substances used in this study were measured using the Flash Point Analyzer, and compared to literature data41-48 (Table 4). Some of the literatures’ data were tested by the closed-cup method41, 42, 48 and others did not mention the test method; however, the latter data seem to be tested by the closed-cup method from the reported values. Our experimental flash point for ethanol was identical to the literature-derived values.41,42 The measured flash points for 1-butanol and 2-butanol were close to the literature-derived values,41, 43-48 except that there were between-source differences in the flash-point data for 1-butanol and 2-butanol. However, these differences were acceptable except for the value of 1-butanol provided by NIOSH,43 2-butanol by
Tedia.45
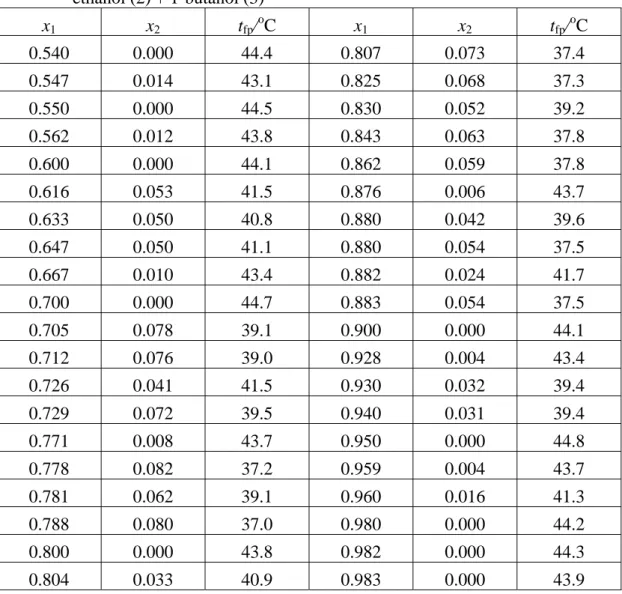
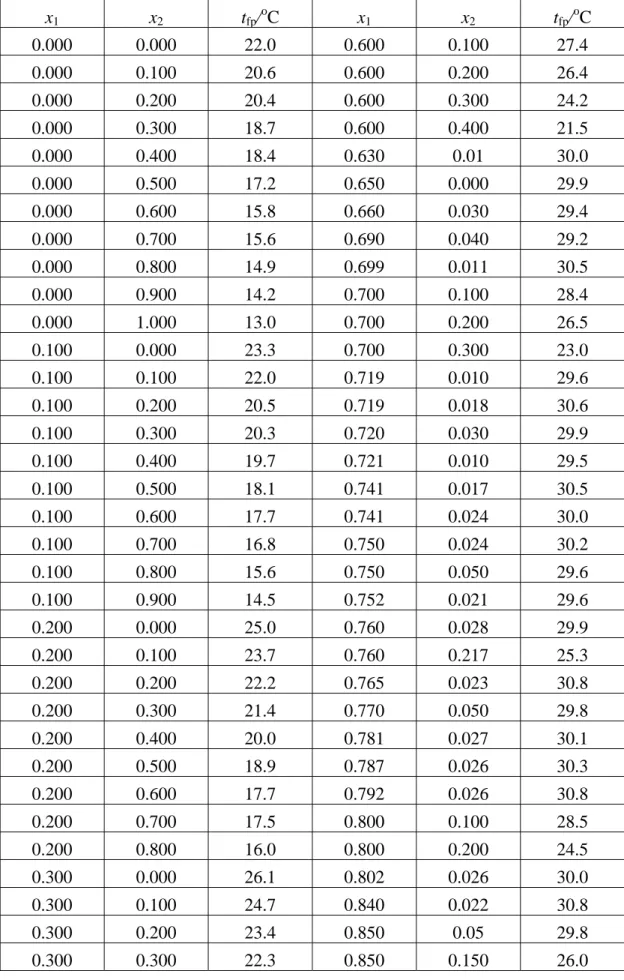
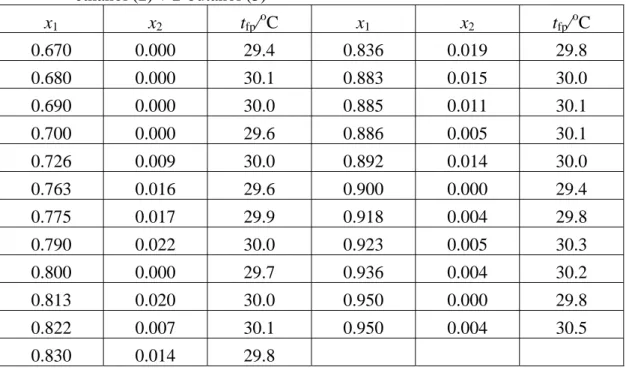
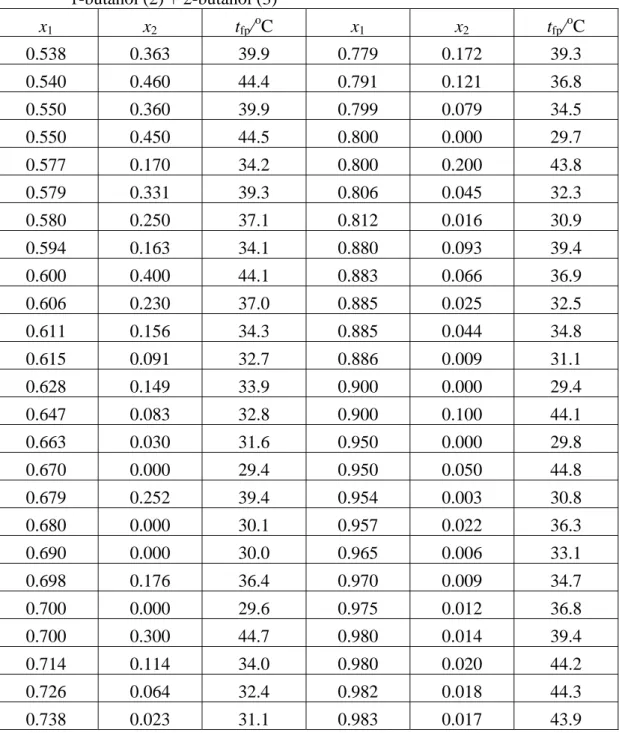
Flash-Point Variation for Binary Pairs of the Studied Ternary Mixtures. Experimental flash-points data for the ternary mixtures of water + ethanol + 1-butanol, water + ethanol + 2-butanol, and water + 1-butanol + 2-butanol covering their flammable composition ranges were listed in Tables 5-10. The average value of standard deviation of these data is around 0.8 oC, and the maximum one is 1.6 o
C.
Water + ethanol, ethanol + 1-butanol, ethanol + 2-butanol, and 1-butanol + 2-butanol are miscible binary pairs at their flash-point temperature. But, water + 1-butanol, and water + 2-butanol are partially miscible ones.
Figures 3 and 4 and Table 11 compare measured and predicted flash points, based upon literature binary parameters as listed in Tables 1 and 2. Predictions are in good agreement with the experimental data over the flammable composition range, when the NRTL and UNIQUAC equation with Gmehling et al.’s VLE parameters40 are used for the miscible binary mixtures 1-butanol + 2-butanol and Kosuge and Iwakabe’s VLE ones38 for the other binary miscible mixtures water + ethanol, ethanol + 1-butanol, and ethanol + 2-butanol (Figure 3).
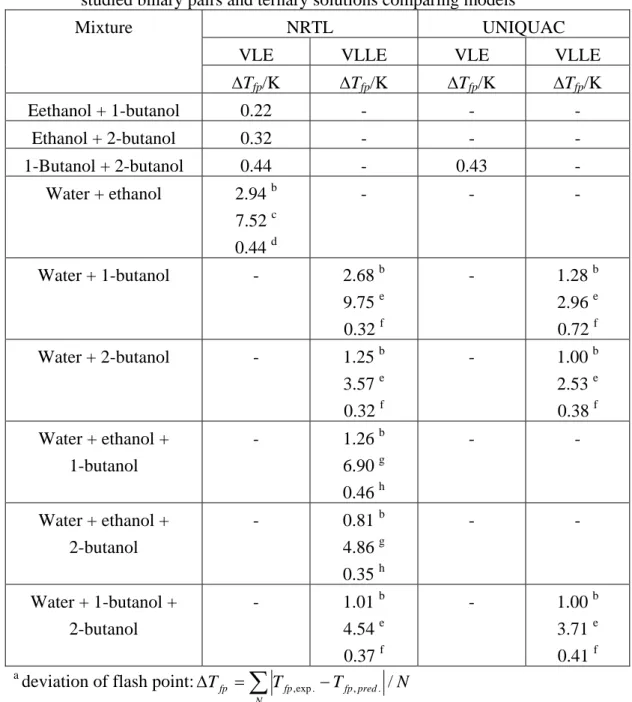
Table 11 also shows the excellent predictions for the flammable mixtures ethanol + 1-butanol, ethanol + 2-butanol, and 1-butanol + 2-butanol. However, for aqueous–flammable mixtures, remarkable deviations occur: For water + ethanol, predictions are excellent for xwater < 0.9, with the deviations being 0.44 oC. For xwater ≥ 0.9, with deviation of flash point being 7.52 o
C. This phenomenon of greater deviation in high water composition region was also observed in other miscible aqueous−organic solutions4,5 and other partially miscible aqueous−organic mixtures13 and can be explained by the model failure to consider the effect of inert concentration on the lower flammable limit of a mixture.49 In the estimation of flash point for a mixture, eq 1 uses the Le Chatelier’s rule50 that assumes that an inert substance such as water has no effect on the lower flammable limit of a mixture. The same trend is observed for the other binary and ternary aqueous−organic mixtures in this study (Table 11).
Regarding the liquid–liquid equilibrium span and related flash point of the binary mixtures water + 1-butanol and water + 2-butanol, Table 12 shows predictions in this study and experimental data agree very well, whether the NRTL
or UNIQUAC equation is used and are in agreement with the former study.13
Two Liquid Phase Region of Ternary Mixtures. By analogy with common liquid−liquid equilibrium ternary diagram classification, the water + ethanol + 1-butanol and water + ethanol + 2-butanol, mixtures exhibit a single partially miscible binary mixture and both are type-I mixtures (see Figures 5, 6). One notices that the NRTL-based predicted regions of the water + ethanol + 1-butanol mixture and of the water + ethanol + 2-butanol mixture are slightly less and larger than the measurements, respectively. However, they are both very close to the corresponding measurements (Figures 5, 6 and Tables 13, 14).
For the water + 1-butanol + 2-butanol, a type-II mixture with two partially miscible binary mixtures, Figure 7 shows LLE predictions for several tie-lines with either NRTL or UNIQUAC parameter sets. Both equations predict well the tie lines slopes, but not with the same extend length, which are both slightly less than the measurement (Figure 7 and Table 15).
Tie Line Flash Point within the Two Liquid Phase Region of Ternary Mixtures. According to the theory, flash point on a given tie-line should be constant. However, only chance would enable to guess beforehand the compositions in equilibrium on a same tie line and record then a constant flash point. Therefore, we use the model to predict tie line compositions and flash point and afterwards measure flash point based on the predicted composition.
Predictions and subsequent measures are displayed in Figures 8, 9 and recorded in Tables 13-15 for water + ethanol + 1-butanol, water + ethanol + 2-butanol, and water + 1-butanol + 2-butanol mixtures.
The constant flash-point behavior is predicted by the model as expected. The measurements done after the predictions are almost collinear and constant on Figures 8 and 9, as confirmed by the moderate standard deviation in average flash point reported in Tables 13 − 15 for each tie line. The average measured flash point also agrees with the constant predicted flash-point value. The estimated tie lines have the similar slope with the measured ones, although the extend lengths are slightly different (Figures 5 − 7, Tables 13 − 15). A special observation is that the average flash points for the tie lines listed in Table 14 are almost identical for water + ethanol + 2-butanol, and this can be attributed to that the two liquid phase region of such a mixture is very small resulted in each tie line being very close (Figures 6
and 8).
Flash Points for Ternary Mixtures over the Entire Composition Range. At first, Kosuge and Iwakabe’s VLE parameters regressed on the ternary compositions of water + ethanol + 1-butanol and water + ethanol + 2-butanol38 were used to predict the flash point. However, computation diverged. It was concluded in our previous studies that a model based upon the binary parameters of binary solutions may reasonably predict flash point for ternary miscible solutions5, 19 and the parameter listed in Table 2 were used. Results are displayed in Figures 10 − 12, and the average deviation between measurements and predicted flash points is listed in Table 11.
Figures 10, 11 depicts the measured and the NRTL-based predicted flash points for the water + ethanol + 1-butanol and water + ethanol + 2-butanol mixtures and Figure 12 displays the measured and either NRTL-based or UNIQUAC-based prediction flash point for the water + 1-butanol + 2-butanol mixture.
As in the case of binary aqueous−organic solutions mentioned above, the agreement is excellent over the entire flammable range except near the water-rich mutual solubility region (Table 11). Again, this can be attributed to the failure of the constant lower flammable limit assumption in the mutual solubility water-rich region. Overall, the predictions are consistent with the experimental data, as confirmed by the low average deviation reported in Table 11.
In deriving the flash point prediction model for ternary partially miscible aqueous−organic mixtures, it was assumed that the liquid phases are in equilibrium. Underlined is the assumption of perfect mixing of the mixture. If that is not the case in real tank conditions, further deviations between the model predictions and the experimental flash point may occur.
In this study, the binary parameters regressed on binary solutions were used in the flash-point prediction of ternary solution and the predictions gave good agreement with the measurements. However, it is not guaranteed that the use of binary parameters regressed on binary solutions is better than the analogue regressed on ternary solutions when predicting flash point of ternary solutions. The predictive capability of the proposed model depends on the quality of the parameters.
Conclusion
The paper presents the first measurements of flash point for ternary partially miscible aqueous−organic mixtures. The flash-point model of Liaw et al. accounting for the non-ideality of the liquid phase in such mixtures and considering the liquid–liquid equilibrium is able to predict satisfactorily the experimental data, using binary interaction parameters from the literature. In particular, it is able to predict the constant flash-point behavior on any liquid−liquid tie line within the two liquid phase region, which is a property of partially-miscible mixtures. For the aqueous−organic mixtures here studied, a deviation between prediction and measurements is observed, arising from the failure of the constant lower flammable limit assumption in the mutual solubility inert-rich region.
Acknowledgements
The authors would like to thank the National Science Council of the R.O.C. for supporting this study financially under grant #NSC 96-2221-E-039-004-MY2.
Literature Cited
(1) Crowl, D. A.; Louvar, J. F. Chemical Process Safety: Fundamentals with
Applications; Prentice Hall PTR: NJ, 2002.
(2) CCPS/AIChE Guidelines for Engineering Design for Process Safety; American Institute of Chemical Engineers: New York, 1993.
(3) Liaw, H.-J.; Lee, Y.-H.; Tang, C.-L.; Hsu, H.-H.; Liu, J.-H. A mathematical model for predicting the flash point of binary solutions. J. Loss Prevent. Proc.
2002, 15, 429-438.
(4) Liaw, H.-J.; Chiu, Y.-Y. The prediction of the flash point for binary aqueous-organic solutions. J. Hazard. Mater. 2003, 101, 83-106.
(5) Liaw, H.-J.; Chiu, Y.-Y. A general model for predicting the flash point of miscible mixture. J. Hazard. Mater. 2006, 137, 38-46.
(6) UK Atomic Energy Authority, Major Hazard Incident Data Service (MHIDAS), CD-ROM version; Silver Platter, 2004.
(7) DOT, Shippers – General Requirements for Shipments and Packagings, Class3 –
Assignment of Packing Group, 49CFR173.121, National Archives and Records
(8) Regulations, Regulation (EC) No. 1272/2008 of the European Parliament and of the Council, on Classification, Labeling and Packaging of Substances and Mixtures, Amending and Repealing Directives 67/548/EEC and 1999/45/EC, and Amending Regulation (EC) No. 1907/2006. Official J. Eur. Union. 2008, L353. (9) Kurihara, K.; Midorikawa, T.; Hashimoto, T.; Kojima K.; Ochi, K. Liquid-Liquid
solubilities for the binary system of methanol with octane and 2,2,4-trimethylpentane. J. Chem. Eng. Japan. 2002, 35, 360-364.
(10) Matsuda, H.; Ochi, K. Liquid-liquid equilibrium data for binary alcohol + n-alkane (C10-C16) systems: methanol + decane, ethanol + tetradecane, and ethanol + hexadecane. Fluid Phase Equilib. 2004, 224, 31-37.
(11) Kosuge, H.; Iwakabe, K. Estimation of isobaric vapor-liquid-liquid equilibria for partially miscible mixture of ternary system. Fluid Phase Equilib. 2005, 233, 47-55.
(12) Liaw, H.-J.; Lu, W.-H.; Gerbaud, V.; Chen, C.-C. Flash-point prediction for binary partially miscible mixtures of flammable solvents. J. Hazard. Mater.
2008, 153, 1165-1175.
(13) Liaw, H.-J.; Chen, C.-T.; Gerbaud, V. Flash-point prediction for binary partially miscible aqueous-organic mixtures. Chem. Eng. Sci. 2008, 63, 4543-4554. (14) Liaw, H.-J.; Gerbaud, V.; Chiu, C.-Y. Flash point for ternary partially miscible
mixtures of flammable solvents. J. Chem. Eng. Data 2010, 55, 134-146.
(15) Liaw, H.-J.; Gerbaud, V.; Chen, C.-C.; Shu, C.-M. Effect of stirring on the safety of flammable liquid mixtures. J. Hazard. Mater. 2010, 177,1093-1101.
(16) Affens, W. A.; McLaren, G. W. Flammability properties of hydrocarbon solutions in air. J. Chem. Eng. Data 1972, 17, 482-488.
(17) White, D.; Beyler, C. L.; Fulper, C.; Leonard, J. Flame spread on aviation fuels.
Fire Safety J. 1997, 28, 1-31.
(18) Garland, R. W.; Malcolm, M. O. Evaluating vent manifold inerting requirements: flash point modeling for organic acid-water mixtures. Process Saf. Prog. 2002,
21, 254-260.
(19) Liaw, H.-J.; Tang, C.-L.; Lai, J.-S. A model for predicting the flash point of ternary flammable solutions of liquid. Combust. Flame 2004, 138, 308-319. (20) Liaw, H.-J.; Wang, T.-A. A non-ideal model for predicting the effect of dissolved
salt on the flash point of solvent mixtures. J. Hazard. Mater. 2007, 141, 193-201.
(21) Catoire, L.; Paulmier, S.; Naudet, V. Estimation of closed cup flash points of combustible solvent blends. J. Phys. Chem. Ref. Data 2006, 35, 9-14.
(22) Gmehling, J.; Rasmussen, P. Flash points of flammable liquid mixtures using UNIFAC. Ind. Eng. Chem. Fundam. 1982, 21, 186-188.
(23) Lee, S.-J.; Ha, D.-M. The lower flash points of binary systems containing non-flammable component. Korean J. Chem. Eng. 2003, 20, 799-802.
(24) Liaw, H.-J.; Lee, T.-P.; Tsai, J.-S.; Hsiao, W.-H.; Chen, M.-H.; Hsu, T.-T. Binary liquid solutions exhibiting minimum flash-point behavior. J. Loss Prevent. Proc.
2003, 16, 173-186.
(25) Liaw, H.-J.; Lin, S.-C. Binary mixtures exhibiting maximum flash-point behavior.
J. Hazard. Mater. 2007, 140, 155-164.
(26) Liaw, H.-J.; Chen, C.-T.; Cheng, C.-C.; Yang, Y.-T. Elimination of minimum flash-point behavior by addition of a specified third component. J. Loss Prevent.
Proc. 2008, 21, 82-100.
(27) Vidal, M.; Rogers, W.J.; Mannan, M.S. Prediction of minimum flash point behaviour for binary mixtures. Process Safety and Environmental Protection
2006, 84, 1-9.
(28) ASTM D 56, Standard test method for flash point by Tag closed tester; American Society for Testing and Materials: West Conshohocken, PA, 1999. (29) Mannan, S. Lees’ Loss Prevention in the Process Industries; 3rd ed.; Elsevier
Butterworth-Heinemann: Oxford, U.K., 2005; Vol. 1.
(30) Poling, B. E.; Prausnitz, J. M.; O’Connell, J. P. The Properties of Gases and
Liquids; 5th ed.; McGraw-Hill: New York, 2001.
(31) Renon, H.; Prausnitz, J. M. Local compositions in thermodynamic excess functions for liquid mixtures. AIChE J. 1968, 14, 135-144.
(32) Abrams, D. S.; Prausnitz, J. M. Statistical thermodynamics of liquid mixtures: new expression for the excess Gibbs energy of partly or completely miscible systems. AIChE J. 1975, 21, 116-128.
(33) Wilson, G. M. Vapor liquid equilibrium. XI. A new expression for the excess free energy of mixing. J. Am. Chem. Soc. 1964, 86, 127-130.
(34) Van Ness H. C.; Abbott, M. M. Classical Thermodynamics of Nonelectrolyte
Solutions: With Applications to Phase Equilibria; McGraw-Hill: New York,
1982.
distillations-1. heterogeneous phase diagrams. Chem. Eng. Sci. 1990, 45, 1823-1836.
(36) Smith, J. M.; Van Ness, N. C. Introduction to Chemical Engineering
Thermodynamics, 3rd ed.; McGraw-Hill: New York, 1975.
(37) Vidal, J. Thermodynamics: Applications in Chemical Engineering and the
Petroleum Industry; Technip Editions: Paris, France, 2003.
(38) Kosuge, H.; Iwakabe, K. Estimation of isobaric vapor-liquid-liquid equilibria for partially miscible mixture of ternary system. Fluid Phase Equilibria 2005, 233, 47-55.
(39) Gmehling, J.; Onken, U.; Arlt, W. Vapor−Liquid Equilibrium Data Collection,
Part 1a; DECHEMA: Frankfurt, Germany, 1981, p330,338.
(40) Gmehling, J.; Onken, U.; Arlt, W. Vapor−Liquid Equilibrium Data Collection,
Part 2b; DECHEMA: Frankfurt, Germany, 1978; Vol. 1, p150. (41) Merck, The Merck Index, twelfth ed.; Merck & CO.: NJ, 1996.
(42) SFPE, The SFPE Handbook of Fire Protection Engineering, 2nd ed.; Society of Fire Protection Engineers: Boston, 1995.
(43) NIOSH Pocket Guide to Chemical Hazards,
http://www.cdc.gov/noish/npg/npgname-o.html (accessed 2008).
(44) Fisher Scientific,
https://www.fishersci.com/wps/portal/CMSTATIC?pagename=msds (accessed 2008).
(45) Tedia, http://www.tedia.com/products.php3 (accessed 2008).
(46) Oxford University, The Physical and Theoretical Chemistry Laboratory,
http://physchem.ox.ac.uk (accessed 2008)..
(47) Univar USA, http://www.univarusa.com/assistmsds.htm (accessed 2008).
(48) Mallinckrodt Baker,
http://www.mallbaker.com/Americas/catalog/default.asp?searchfor=msds
(accessed 2008).
(49) Michael, G., Zabetakis, Flammability Characteristics of Combustible Gases and
Vapors; U.S. Dept of the Interior, Bureau of Mines, Washington, USA., 1965.
(50) Le Chatelier, H. Estimation of firedamp by flammability limits. Ann. Mines 1891, 19, 388-395.
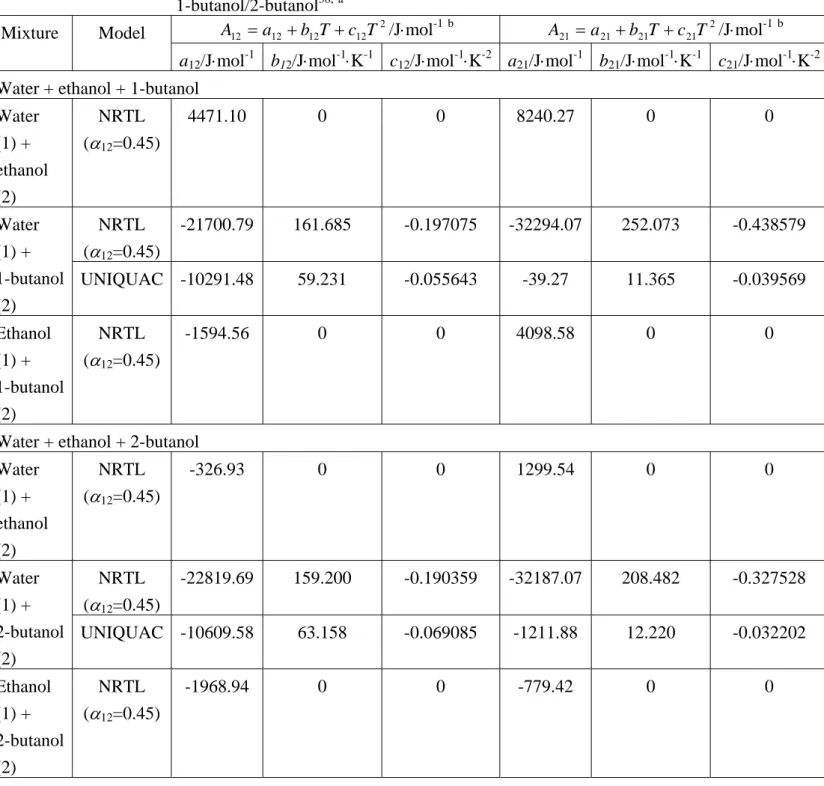
Table 1 LLE parameters for the binary solutions of water, ethanol, 1-butanol/2-butanol38,a 2 12 12 12 12 a b T c T A = + + /J⋅mol-1b A21 =a21 +b21T +c21T2/J⋅mol-1b Mixture Model
a12/J⋅mol-1 b12/J⋅mol-1⋅K-1 c12/J⋅mol-1⋅K-2 a21/J⋅mol-1 b21/J⋅mol-1⋅K-1 c21/J⋅mol-1⋅K-2
Water + ethanol + 1-butanol Water (1) + ethanol (2) NRTL (α12=0.45) 4471.10 0 0 8240.27 0 0 NRTL (α12=0.45) -21700.79 161.685 -0.197075 -32294.07 252.073 -0.438579 Water (1) + 1-butanol (2) UNIQUAC -10291.48 59.231 -0.055643 -39.27 11.365 -0.039569 Ethanol (1) + 1-butanol (2) NRTL (α12=0.45) -1594.56 0 0 4098.58 0 0
Water + ethanol + 2-butanol Water (1) + ethanol (2) NRTL (α12=0.45) -326.93 0 0 1299.54 0 0 NRTL (α12=0.45) -22819.69 159.200 -0.190359 -32187.07 208.482 -0.327528 Water (1) + 2-butanol (2) UNIQUAC -10609.58 63.158 -0.069085 -1211.88 12.220 -0.032202 Ethanol (1) + 2-butanol (2) NRTL (α12=0.45) -1968.94 0 0 -779.42 0 0 a
LLE parameters for partially miscible binary pairs were determined from binary solubility data, and the analogues for others were determined from ternary VLLE data.
b
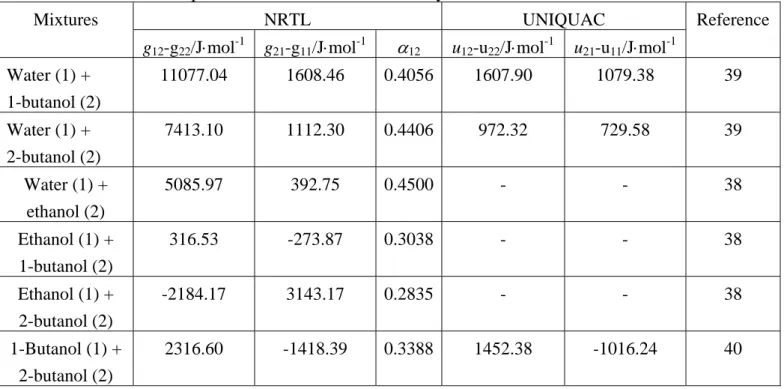
Table 2 VLE parameters determined from binary VLE data
NRTL UNIQUAC Mixtures
g12-g22/J⋅mol-1 g21-g11/J⋅mol-1 α12 u12-u22/J⋅mol-1 u21-u11/J⋅mol-1
Reference Water (1) + 1-butanol (2) 11077.04 1608.46 0.4056 1607.90 1079.38 39 Water (1) + 2-butanol (2) 7413.10 1112.30 0.4406 972.32 729.58 39 Water (1) + ethanol (2) 5085.97 392.75 0.4500 - - 38 Ethanol (1) + 1-butanol (2) 316.53 -273.87 0.3038 - - 38 Ethanol (1) + 2-butanol (2) -2184.17 3143.17 0.2835 - - 38 1-Butanol (1) + 2-butanol (2) 2316.60 -1418.39 0.3388 1452.38 -1016.24 40
Table 3 Antoine coefficients and relative van der Waals volumes (r) and surface areas (q)
Antoine coefficients39, a Relative van der Waals volumes (r) and surface
areas (q)30 Material A B C r q 1-Butanol 6.96280 1558.190 -76.119 3.4543 3.052 2-Butanol 6.59909 1314.188 -86.500 3.4535 3.048 Ethanol 4.46155 1648.220 -42.232 2.1055 1.972 Water - - - 0.9200 1.400 a log(P/kPa)=A-B/[(T/K)+C]
Table 4 Comparison of flash-point values adopted from the literature, tfp,lit, with experimentally derived data, tfp,exp
Component tfp,exp/°C a tfp,lit/°C
Ethanol 13.0 ± 0.6 1341,42 1-Butanol 36.9 ± 2.8 28.8843 3441 3544-46 3647 3748 2-Butanol 22.0 ± 2.4 23.8843 2441,44 2646 28.8845 a
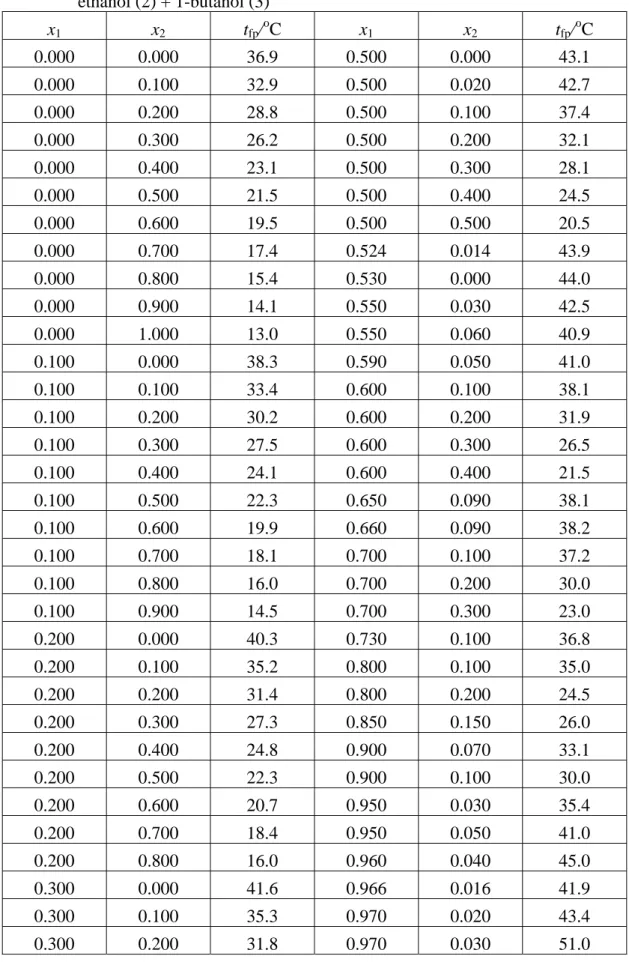
Table 5 Measured flash point within the mutual solubility region for water (1) + ethanol (2) + 1-butanol (3) x1 x2 tfp/oC x1 x2 tfp/oC 0.000 0.000 36.9 0.500 0.000 43.1 0.000 0.100 32.9 0.500 0.020 42.7 0.000 0.200 28.8 0.500 0.100 37.4 0.000 0.300 26.2 0.500 0.200 32.1 0.000 0.400 23.1 0.500 0.300 28.1 0.000 0.500 21.5 0.500 0.400 24.5 0.000 0.600 19.5 0.500 0.500 20.5 0.000 0.700 17.4 0.524 0.014 43.9 0.000 0.800 15.4 0.530 0.000 44.0 0.000 0.900 14.1 0.550 0.030 42.5 0.000 1.000 13.0 0.550 0.060 40.9 0.100 0.000 38.3 0.590 0.050 41.0 0.100 0.100 33.4 0.600 0.100 38.1 0.100 0.200 30.2 0.600 0.200 31.9 0.100 0.300 27.5 0.600 0.300 26.5 0.100 0.400 24.1 0.600 0.400 21.5 0.100 0.500 22.3 0.650 0.090 38.1 0.100 0.600 19.9 0.660 0.090 38.2 0.100 0.700 18.1 0.700 0.100 37.2 0.100 0.800 16.0 0.700 0.200 30.0 0.100 0.900 14.5 0.700 0.300 23.0 0.200 0.000 40.3 0.730 0.100 36.8 0.200 0.100 35.2 0.800 0.100 35.0 0.200 0.200 31.4 0.800 0.200 24.5 0.200 0.300 27.3 0.850 0.150 26.0 0.200 0.400 24.8 0.900 0.070 33.1 0.200 0.500 22.3 0.900 0.100 30.0 0.200 0.600 20.7 0.950 0.030 35.4 0.200 0.700 18.4 0.950 0.050 41.0 0.200 0.800 16.0 0.960 0.040 45.0 0.300 0.000 41.6 0.966 0.016 41.9 0.300 0.100 35.3 0.970 0.020 43.4 0.300 0.200 31.8 0.970 0.030 51.0
0.300 0.300 28.1 0.975 0.025 53.5 0.300 0.400 25.5 0.980 0.003 44.3 0.300 0.500 22.8 0.980 0.020 58.5 0.300 0.600 20.0 0.985 0.000 44.9 0.300 0.700 17.5 0.988 0.012 70.0 0.400 0.000 42.1 0.990 0.000 50.7 0.400 0.100 37.0 0.992 0.000 54.2 0.400 0.200 32.3 0.993 0.000 55.6 0.400 0.300 28.6 0.994 0.000 58.5 0.400 0.400 25.2 0.995 0.000 63.6 0.400 0.500 21.7 0.996 0.000 68.1 0.400 0.600 19.0
Table 6 Measured flash point within the two liquid phase region for water (1) + ethanol (2) + 1-butanol (3) x1 x2 tfp/oC x1 x2 tfp/oC 0.540 0.000 44.4 0.807 0.073 37.4 0.547 0.014 43.1 0.825 0.068 37.3 0.550 0.000 44.5 0.830 0.052 39.2 0.562 0.012 43.8 0.843 0.063 37.8 0.600 0.000 44.1 0.862 0.059 37.8 0.616 0.053 41.5 0.876 0.006 43.7 0.633 0.050 40.8 0.880 0.042 39.6 0.647 0.050 41.1 0.880 0.054 37.5 0.667 0.010 43.4 0.882 0.024 41.7 0.700 0.000 44.7 0.883 0.054 37.5 0.705 0.078 39.1 0.900 0.000 44.1 0.712 0.076 39.0 0.928 0.004 43.4 0.726 0.041 41.5 0.930 0.032 39.4 0.729 0.072 39.5 0.940 0.031 39.4 0.771 0.008 43.7 0.950 0.000 44.8 0.778 0.082 37.2 0.959 0.004 43.7 0.781 0.062 39.1 0.960 0.016 41.3 0.788 0.080 37.0 0.980 0.000 44.2 0.800 0.000 43.8 0.982 0.000 44.3 0.804 0.033 40.9 0.983 0.000 43.9
Table 7 Measured flash point within the mutual solubility region for water (1) + ethanol (2) + 2-butanol (3) x1 x2 tfp/oC x1 x2 tfp/oC 0.000 0.000 22.0 0.600 0.100 27.4 0.000 0.100 20.6 0.600 0.200 26.4 0.000 0.200 20.4 0.600 0.300 24.2 0.000 0.300 18.7 0.600 0.400 21.5 0.000 0.400 18.4 0.630 0.01 30.0 0.000 0.500 17.2 0.650 0.000 29.9 0.000 0.600 15.8 0.660 0.030 29.4 0.000 0.700 15.6 0.690 0.040 29.2 0.000 0.800 14.9 0.699 0.011 30.5 0.000 0.900 14.2 0.700 0.100 28.4 0.000 1.000 13.0 0.700 0.200 26.5 0.100 0.000 23.3 0.700 0.300 23.0 0.100 0.100 22.0 0.719 0.010 29.6 0.100 0.200 20.5 0.719 0.018 30.6 0.100 0.300 20.3 0.720 0.030 29.9 0.100 0.400 19.7 0.721 0.010 29.5 0.100 0.500 18.1 0.741 0.017 30.5 0.100 0.600 17.7 0.741 0.024 30.0 0.100 0.700 16.8 0.750 0.024 30.2 0.100 0.800 15.6 0.750 0.050 29.6 0.100 0.900 14.5 0.752 0.021 29.6 0.200 0.000 25.0 0.760 0.028 29.9 0.200 0.100 23.7 0.760 0.217 25.3 0.200 0.200 22.2 0.765 0.023 30.8 0.200 0.300 21.4 0.770 0.050 29.8 0.200 0.400 20.0 0.781 0.027 30.1 0.200 0.500 18.9 0.787 0.026 30.3 0.200 0.600 17.7 0.792 0.026 30.8 0.200 0.700 17.5 0.800 0.100 28.5 0.200 0.800 16.0 0.800 0.200 24.5 0.300 0.000 26.1 0.802 0.026 30.0 0.300 0.100 24.7 0.840 0.022 30.8 0.300 0.200 23.4 0.850 0.05 29.8 0.300 0.300 22.3 0.850 0.150 26.0
0.300 0.400 21.2 0.900 0.100 30.0 0.300 0.500 20.1 0.901 0.014 29.4 0.300 0.600 19.3 0.901 0.085 30.3 0.300 0.700 17.5 0.907 0.014 29.8 0.390 0.010 26.8 0.911 0.013 29.8 0.400 0.000 27.1 0.913 0.015 30.3 0.400 0.100 25.8 0.920 0.015 30.4 0.400 0.200 24.4 0.921 0.012 30.7 0.400 0.300 23.1 0.929 0.008 30.4 0.400 0.400 21.8 0.930 0.012 30.6 0.400 0.500 19.9 0.940 0.008 29.1 0.400 0.600 19.0 0.948 0.004 29.0 0.420 0.010 27.9 0.950 0.050 41.0 0.450 0.010 27.9 0.960 0.040 45.0 0.460 0.010 28.5 0.970 0.000 31.9 0.490 0.010 28.7 0.970 0.030 51.0 0.500 0.000 28.6 0.975 0.025 53.5 0.500 0.100 27.0 0.980 0.000 36.1 0.500 0.200 26.0 0.980 0.020 58.5 0.500 0.300 23.6 0.988 0.012 70.0 0.500 0.400 22.2 0.990 0.000 45.7 0.500 0.500 20.5 0.993 0.000 51.6 0.560 0.010 28.4 0.995 0.000 58.6 0.600 0.000 29.0 0.996 0.000 64.7
Table 8 Measured flash point within the two liquid phase region for water (1) + ethanol (2) + 2-butanol (3) x1 x2 tfp/oC x1 x2 tfp/oC 0.670 0.000 29.4 0.836 0.019 29.8 0.680 0.000 30.1 0.883 0.015 30.0 0.690 0.000 30.0 0.885 0.011 30.1 0.700 0.000 29.6 0.886 0.005 30.1 0.726 0.009 30.0 0.892 0.014 30.0 0.763 0.016 29.6 0.900 0.000 29.4 0.775 0.017 29.9 0.918 0.004 29.8 0.790 0.022 30.0 0.923 0.005 30.3 0.800 0.000 29.7 0.936 0.004 30.2 0.813 0.020 30.0 0.950 0.000 29.8 0.822 0.007 30.1 0.950 0.004 30.5 0.830 0.014 29.8
Table 9 Measured flash point within the mutual solubility region for water (1) + 1-butanol (2) + 2-butanol (3) x1 x2 tfp/oC x1 x2 tfp/oC 0.000 0.000 22.0 0.400 0.200 31.4 0.000 0.100 22.7 0.400 0.300 33.1 0.000 0.200 24.0 0.400 0.400 35.1 0.000 0.300 25.5 0.400 0.500 38.2 0.000 0.400 26.3 0.400 0.600 42.1 0.000 0.500 28.0 0.500 0.000 28.6 0.000 0.600 29.3 0.500 0.100 30.6 0.000 0.700 30.9 0.500 0.200 32.6 0.000 0.800 32.3 0.500 0.300 35.7 0.000 0.900 33.6 0.500 0.400 38.6 0.000 1.000 36.9 0.500 0.500 43.1 0.100 0.000 23.3 0.530 0.470 44.0 0.100 0.100 24.5 0.560 0.177 34.8 0.100 0.200 26.0 0.577 0.247 36.4 0.100 0.300 26.8 0.600 0.000 29.0 0.100 0.400 28.6 0.600 0.100 31.9 0.100 0.500 30.0 0.600 0.200 35.3 0.100 0.600 31.7 0.640 0.030 31.5 0.100 0.700 33.4 0.650 0.000 29.9 0.100 0.800 35.1 0.960 0.003 31.5 0.100 0.900 38.3 0.967 0.001 32.8 0.200 0.000 25.0 0.970 0.000 31.9 0.200 0.100 26.1 0.971 0.005 37.4 0.200 0.200 27.1 0.977 0.006 38.8 0.200 0.300 29.1 0.980 0.000 36.1 0.200 0.400 30.9 0.980 0.010 37.7 0.200 0.500 32.5 0.981 0.002 37.5 0.200 0.600 34.4 0.982 0.008 39.0 0.200 0.700 36.9 0.985 0.015 44.9 0.200 0.800 40.3 0.990 0.000 45.7 0.300 0.000 26.1 0.990 0.010 50.7 0.300 0.100 27.5 0.992 0.008 54.2 0.300 0.200 28.9 0.993 0.000 51.6
0.300 0.300 31.2 0.993 0.001 52.5 0.300 0.400 33.1 0.993 0.007 55.6 0.300 0.500 35.3 0.994 0.006 58.5 0.300 0.600 37.3 0.995 0.000 58.6 0.300 0.700 41.6 0.995 0.005 63.6 0.400 0.000 27.1 0.996 0.000 64.7 0.400 0.100 29.1 0.996 0.004 68.1
Table 10 Measured flash point within the two liquid phase region for water (1) + 1-butanol (2) + 2-butanol (3) x1 x2 tfp/oC x1 x2 tfp/oC 0.538 0.363 39.9 0.779 0.172 39.3 0.540 0.460 44.4 0.791 0.121 36.8 0.550 0.360 39.9 0.799 0.079 34.5 0.550 0.450 44.5 0.800 0.000 29.7 0.577 0.170 34.2 0.800 0.200 43.8 0.579 0.331 39.3 0.806 0.045 32.3 0.580 0.250 37.1 0.812 0.016 30.9 0.594 0.163 34.1 0.880 0.093 39.4 0.600 0.400 44.1 0.883 0.066 36.9 0.606 0.230 37.0 0.885 0.025 32.5 0.611 0.156 34.3 0.885 0.044 34.8 0.615 0.091 32.7 0.886 0.009 31.1 0.628 0.149 33.9 0.900 0.000 29.4 0.647 0.083 32.8 0.900 0.100 44.1 0.663 0.030 31.6 0.950 0.000 29.8 0.670 0.000 29.4 0.950 0.050 44.8 0.679 0.252 39.4 0.954 0.003 30.8 0.680 0.000 30.1 0.957 0.022 36.3 0.690 0.000 30.0 0.965 0.006 33.1 0.698 0.176 36.4 0.970 0.009 34.7 0.700 0.000 29.6 0.975 0.012 36.8 0.700 0.300 44.7 0.980 0.014 39.4 0.714 0.114 34.0 0.980 0.020 44.2 0.726 0.064 32.4 0.982 0.018 44.3 0.738 0.023 31.1 0.983 0.017 43.9
Table 11 Deviation between calculated and experimental flash points, a, for the studied binary pairs and ternary solutions comparing models
fp T
Δ
NRTL UNIQUAC VLE VLLE VLE VLLE Mixture ΔTfp/K ΔTfp/K ΔTfp/K ΔTfp/K Eethanol + 1-butanol 0.22 - - - Ethanol + 2-butanol 0.32 - - - 1-Butanol + 2-butanol 0.44 - 0.43 - Water + ethanol 2.94 b 7.52 c 0.44 d - - - Water + 1-butanol - 2.68 b 9.75 e 0.32 f - 1.28 b 2.96 e 0.72 f Water + 2-butanol - 1.25 b 3.57 e 0.32 f - 1.00 b 2.53 e 0.38 f Water + ethanol + 1-butanol - 1.26 b 6.90 g 0.46 h - - Water + ethanol + 2-butanol - 0.81 b 4.86 g 0.35 h - - Water + 1-butanol + 2-butanol - 1.01 b 4.54 e 0.37 f - 1.00 b 3.71 e 0.41 f a
deviation of flash point: T T T N N pred fp fp fp =
∑
,exp.− , . / Δ b ΔTfp over the entire flammable range
c ΔT
fp for xwater ≥ 0.9
d ΔT
fp for xwater < 0.9
e ΔT
fp for water-rich region
f ΔT
fp over the entire flammable excluding water-rich region
g ΔT
fp for mutual solubility region of water-rich with xwater ≥ 0.9
h ΔT
fp over the entire flammable excluding mutual solubility region of water-rich with
Table 12 Comparison of estimated values for equilibrium composition between liquid phases, x1,2LP, and its flash point, t2LP, with corresponding experimental data
Estimated value NRTL UNIQUAC Experimental data System x1,2LP t2LP/°C x1,2LP t2LP/°C x1,2LP t2LP/°C c Water (1) + 1-Butanol (2) 0.542 a 0.986 a 0.541 b 0.985 b 44.40 a 44.38 b 0.526 a 0.987 a 0.531 b 0.986 b 43.29 a 43.32 b 0.540 0.983 44.2 ± 0.7 Water (1) + 2-Butanol (2) 0.674 a 0.958 a 0.673 b 0.957 b 30.18 a 30.17 b 0.669 a 0.958 a 0.666 b 0.959 b 30.14 a 29.68 b 0.670 0.950 29.7 ± 0.5 a this study b previous study13 c
Table 13 Comparison of predicted flash-point values, tfp,pred, in the estimated tie lines with corresponding experimental data, tfp,exp, for water (1) + ethanol (2) + 1-butanol (3)
Prediction Measurement Span of tie line Span of tie line
No. of tie line x1 x3 tfp,pred/oC x1 x3 tfp,exp/oC a 0.9859 0.0141 0.983 0.017 #1 0.5425 0.4575 44.40 0.540 0.460 44.2 ± 0.7 0.9800 0.0166 0.959 0.037 #2 0.5658 0.4213 43.76 0.547 0.439 43.5 ± 0.5 0.9600 0.0240 0.960 0.024 #3 0.6474 0.3029 41.66 0.616 0.331 41.3 ± 0.7 0.9300 0.0373 0.940 0.030 #4 0.7344 0.1938 39.52 0.705 0.217 39.3 ± 0.4 0.8800 0.0653 0.883 0.063 #5 0.8200 0.1095 37.49 0.778 0.140 37.4 ± 0.6 a
Table 14 Comparison of predicted flash-point values, tfp,pred, in the estimated tie lines with corresponding experimental data, tfp,exp, for water (1) + ethanol (2) + 2-butanol (3)
Prediction Measurement Span of tie line Span of tie line
No. of tie line x1 x3 tfp,pred/oC x1 x3 tfp,exp/oC a 0.9576 0.0424 0.95 0.05 #1 0.6736 0.3264 30.18 0.67 0.03 29.7 ± 0.5 0.9480 0.0480 0.923 0.072 #2 0.6988 0.2901 30.12 0.726 0.265 30.1 ± 0.5 0.9400 0.0525 0.936 0.060 #3 0.7190 0.2629 30.08 0.763 0.221 29.9 ± 0.4 0.9300 0.0585 0.892 0.094 #4 0.7409 0.2350 30.03 0.790 0.188 30.0 ± 0.2 a
Table 15 Comparison of predicted flash-point values, tfp,pred, in the estimated tie lines with corresponding experimental data, tfp,exp, for water (1) + 1-butanol (2) + 2-butanol (3)
Prediction Measurement Span of tie line Span of tie line
No. of
tie line Activity coefficient model x1 x3 tfp,pred/o C x1 x3 tfp,exp/oC a 0.9576 0.0424 0.95 0.05 NRTL 0.6736 0.3264 30.18 0.67 0.03 0.9575 0.0425 #1 UNIQUAC 0.6689 0.3311 30.14 29.7 ± 0.5 0.9600 0.0374 0.954 0.043 NRTL 0.6633 0.3070 31.24 0.663 0.307 0.9610 0.0366 #2 UNIQUAC 0.6576 0.3127 31.03 31.1 ± 0.6 0.9650 0.0288 0.965 0.029 NRTL 0.6468 0.2700 32.74 0.615 0.294 0.9660 0.0283 #3 UNIQUAC 0.6395 0.2781 32.54 32.6 ± 0.6 0.9700 0.0207 0.970 0.021 NRTL 0.6282 0.2229 34.58 0.577 0.253 0.9710 0.0203 #4 UNIQUAC 0.6183 0.2317 34.40 34.3 ± 0.6 0.9750 0.0132 0.975 0.013 NRTL 0.6061 0.1637 36.90 0.58 0.17 0.9760 0.0128 #5 UNIQUAC 0.5928 0.1700 36.74 36.8 ± 0.6 0.9800 0.0063 0.980 0.006 NRTL 0.5785 0.0902 39.95 0.538 0.099 0.9810 0.0058 #6 UNIQUAC 0.5610 0.0892 39.77 39.5 ± 0.6 0.9859 0.0000 0.983 0.000 NRTL 0.5425 0.0000 44.40 0.540 0.000 0.9869 0.0000 #7 UNIQUAC 0.5263 0.0000 43.29 44.2 ± 0.7 a
Indicator / Operating Display Sample Thermometer Thermocouple Test Cup Electric Igniter External Cooling System Heating Block
Flash points of flammable components, Ti,fp
Estimate Pisat,fp
Assume flash point at tie line, T2LP
Calculate γi
Print results: flash point of the mixture, T
Liquid composition of the mixture, xi
Yes
No
Assume phase composition of the liquid-liquid equilibrium,
xi,2LP Is Eq. (3) satisfied? Adjust xi,2LP No Calculate Pisat No Print xi,2LP, T2LP
Assume flash point of the mixture, T
Estimation of flash
point in
mutual-solubility region
Estimation of
the tie lines and
their flash point
temperature
Yes Yes Estimate T2LP ? 2 <ε ΔTLP Calculate Pisat Estimate T ? ε < ΔT ? 2 <ε ΔT LP Calculate γi Calculate γi No Yes LLE Parameters VLE Parameters VLE ParametersFigure 2. Procedure for evaluation of flash point for ternary partially miscible aqueous−organic mixtures.
0
0.2
0.4
0.6
0.8
1
x
10
20
40
60
80
t
fp/
oC
Figure 3. Comparison of predicted flash point and experimental data for miscible binary pairs of studied ternary mixtures. , prediction by the NRTL equation; , prediction by the UNIQUAC equation;
, ethanol (1) + 1-butanol (2); , ethanol (1) + 2-butanol (2); , water (1) + ethanol (2); , 1-butanol (1) + 2-butanol (2).
0 0.2 0.4 0.6 0.8 1
x
1 20 40 60 80t
fp/
oC
Figure 4. Comparison of predicted flash point and experimental data for water + 1-butanol and water + 2-butanol. , prediction by the NRTL equation; , prediction by the UNIQUAC equation; , water (1) + 1-butanol (2); , water (1) + 2-butanol (2).
water 0.0 0.1 0.2 0.3 0.4 0.5 0.6 0.7 0.8 0.9 1.0 ethanol 0.0 0.1 0.2 0.3 0.4 0.5 0.6 0.7 0.8 0.9 1.0 1-butanol 0.0 0.1 0.2 0.3 0.4 0.5 0.6 0.7 0.8 0.9 1.0 x2 x1 x3 water 0.5 0.6 0.7 0.8 0.9 1.0 ethanol 0.0 0.1 0.2 0.3 0.4 0.5 1-butanol 0.0 0.1 0.2 0.3 0.4 0.5 x1 x2 x3
(a) the whole diagram (b) hetergeneous region
water 0.0 0.1 0.2 0.3 0.4 0.5 0.6 0.7 0.8 0.9 1.0 ethanol 0.0 0.1 0.2 0.3 0.4 0.5 0.6 0.7 0.8 0.9 1.0 2-butanol 0.0 0.1 0.2 0.3 0.4 0.5 0.6 0.7 0.8 0.9 1.0 x1 x2 x3 water 0.6 0.7 0.8 0.9 1.0 ethanol 0.0 0.1 0.2 0.3 0.4 2-butanol 0.0 0.1 0.2 0.3 0.4 x1 x2 x3
(a) the whole diagram
(b) hetergeneous region
water 0.0 0.1 0.2 0.3 0.4 0.5 0.6 0.7 0.8 0.9 1.0 1-butanol 0.0 0.1 0.2 0.3 0.4 0.5 0.6 0.7 0.8 0.9 1.0 2-butanol 0.0 0.1 0.2 0.3 0.4 0.5 0.6 0.7 0.8 0.9 1.0 x1 x2 x3 water 0.5 0.6 0.7 0.8 0.9 1.0 1-butanol 0.0 0.1 0.2 0.3 0.4 0.5 2-butanol 0.0 0.1 0.2 0.3 0.4 0.5 x1 x2 x3
(a) the whole diagram (b) hetergeneous region
Figure 7. Binodal curves of water (1) + 1-butanol (2) + 2-butanol (3). , partially miscible; , miscible; , NRTL; ,
28 30 32 34 36 38 40 42 44 46 0.5 0.6 0.7 0.8 0.9 1.0 0.0 0.1 0.2 0.3 0.4 tfp / o C x1 x3
Figure 8. Comparison of predicted flash points in the tie lines with experimental data for water + ethanol + 1-butanol/2-butanol. , water (1) + ethanol (2) + 1-butanol (3); , water (1) + ethanol (2) + 2-butanol (3); , NRTL.
28 30 32 34 36 38 40 42 44 46 0.7 0.8 0.9 1.0 tfp / o C x1 0.5 0.6 0.0 0.1 0.2 0.3 0.4 x2
Figure 9. Comparison of predicted flash points in the tie lines with experimental data for water (1) + 1-butanol (2) + 2-butanol (3). , experimental data;
10 20 30 40 50 60 70 80 0.0 0.2 0.4 0.6 0.8 1.0 0.0 0.2 0.4 0.6 0.8 tfp / o C x1 x3 0 0.2 0.4 0.6 0.8 1
x
1 10 15 20 25 30 35 40t
fp/
oC
x2=0.1 x2=0.2 x2=0.3 x2=0.4 x2=0.5 x2=0.6 x2=0.9 x2=0.8 x2=0.7(a) three dimensional plot (b) two dimensional plot of mutual solubility region
Figure 10. Comparison of predicted flash point and experimental data for water (1) + ethanol (2) + 1-butanol (3). , experimental data;
10 20 30 40 50 60 70 80 0.0 0.2 0.4 0.6 0.8 1.0 0.0 0.2 0.4 0.6 0.8 tfp / o C x1 x2 0 0.2 0.4 0.6 0.8 1
x
1 12 16 20 24 28 32t
fp/
oC
x2=0.1 x2=0.2 x2=0.3 x2=0.4 x2=0.5 x2=0.6 x2=0.7 x2=0.8 x2=0.9(a) three dimensional plot (b) two dimensional plot of mutual solubility region
Figure 11. Comparison of predicted flash point and experimental data for water (1) + ethanol (2) + 2-butanol (3). , experimental data;
10 20 30 40 50 60 70 80 90 0.0 0.2 0.4 0.6 0.8 1.0 0.0 0.2 0.4 0.6 0.8 tfp / o C x1 x2 0 0.2 0.4 0.6 0.8 1
x
2 20 25 30 35 40 45t
fp/o
C
x1=0.1 x1=0.2 x1=0.3 x1=0.4 x1=0.5(a) three dimensional plot (b) two dimensional plot of mutual solubility region
Figure 12. Comparison of predicted flash point and experimental data for water (1) + 1-butanol (2) + 2-butanol (3). (a). , experimental data;
red , NRTL (mutual solubility region); red , NRTL (tie lines); blue , UNIQUAC (mutual solubility region); blue,