Contents lists available atScienceDirect
Journal of Transport Geography
journal homepage:www.elsevier.com/locate/jtrangeoA ride for whom: Has cycling network expansion reduced inequities in
accessibility in Montreal, Canada?
Maxime Houde
⁎, Philippe Apparicio, Anne-Marie Séguin
Centre Urbanisation Culture Société, Institut national de la recherche scientifique, 385 Sherbrooke Street East, Montréal, Québec H2X 1E3, Canada
A B S T R A C T
It is widely agreed today that the existence of a network of bicycle paths fosters a feeling of safety as well as the use of the bicycle for both recreational and utilitarian purposes. Recent studies have found a link between the presence of cycling infrastructures and gentrification. Few studies have however examined the growth of the cycling networks from the perspective of environmental equity.
The main objective of this study is to determine whether the extension of the cycling network in the urban areas of Montreal and Longueuil and the city of Laval over a quarter of a century (1991 to 2016) has reduced or reinforced inequities in accessibility for low-income populations, recent immigrants, children, and older people. Archival maps were employed to reconstruct the cycling networks in the Montreal area in a GIS for six years (1991, 1996, 2001, 2006, 2011, 2016). Census data and spatial analysis methods were then used to measure whether or not inequities in the accessibility of the cycling network increased over the period in question.
The results show that, in 25 years, the cycling network has more than doubled in size. It can however be seen that some areas are still very poorly served, and that the network lacks connectivity. Low-income individuals have generally enjoyed good accessibility over the entire period. A strong decrease in inaccessibility for recent immigrants and seniors is also observed. The most important result is clearly that there has been little or no improvement for children, who are found to be in a situation of inequity.
1. Introduction
In the last few years, we have seen a revival of bicycling in North America and elsewhere in the world. Some authors even speak of a “bicycle renaissance” (Pucher et al., 2011). In order to facilitate bicycle travel over the territory and to increase cyclists' safety, we have also seen the growth of cycling infrastructures in many North American cities. It is important to remember that bicycling, as a mode of active travel, has numerous benefits for people's physical (Buekers et al., 2015; Celis-Morales et al., 2017;Farrell et al., 2016;Fishman, 2015;Fuller et al., 2013; Götschi et al., 2015) and mental health (Pucher and Dijkstra, 2003;Zhao et al., 2017). Moreover, in a context of combating climate change and reducing greenhouse gas emissions, the bicycle is considered to be one of the most promising means of alternative transportation (Pucher and Buehler, 2005). In short, the bicycle is re-cognized in the literature as an effective means of short- and mid-range travel, as is the case for most trips in urban areas (Fishman, 2015; Pucher et al., 2010).
Recent research in the United States (Portland and Chicago) and Brazil (Rio de Janeiro and Curitiba) has however shown that cycling
infrastructures are not equitably distributed in cities, and that this leads to better access for some populations (Flanagan et al., 2016;Tucker and Manaugh, 2017). Is this observation true for the Montreal area? To answer that question, we decided to analyze the development of the cycling network from 1991 to 2016 in considering the spatial dis-tribution of various population groups defined by age, income, and ethnicity. Have these populations had equitable access over time to the benefits associated with the existence of a cycling network?
2. Literature review
2.1. A cycling network, a sense of security, and the practice of bicycling
Studies have shown that the practice of bicycling is influenced by the presence of cycling infrastructures. Based on a sample of 43 big American cities,Dill and Carr (2003)found a positive correlation be-tween the existence of cycling infrastructures and the level of utility cyclists. The proximity of a bicycle path is said to be a significant en-vironmental factor that has helped to increase the practice of bicycling (Moudon et al., 2005). Cycling infrastructures are determinant not only
https://doi.org/10.1016/j.jtrangeo.2018.02.005
Received 17 November 2017; Received in revised form 31 January 2018; Accepted 20 February 2018
⁎Corresponding author.
E-mail address:[email protected](M. Houde).
0966-6923/ © 2018 Elsevier Ltd. All rights reserved.
in the degree of use of the bicycle, but also in cyclists' sense of security (Fishman, 2015;Reynolds et al., 2009).Pucher et al. (2011)observed that the level of cyclists rose sharply in cities that had developed a wide range of infrastructures and programs to promote use of the bicycle and to increase users' sense of security.
In the Netherlands and Denmark, where there are major cycling networks, a study showed that, from 2004 to 2008, there were 3.5 to 5 times fewer cyclists killed per 100 million kilometres travelled than in the United Sates (Götschi et al., 2015).Teschke et al. (2012)found, among 14 route types, that cycling paths separated by bollards or medians were those with the lowest odds of injury: a risk that was up to one ninth of the risk incurred on a major traffic artery with parked cars and without a cycling infrastructure. Local streets were also seen to involve a very low risk.
In their respective reviews of the literature,Reynolds et al. (2009) andFishman (2015)found that a better street layout helped to increase potential cyclists' sense of security and practicing of bicycling. A Van-couver study suggests that the majority of cyclists prefer off-road paths intended for bicycling only (Winters and Teschke, 2010). In general, they don't like main streets with parked cars. Moreover, although the presence of a cycling network reduces cyclists' stress, experience plays a greater role in lowering the risks of road injury and the sense of in-security on the road (Fernández-Heredia et al., 2014;Moudon et al., 2005). As with many sports, cycling skills improve with time and ex-perience. In this vein, in Charlotte, North Carolina,Boyer (2017)found that experience acquired through recreational cycling helps individuals to gain enough skills to practice utility cycling.
2.2. Cycling and health
Macmillan et al. (2014) emphasize that every dollar invested in cycling infrastructures results in a ten times greater savings in public health services, especially in reducing mortality associated with the lack of physical activity. The greatest health benefits are seen for people who were previously inactive (Fishman, 2015). Indeed, the bicycle has been recognized in the Netherlands as an important means of pre-venting health problems linked to a sedentary lifestyle (Fishman et al., 2015). As well, according tode Hartog et al. (2010), the benefits of changing one's mode of travel from the car to the bicycle outweigh the risks incurred. They also maintain that the benefits of physical activity over the lifetime are nine times greater than the risks connected with exposure to air pollutants. Although the air pollution risks in extreme air pollution concentrations may outweigh the benefits of physical ac-tivity, this applies to fewer than 1% of cities across the globe (Tainio et al., 2016). In a recent study,Celis-Morales et al. (2017)found that the practice of utility cycling was associated with low risks of having a stroke, cancer, or a series of other causes of mortality. It is worth noting that these health benefits may vary by sex and age. For example, Woodcock et al. (2014)found that the positive health impacts of the London cycle hire scheme are greater for men than for women and for older than for younger users.
2.3. Cycling and environmental equity
Studies in the United States (Flanagan et al., 2016;Lee et al., 2016; Lusk et al., 2017;Stein, 2011;Steinbach et al., 2011) and Brazil (Tucker and Manaugh, 2017) have shown that the distribution of cycling net-works is not uniform within cities, which raises issues of environmental equity (Walker, 2009). In other words, we can hypothesize that some population groups defined by socioeconomic status, ethnocultural origin, or age do not have equitable access to the benefits of a cycling network.
Recently,Flanagan et al. (2016)found that there were more cycling infrastructures in the“white” and gentrified neighbourhoods of Chicago and Portland. In New York,Stein (2011)observed that the planning of the cycling network reflected citywide transportation injustices. Some
research shows that use of the bicycle and the presence of cycling in-frastructures are sometimes employed as a lever for gentrification (Hoffmann and Lugo, 2014;Stehlin, 2015).Pucher et al. (2011)found that the growth in use of the bicycle in North America had generally occurred in central cities and specifically in gentrified neighbourhoods near business districts and universities.
From a social justice perspective,Pucher and Buehler (2009) re-cognize that exposure to risks must be limited for all cyclists, and especially for children and seniors, who are more vulnerable. Fernández-Heredia et al. (2014) identified certain individual factors influencing bicycle travel. Some of the recurring and important in-dividual characteristics that they found were age, income, gender, ethnic origin, possession and use of a motor vehicle, and possession of a bicycle. In their systematic review,Aldred et al. (2017)reported that sex and age also have an impact on preference for separated infra-structure. Moreover, factors related to norms and to infrastructural and cultural barriers appear fundamental (Aldred et al., 2016) and were said to have had a dissuasive effect on potential cyclists in the past (Aldred, 2012).
2.4. Population groups studied
According to a number of studies, children (Emond and Handy, 2012;Kaplan et al., 2016;McDonald et al., 2016;Pucher and Buehler, 2009), older people (Aldred et al., 2016;Ekman et al., 2001), low-in-come populations (Bergeron, 2014; Fernández-Heredia et al., 2014; Horton, 2006), and immigrants (Fernández-Heredia et al., 2014;Smart, 2010) would profit from having better access to the cycling network because of the various associated benefits. The question of accessibility is especially important for children and older people due to their phy-siological vulnerability or more limited abilities to manœuvre a bicycle (Armstrong 2013, cited inAldred et al., 2016; Bulsink et al., 2016; Kaplan et al., 2016;Pucher and Buehler, 2009;Sakurai et al., 2016). In addition, because of their social vulnerability, in the United States and Spain (Madrid), low-income populations and immigrants often do not have a car and travel more by bicycle (Fernández-Heredia et al., 2014; Smart, 2010) in central neighbourhoods, where they are exposed to denser traffic.
In this study, we will therefore concentrate on these population groups, which have moreover been selected in a number of studies on environmental equity: that is, children, older persons, people in low-income households, and recent immigrants (Day, 2010;Lee et al., 2016; Lusk et al., 2017; Mulholland, 2008; Séguin and Apparicio, 2013; Steinbach et al., 2011;Talen and Anselin, 1998).
2.5. Research objectives
This research has two objectives. We will first calculate various indicators in order to describe the development of the Montreal's cy-cling network over a 25-year period (1991 to 2016) from the point of view of its expansion, densification and connectivity, in considering the type of bike paths for thefirst dimension. Our second objective is to determine whether the development of the network has led to a re-duction or reinforcement of inequities in accessibility for the four po-pulation groups studied. One of the main contributions of the paper is thus to propose an analysis of the cycling network and its accessibility from a longitudinal perspective, which has until now rarely been done, according toFishman (2015)andBuehler and Dill (2015).
3. Data and methods
3.1. Study area
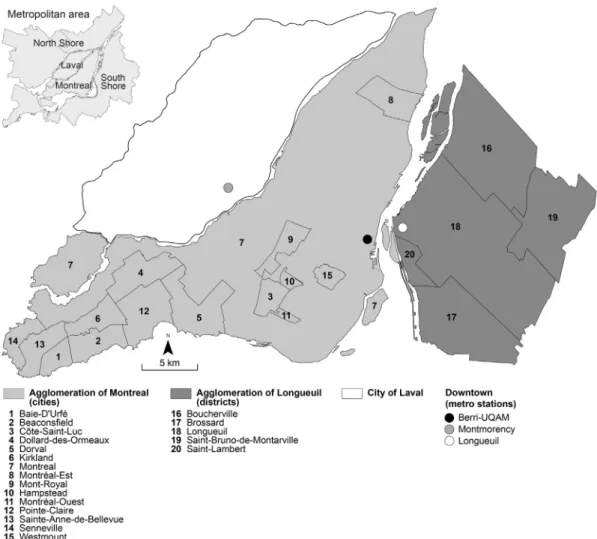
The study area comprises three parts of the Montreal census me-tropolitan area: the urban areas of Montreal and Longueuil, and the city of Laval (Fig. 1). The bicycle path network wasfirst developed in these
three areas, and complete data for the entire study period were avail-able. In 2016, the study area had a surface area of 1030 km2and in-cluded 2.8 million inhabitants, representing 68% of the population of the census metropolitan area. This study area is especially interesting for examining bicycling, as it presents a range of different character-istics: a very developed cycling network, a bike-sharing system (BIXI), the practice of winter bicycling, etc. According toPucher and Buehler (2005)study, at the start of the 2000s, Montreal was the Canadian city with the highest level of bike use for commuting to work, despite its winter being more severe than in other Canadian metropolitan areas. Most of the Montreal studies looked at the impacts of the practice of bicycling on health and/or safety (Apparicio et al., 2016;Fuller et al., 2013; Grenier et al., 2013; Hatzopoulou et al., 2013; Strauss et al., 2013). However, these studies did not analyze the distribution of the cycling network from an environmental equity perspective and from a longitudinal point of view.
3.2. Data collection
3.2.1. Population data
The socioeconomic and socio-demographic data for the period stu-died come from the Statistics Canada population censuses of 1991, 1996, 2001 and 2006, and from the 2011 National Household Survey. Thefiles of the geographic boundaries of the census tracts also come from Statistics Canada. The data extracted from each of the population censuses and from the National Household Survey are the total popu-lation, the population aged 5 to 14, the population aged 65 and over, the population of immigrants who had arrived within < 5 years, and the low-income (after income tax) population.
3.2.2. The cycling and road networks
The cycling network was constructed in ArcGIS using archival maps and open data from the different cities studied. The basic network used is the result of a merger of the various cycling networks in 2016, which are available in digital form for each of the areas: that is, the urban areas of Montreal and Longueuil, and the city of Laval. Next, according to their availability, archival maps from various sources—municipal services and Vélo Québec1bike path guidebooks—had to be employed in order to reconstruct the cycling network for each of the six years (1991, 1996, 2001, 2006, 2011 and 2016) corresponding to the Sta-tistics Canada census years. Whenever possible, two cartographical sources were used to validate the data on the cycling networks. For thesefive years, we listed seven types of infrastructures (Fig. 2). For analytical purposes, these infrastructures were grouped into three ca-tegories: cyclist-only bike paths, on-street bike lanes, and multi-use off-street paths (e.g. walking, roller-blading, and skateboarding). For ex-ample, in 2016, cyclist-only bike paths represented 63% of the network studied, on-street bike lanes, 26%, and multi-use off-street paths, 11%. In order to take into account the continuity of the cycling network beyond street intersections and to reduce calculation errors in mea-suring connectivity, the ends of the sections of bike path were extended by 12 m, which corresponds to the average width of Montreal-area in-tersections (Morency et al., 2013), as done bySchoner and Levinson (2014). The road network used in the GIS is that of Adresses Québec (AQ Directions) (Gouvernement du Québec, 2015).
Fig. 1. Study area.
1Vélo Québec is a key non-profit organization and the main Quebec cyclists' pressure
3.3. Qualifying the network and its accessibility
3.3.1. Measuring expansion and density
In order to characterize the development of the cycling network –our first research objective–, its expansion was calculated for each area (Montreal, Laval, and Longueuil) and for each study year. This expan-sion was calculated based on the linear extenexpan-sion of the cycling network measured in kilometres. As had been done by several other authors (Dill, 2004;Flanagan et al., 2016;Tressider, 2005), two density indices were calculated: the length of the cycling network per km2of surface
area for the three areas studied; and the length of the cycling network divided by the length of the road network, expressed as a percentage, excluding roads where bicycling is forbidden (highways, highway ac-cess roads, restricted-acac-cess bridges).
3.3.2. Measuring connectivity
The connectivity of the cycling network was measured for each
area. Connectivity is an important measurement: a highly connected network allows users to reduce their travel distances and gives them several choices of routes, depending on their preferences (Dill, 2004; Lowry and Loh, 2017; Marqués et al., 2015; Schoner and Levinson, 2014;Titze et al., 2008). Trips are more effective when a network has a high level of connectivity, as it allows a vast range of different routes to connect the various destinations in the same territory. Several widely-used connectivity measures (Chen et al., 2014;Chin et al., 2008;Dill, 2004;Lowry et al., 2016;Lowry and Loh, 2017;Tressider, 2005) were calculated: the beta index, the gamma index, the connected nodes ratio, and the intersection density.
The beta index (β) is used to characterize the complexity of the network (Derrible and Kennedy, 2010) and represents the relationship between the number of links (e) and the number of nodes (v):
= β e v/
where a perfect grid would have a theoretical value of 2.5 (Bejleri et al., Fig. 2. Types of bicycle paths and bike lanes.
2010; Tressider, 2005). This measure is moreover frequently used in studies on active transportation; some authors also call it the“link node ratio” (Chin et al., 2008;Dill, 2004;Tal and Handy, 2012; Tressider, 2005).
The gamma index (Y) is used to measure the degree of connectivity, that is, the number of links existing in the network in relation to the theoretical number of maximum possible links (Chen et al., 2014; Derrible and Kennedy, 2010;Tressider, 2005):
Ү =e/3 (v−2)
with values ranging from 0 to 1, that is, from a low to a high degree of connectivity.
The connected nodes ratio (CNR) is the number of intersections (i) divided by the total number of nodes (v) in the network:
= CNR i/v
where a perfect grid would obtain a result of 1 (Dill, 2004;Tressider, 2005).
Finally, the intersection density (Dj) is the number of intersections per km2for each study area (Aj):
= Dj i A/ j
where the higher the value is, the greater is the connectivity (Dill, 2004).
3.3.3. Evaluating the quality of the network in relation to the typology One can also evaluate the quality of the cycling network in con-sidering its typology (Winters and Teschke, 2010). For example, the growth in the number of kilometres of infrastructures can be calculated for the three previously mentioned categories of infrastructures.
3.3.4. Measuring the accessibility of the cycling network
In order to measure the accessibility of the cycling network, in connection with our second research objective, the proximity of bike paths was used to measure the accessibility of the cycling network. The measures of accessibility were calculated using the Network Analyst extension in ArcMap 10.5. Urban cycling networks are permeable. Unlike highway networks or subway networks (Chen et al., 2014; Derrible and Kennedy, 2010), they do not have well-defined access points. Access points were therefore created at each street intersection crossing the cycling network. Two measures of accessibility were used: network distance to the nearest section of the cycling network, and the distance to the nearest cyclist-only bike path from the centroid of the different census tracts (Apparicio et al., 2008;Apparicio et al., 2007; Handy and Niemeier, 1997;Talen and Anselin, 1998).
3.4. Classical and logistic regression
Once the two measures of accessibility had been calculated on the level of census tracts, several regression models were conducted for the six years (1991, 1996, 2001, 2006, 2011 and 2016). They allow one to determine whether, because of its extension, the accessibility of the cycling network has improved or deteriorated over time for the popu-lation groups studied. It should be noted that there were not the same number of census tracts every year. It was consequently not possible to apply panel regression.
Two types of regression were conducted: a classical regression (OLS) and a logistic regression. For the classical regression, the dependent variables were the network distance to the nearest section of the cycling network and the distance to the nearest cyclist-only bicycle path from the centroid of the census tract. For the logistic regression, the depen-dent variables were the access to the cycling network within a metre radius and the access to a cyclist-only bike path within a 500-metre radius from the centroid of the census tract. It is true that access may vary by group and a lower threshold could have been appropriate. However, with an average speed of 15 km/h (Jensen et al., 2010;
Thompson et al., 1997), an urban cyclist takes around 2 min to ride 500 m. For pedestrian, accessibility is often measure with a 400 m ra-dius (Achuthan et al., 2010;Iacono et al., 2008;Vale et al., 2015). In that respect, 500 m was considered as a minimal distance for bicycle commuting.
Based on the literature in thefields of environmental equity (Carrier et al., 2016;Day, 2010;Mulholland, 2008;Pham et al., 2012;Rigolon, 2017;Talen and Anselin, 1998;Yuan et al., 2017) and transportation (Ekman et al., 2001; Fernández-Heredia et al., 2014; Pucher and Buehler, 2009;Smart, 2010), the following independent variables were introduced into the models: the percentages of children aged 5 to 14, of seniors aged 65 and over, of people in low-income households, and of recent immigrants.
In the models, several control variables were used: dummy variables for the areas (with Montreal as the reference category) and Euclidean distance between the census tracts and respective downtown of each study area, since, according to the literature, there is a strong correla-tion between the distance to the downtown and the presence of cycling paths (Flanagan et al., 2016;Pucher et al., 2011). The intermodal metro stations Berri-UQAM, Longueuil and Montmorency were used as downtowns for each of the areas studied, that is, Montreal, Longueuil and Laval, respectively.
4. Results
4.1. Major expansion of the cycling network from 1991 to 2011
Fig. 3illustrates the expansion of the cycling network from 1991 to 2016 over the entire territory. A growth rate of 162% is seen for the period studied. In the three areas under study, the density of the cycling network also showed a constant increase (Table 1). Nevertheless, in 2016, the cycling network only represented 13.3% of all potentially cyclable streets in the study area. This proportion, like the density of the kilometres of cycling network per km2, did however double during
the period. The area studied with the most marked expansion is the city of Laval, which has almost seen a four-fold increase of its network (3.91) in 25 years. In Montreal, Laval and Longueuil, the length of the cycling network increased from 270 km to 732 km, from 50 km to 196 km, and from 174 km to 368 km respectively during the period studied.
4.2. Little increase in connectivity
The results of the various measures of connectivity, which is an important aspect of the quality of a cycling network (Dill, 2004;Lowry and Loh, 2017; Marqués et al., 2015; Oswald Beiler et al., 2017; Schoner and Levinson, 2014;Titze et al., 2008), show very little im-provement in the network (Table 2). The connected nodes ratio for all of the study area only rose from 0.47 to 0.60 for the entire period. As for the beta index used to measure the complexity of the network, it only increased from 0.99 to 1.21 out of a maximum of 2.5, which indicates a poor improvement. Montreal and Laval nonetheless saw their re-spective networks become more complex than Longueuil did. The gamma index used to measure the degree of connectivity also grew very little, from 0.33 to 0.40 (out of 1) for the entire study area, as was the case in each urban area. It should however be noted that the intersec-tion density rose from 0.37 of an intersecintersec-tion per km2in 1991 to 1.41
intersections per km2in 2016 which indicates a major gain. A portion of these results may perhaps be due to the efforts made by the cities of Montreal, Laval and Longueuil, which have been working for the past few years to improve network connectivity in order to link the various centres of activity, and to increase the possibilities of trips between the different destinations as well as the fluidity of the network.
4.3. Improvement in the quality of the cycling network according to the typology
The cycling network in the region is made up of various types of bike paths (cyclist-only bike paths, on-street bike lanes, and multi-use off-street paths). A number of studies have shown that users prefer cyclist-only bike paths (Broach et al., 2012;Lusk et al., 2011;Sahlqvist et al., 2015;Tilahun et al., 2007;Winters and Teschke, 2010). For all study areas, a major growth in cyclist-only bike paths is seen (Fig. 4). So, in taking the typology into account, wefind a constant increase in the quality of infrastructures, especially in terms of safety (Bagloee et al., 2016;Broach et al., 2012;Lusk et al., 2011). It is interesting to observe that, for the city of Laval, there has been a phenomenon of transformation of on-street bike lanes into cyclist-only bike paths. It is only in Montreal that we stillfind a large increase in on-street bike lanes. In the last few years, some boroughs and the central city con-siderably developed the network in using that type of infrastructure,
which represented more than the half of the network in 2016. As for multi-use infrastructures, they remain a minority in the three areas studied.
4.4. Effect of cycle network expansion on equity in accessibility
The second objective of this study is to determine whether the ex-tension of the cycling network reduced or reinforced inequities in ac-cessibility for the four groups studied. To determine this, we calculated various models.
4.4.1. Distance to the nearest section of the cycling network: OLS regression For the model where the dependent variable is the distance to the nearest section of cycling network (Table 3), the control variable, that is, the distance to the downtowns, is only not significant (p > 0.05) in 1991 and 2011. The dummy variables representing the study areas reflect what we found in our characterization of the network. Compared Fig. 3. Greater Montreal cycling network expansion– 1991 to 2016.
Table 1
Expansion and density of the cycling network. Year Areas Total length
(km)
Network per km2
Percentage of cycling network out of all roads
1991 Montreal 270 0.54 4.8 Laval 50 0.20 2.8 Longueuil 174 0.62 7.7 All 495 0.48 5.1 1996 Montreal 323 0.65 5.7 Laval 55 0.22 3.1 Longueuil 206 0.73 9.1 All 584 0.57 6.0 2001 Montreal 348 0.70 6.2 Laval 107 0.43 6.0 Longueuil 251 0.88 11.1 All 705 0.68 7.3 2006 Montreal 391 0.78 6.9 Laval 153 0.62 8.5 Longueuil 276 0.97 12.2 All 819 0.80 8.4 2011 Montreal 546 1.09 9.7 Laval 178 0.72 9.9 Longueuil 315 1.11 13.9 All 1039 1.01 10.7 2016 Montreal 732 1.46 13.0 Laval 196 0.80 10.9 Longueuil 368 1.30 16.2 All 1296 1.26 13.3 Table 2
Connectivity of the cycling network. Year Areas Connected nodes
ratio Beta index Gamma index Intersection density 1991 Montreal 0.46 1.00 0.34 0.35 Laval 0.31 0.83 0.28 0.09 Longueuil 0.52 1.02 0.34 0.67 All 0.47 0.99 0.33 0.37 1996 Montreal 0.49 1.09 0.36 0.48 Laval 0.30 0.88 0.30 0.11 Longueuil 0.55 1.05 0.35 0.80 All 0.50 1.05 0.35 0.48 2001 Montreal 0.57 1.16 0.39 0.73 Laval 0.35 0.87 0.29 0.24 Longueuil 0.57 1.10 0.37 1.17 All 0.54 1.10 0.37 0.73 2006 Montreal 0.53 1.12 0.37 0.67 Laval 0.43 0.97 0.33 0.40 Longueuil 0.56 1.09 0.36 1.21 All 0.52 1.08 0.36 0.76 2011 Montreal 0.61 1.18 0.39 1.16 Laval 0.45 1.00 0.34 0.58 Longueuil 0.55 1.08 0.36 1.64 All 0.56 1.11 0.37 1.15 2016 Montreal 0.64 1.31 0.44 1.62 Laval 0.44 1.01 0.34 0.54 Longueuil 0.59 1.13 0.38 1.79 All 0.60 1.21 0.40 1.41
with the Montreal urban area, accessibility was lower in Laval in 1991, 1996 and 2016 (significant and positive coefficients), whereas it was greater than in Montreal in 2006 (significant and negative coefficients). For Longueuil, the accessibility was still greater there than in Montreal until 2006. However, the coefficients had decrease from 1991 to 2006,
withfluctuations during the period, and end up being not significant in 2011 and 2016. Until 2011, the independent variables for the four groups are all significant at a threshold of 5%, except for the percentage of low-income people in 2011 (Table 3). In 2016, only the percentages of children aged 5 to 14 and 65 years old and over are significant. The Fig. 4. Expansion according to the typology of the cycling network.
Table 3
OLS regression: distance to the nearest section of the cycling network.
Year 1991 1996 2001
Coef. T Pr Coef. T Pr Coef. T Pr
Intercept 317.40 1.27 0.203 417.93 1.78 0.075 −12.02 −0.06 0.950
Distance to downtown −19.08 −1.83 0.068 −21.05 −2.14 0.033 −18.23 −2.23 0.026
Montreal Ref. Ref. Ref.
Laval 355.11 2.30 0.022 341.65 2.36 0.019 −228.26 −1.79 0.073
Longueuil −382.11 −2.56 0.011 −287.74 −2.08 0.038 −298.93 −2.62 0.009
Low-income pop. (%) −18.34 −4.89 0.000 −19.14 −5.93 0.000 −15.55 −4.91 0.000
Recent immigrants (%) 79.30 7.00 0.000 64.40 8.02 0.000 76.30 8.58 0.000
5–14 years old (%) 86.05 5.17 0.000 82.88 5.55 0.000 80.21 6.36 0.000
65 years old and over (%) 22.55 3.39 0.001 17.27 2.84 0.005 26.99 5.27 0.000
N 629 630 658
R2 0.169 0.188 0.175
Pseudo R2 0.160 0.179 0.166
AIC 10,429 10,389 10,722
Year 2006 2011 2016
Coef. T Pr Coef. T Pr Coef. T Pr
Intercept −65.46 −0.35 0.726 31.05 0.27 0.784 −131.80 −1.27 0.206
Distance to downtown −16.19 −2.12 0.035 1.04 0.22 0.830 0.02 4.13 0.000
Montreal Ref. Ref. Ref.
Laval −295.26 −2.50 0.013 −38.27 −0.50 0.618 140.80 2.49 0.013
Longueuil −277.51 −2.64 0.008 −121.26 −1.78 0.076 21.51 0.42 0.674
Low-income pop. (%) −14.40 −4.19 0.000 −3.32 −1.25 0.212 1.19 0.43 0.666
Recent immigrants (%) 65.96 8.32 0.000 14.90 2.80 0.005 7.84 1.63 0.103
5–14 years old (%) 74.95 6.21 0.000 42.41 5.48 0.000 20.42 3.26 0.001
65 years old and over (%) 21.04 4.44 0.000 8.01 2.68 0.008 6.67 2.95 0.003
N 661 685 692
R2 0.174 0.091 0.113
Pseudo R2 0.165 0.082 0.104
percentage of children aged 5 to 14 is the independent variable with the most influence on the distance to the nearest cycling network. The more the percentage of children increases, the greater is the distance to the cycling network. For example, in 1991, for each additional percentage point of children per census tract, the distance to the cycling network increases by 86 m, all other things being equal (B = 86.05, p = 0.000). This indicates that children are in a situation of inequity. The same finding applies for recent immigrants and older people, though with lower coefficients for the latter. Conversely, the percentage of low-in-come individuals is negatively correlated with the distance to the cy-cling network from 1991 to 2006, which indicates a favourable situa-tion for this group. It should be noted that the R2values are relatively
stable from 1991 to 2006, and then strongly decline in 2011. This in-dicates a decrease in the inequities at the end of the period.
For the model where the dependent variable is the distance to the nearest cyclist-only bike path, all the independent variables are sig-nificant except for the distance to the downtowns (1991–2011), the dummy variable for Longueuil in 2006, and the percentage of low-in-come population in 2016 (Table 4). As with the previous model, it is low-income people who benefit from better accessibility (negative and significant coefficients). For recent immigrants and seniors, we see a reduction in their low accessibility. Despite a decrease in their poor accessibility at the start of the 2000s, it is children that had the least access to a cyclist-only bike path network over all the period. The R2
declines throughout the period studied, except in 1996, which indicates an overall decrease in inequities.
Thanks to the standardized coefficients inFig. 5, it is easy to com-pare the importance of each of the independent variables during the period for the two regression models: a positive standardized coefficient indicates a situation of inequity, and a negative coefficient indicates an advantageous situation, whereas a coefficient close to zero expresses
that there are no inequities. If we look at the left part ofFig. 5.a, we can advance several interesting observations as to the accessibility of the cycling network. First, wefind a reduction in inequities for older people and recent immigrants, but withfluctuations between 1991 and 2016. Secondly, low-income populations that enjoyed an advantageous si-tuation in 1991 saw this tendency decrease starting in 1996, with a standardized coefficient close to 0 from 2011. Thirdly, the curve for children remained relatively stable from 1991 to 2011, which shows that the situation of inequity of the latter had barely improved in 20 years. However, the standardized coefficient suggest an improve-ment in thefive last years.
As for the curves in the second model (Fig. 5b), concerning cyclist-only bike paths, they are similar to those in thefirst model in terms of the accessibility for seniors and low-income populations. It is inter-esting to observe the parabolic form representing children's accessi-bility. It seems to indicate that their accessibility increased up to 2001, and then subsequently deteriorated, except for 2016.
4.4.2. Accessibility to the cycling network within 500 m: logistic regressions With the help of this regression, it is a matter of determining whe-ther the probability of having access to the cycling network within a 500-metre radius for each of the four groups increased or decreased from 1991 to 2011 (Table 5andFig. 6a). We see that only low-income people had a greater probability of having access to the cycling network within a 500-metre radius, although this probability very slightly de-clined. Recent immigrants saw their probability of not having access to the network diminish over the years, but they still have more limited access, since the values of the odds ratios (OR) and the 95% confidence intervals of these ratios are still below 1 (ranging from 0.89 in 1991 to 0.94 in 2016). The situation is more of a concern for children (OR stable around 0.85), indicating that with each 1% increase in children aged 5 Table 4
OLS regression: the distance to the nearest cyclist-only path.
Year 1991 1996 2001
Coef. T Pr Coef. T Pr Coef. T Pr
Intercept 608.02 1.91 0.056 691.58 2.04 0.042 289.68 1.25 0.213
Distance to downtown −20.54 −1.54 0.123 −0.94 −0.07 0.947 6.38 0.64 0.521
Montreal Ref. Ref. Ref.
Laval 808.82 4.11 0.000 1076.67 5.13 0.000 389.88 2.52 0.012
Longueuil −489.04 −2.57 0.010 −572.28 −2.85 0.005 −319.32 −2.30 0.022
Low-income pop. (%) −26.46 −5.54 0.000 −22.09 −4.72 0.000 −14.85 −3.86 0.000
Recent immigrants (%) 103.58 7.17 0.000 81.93 7.04 0.000 87.23 8.08 0.000
5–14 years old (%) 104.26 4.91 0.000 96.81 4.48 0.000 56.17 3.67 0.000
65 years old and over (%) 37.88 4.47 0.000 21.92 2.49 0.013 30.61 4.92 0.000
N 629 630 658
R2 0.210 0.213 0.170
Pseudo R2 0.201 0.204 0.161
AIC 10,734 10,857 10,977
Year 2006 2011 2016
Coef. T Pr Coef. T Pr Coef. T Pr
Intercept −49.13 −0.23 0.816 119.98 0.85 0.396 21.67 0.13 0.897
Distance to downtown 10.77 1.24 0.215 1.64 0.27 0.786 0.02 2.92 0.004
Montreal Ref. Ref. Ref.
Laval 306.96 2.30 0.022 −353.67 −3.69 0.000 −220.30 −2.42 0.016
Longueuil −59.08 −0.50 0.619 −376.87 −4.42 0.000 −364.70 −4.43 0.000
Low-income pop. (%) −11.62 −2.99 0.003 −8.81 −2.65 0.008 −2.09 −0.47 0.638
Recent immigrants (%) 64.77 7.21 0.000 32.14 4.83 0.000 26.92 3.48 0.001
5–14 years old (%) 59.88 4.38 0.000 60.17 6.22 0.000 41.19 4.08 0.000
65 years old and over (%) 17.52 3.26 0.001 12.69 3.40 0.001 8.88 2.43 0.015
N 661 685 692
R2 0.155 0.162 0.142
Pseudo R2 0.145 0.153 0.133
to 14 in a census tract, the probability of benefiting from a bike path within a 500-metre radius fell by 13 to 16%.
As for the logistic model, where the dependent variable is access to a cyclist-only bike path within a 500-metre radius (Table 6andFig. 6b). The percentage of children was negatively significant from 2006 to 2016. This model shows that recent immigrants saw their probability of not having access to a cyclist-only bicycle path within a 500-metre radius decline until 2011, but that they were still in a situation of in-equity even though this inin-equity was low (OR = 0.947, OR
95% = 0.906–0.989).
The graphic representation of the odds ratios inFig. 6shows ten-dencies similar to the OLS models throughout the period: a reduction in inequities for recent immigrants, a stability in the inequities for chil-dren, and a slight decrease in the advantages for low-income people. It should however be noted that, inFig. 6b, many odds ratios are not significant.
Fig. 5. Standardized coefficients for the OLS regression models.
Table 5
Logistic regression: access to the cycling network within 500 m.
Year 1991 1996 2001
Coef. ORa OR 95%b Coef. ORa OR 95%b Coef. ORa OR 95%b
Intercept −0.370 0.691 0.220 2.152 0.337 1.400 0.475 4.173 1.216 3.374 1.277 9.126
Distance to downtown 0.042 1.043 0.991 1.098 0.054 1.055 1.006 1.109 0.043 1.044 1.001 1.091
Montreal Ref. Ref. Ref.
Laval 0.227 1.254 0.580 2.645 −0.016 0.984 0.471 2.007 0.516 1.676 0.878 3.196
Longueuil 1.227 3.411 1.741 6.758 1.004 2.728 1.443 5.213 0.776 2.172 1.233 3.855
Low-income pop. (%) 0.037 1.038 1.020 1.057 0.027 1.028 1.012 1.044 0.020 1.020 1.004 1.037
Recent immigrants (%) −0.121 0.886 0.833 0.938 −0.072 0.931 0.893 0.968 −0.091 0.913 0.867 0.958
5–14 years old (%) −0.136 0.873 0.805 0.944 −0.174 0.840 0.779 0.904 −0.170 0.843 0.786 0.902
65 years old and over (%) −0.006 0.994 0.965 1.025 −0.015 0.986 0.959 1.013 −0.035 0.965 0.940 0.990
N 629 630 658
Cox and Snell R2 0.086 0.083 0.070
Nagelkerke R2 0.120 0.114 0.095
AIC 758 792 850
Year 2006 2011 2016
Coef. ORa OR 95%b Coef. ORa OR 95%b Coef. ORa OR 95%b
Intercept 1.143 3.138 1.174 8.526 1.977 7.224 2.933 18.252 3.819 45.572 11.273 191.448
Distance to downtown 0.038 1.039 0.997 1.084 0.005 1.005 0.969 1.044 0.000 1.000 1.000 1.000
Montreal Ref. Ref. Ref.
Laval 0.746 2.110 1.133 3.964 0.220 1.246 0.697 2.245 −0.506 0.603 0.335 1.087
Longueuil 0.823 2.278 1.312 3.997 0.730 2.075 1.208 3.641 0.080 1.084 0.620 1.930
Low-income pop. (%) 0.029 1.029 1.010 1.049 0.019 1.019 0.998 1.041 0.028 1.028 0.993 1.068
Recent immigrants (%) −0.087 0.917 0.876 0.958 −0.042 0.959 0.919 1.000 −0.062 0.939 0.887 0.993
5–14 years old (%) −0.156 0.855 0.799 0.914 −0.153 0.858 0.806 0.913 −0.160 0.852 0.788 0.921
65 years old and over (%) −0.035 0.966 0.942 0.990 −0.030 0.971 0.948 0.993 −0.043 0.958 0.933 0.984
N 661 685 692
Cox and Snell R2 0.077 0.077 0.123
Nagelkerke R2 0.104 0.103 0.177
AIC 872 889 753
aOdds ratio.
5. Discussion
Contrary to what studies conducted elsewhere in the world have suggested (Lusk et al., 2017;Tucker and Manaugh, 2017), low-income people have good access to the cycling network in our study area. In the Montreal area, some of the oldest cycling paths were developed in disadvantaged neighbourhoods where space was available for this after transformation of the area in connection with industrial decline. In other cases, the bike paths resulted from demands by pro-cycling pressure groups. For example, the first bicycle path created on the territory of the Island of Montreal was the Lachine Canal linear park bike path, in a former industrial area where the nearby neighbourhoods had long housed impoverished, working class populations. As well, in the 1970s, the militant group le Monde à bicyclette spoke out strongly for the rights of cyclists in urban settings. The group pushed for the de-velopment of a major north-south cycling route. The group was com-prised of young cyclists and militants based in the central neighbour-hoods of Milton Park, Mile End and Plateau Mont-Royal, all neighbourhoods where one could then find inexpensive apartments (Morissette, 1994;Ross, 2015).
Over the period studied, we see increasingly-declining positive as-sociations between the percentage of low-income people and the proximity of bike paths. We can offer two hypotheses to explain this. First, it can be said that the expansion of the cycling network reached, over time, areas with populations with more diversified income levels. Secondly, we can say, as other authors have observed in the United States (Flanagan et al., 2016;Stehlin, 2015; Stein, 2011), that many disadvantaged sectors with access to the cycling network became more gentrified over the years.
Another important element is that the expansion of the cycling network has improved access to this network for recent immigrants. However, as with other groups, it is difficult to conclude whether or not this expansion allows them to reach their chosen destinations (job sites, shopping destinations, etc.).
Of all the results, the inequity affecting children is the most sur-prising. Since 1991, children have never benefited from good access to the cycling network, despite the advantages that this type of infra-structure offers, especially in the area of safety. Nevertheless, in 2015, children represented one quarter of all Québec cyclists, and two utility cyclists out of three were children (Vélo Québec, 2016). What is as-tounding is that the expansion of the cycling network over the study area had no influence on its accessibility for children. On the one hand, this may be explained by the form that the extension of the network took, as it was largely developed over the years in central neighbour-hoods in Montreal and in neighbourneighbour-hoods with low proportions of children in Laval and Longueuil (Flanagan et al., 2016;Pucher et al., 2011).
On the other hand, due to the population aging affecting the entire territory, from 1991 to 2011, the proportion of the population under 15 years of age fell from 20% to 15% in the city of Laval and in the Longueuil urban area, whereas, during the same period, the proportion of the population aged 65 and over rose from about 9% to 15% (CMM, 2012). This phenomenon was also experienced in the Montreal urban area, but with much smaller variations. This population aging could also explain why the accessibility of the cycling network improved for seniors starting in 2001 (Fig. 6).
Since access to property ownership is becoming increasingly ex-pensive in the entire metropolitan area, we can hypothesize that fa-milies are moving ever further outside the study area or into new neighbourhoods where it was not considered appropriate to set up a cycling network. Moreover, suburban streets may be deemed safe en-ough for cycling by local authorities, as is often assumed, but as men-tioned byAldred (2015),“the combination of through motor traffic and parked cars restricting visibility and manoeuvring may prove hostile for children, in residential streets”. We can also suppose that it is a question of an issue of procedural equity. Children rarely have input into city planning, even though they make up the segment of the population with the highest level of cyclists: that is, nearly 90% (Vélo Québec, Fig. 6. Odds ratios for the logistic regression models.
2016). This level falls with the onset of adulthood and continues to decline over the years (Vélo Québec, 2016). It should be remembered that the modal share of cycling is currently only 2.5%, and that this share only rises very little from year to year. In a context of combating climate change, all efforts that foster an increase in this modal share will have beneficial effects on everyone's quality of life. Improving the accessibility of the cycling network favours use of the bicycle by young people (Emond and Handy, 2012; Kaplan et al., 2016), which en-courages the continuation of the practice of cycling after childhood (Emond et al., 2009;Fernández-Heredia et al., 2014).
6. Conclusion
In conclusion, our longitudinal approach has enabled us to observe that the cycling network has more than doubled in size during the period under study. However, in looking at the spreading of the net-work over the study area, we see that certain areas are still very poorly served, and that they would benefit from better connectivity. In terms of accessibility, low-income individuals have generally had a good de-gree of accessibility, but one that slightly declined toward the end of the period. For their part, recent immigrants have seen their accessibility improve, so that in 2016, we can no longer point to any flagrant in-equity. The most important result is clearly that there has been little or no improvement for children, who remain in a situation of inequity. The literature shows that children's safety, mobility and health could benefit from better access to the cycling network (Emond and Handy, 2012;Fitch et al., 2016;Kaplan et al., 2016;McDonald et al., 2016). Various levels of government are spending large sums of money to encourage physical activity among children in order to combat se-dentarity. One sustainable contribution could be to give them access to
a high-quality cycling network. It is all the more important to target children, as we also know that child cyclists have greater chances to understand the benefits associated with bicycling once adult (Aldred et al., 2016;Fernández-Heredia et al., 2014;Kaplan et al., 2016).
Acknowledgments
The authors would like to thank the three anonymous reviewers for their careful reading of our manuscript and their many insightful comments and suggestions. The authors are also grateful for the fi-nancial support provided by the Canada Research Chair in Environmental Equity (950-230813) and SSHRC (435-2014-1999) for theirfinancial support.
References
Achuthan, K., Titheridge, H., Mackett, R.L., 2010. Mapping accessibility differences for the whole journey and for socially excluded groups of people. J. Maps 220–229. Aldred, R., 2012. Governing transport from welfare state to hollow state: the case of
cycling in the UK. Transp. Policy 23, 95–102.
Aldred, R., 2015. Adults' attitudes towards child cycling: a study of the impact of infra-structure. Eur. J. Transp. Infrastruct. Res. 15, 92–115.
Aldred, R., Elliott, B., Woodcock, J., Goodman, A., 2017. Cycling provision separated from motor traffic: a systematic review exploring whether stated preferences vary by gender and age. Transp. Rev. 37, 29–55.
Aldred, R., Woodcock, J., Goodman, A., 2016. Does more cycling mean more diversity in cycling? Transp. Rev. 36, 28–44.
Apparicio, P., Abdelmajid, M., Riva, M., Shearmur, R., 2008. Comparing alternative ap-proaches to measuring the geographical accessibility of urban health services: dis-tance types and aggregation-error issues. Int. J. Health Geogr. 7.
Apparicio, P., Carrier, M., Gelb, J., Séguin, A.-M., Kingham, S., 2016. Cyclists' exposure to air pollution and road traffic noise in central city neighbourhoods of Montreal. J. Transp. Geogr. 57, 63–69.
Apparicio, P., Cloutier, M.S., Shearmur, R., 2007. The case of Montréal's missing food Table 6
Logistic regression: access to an exclusive bike path within 500 m.
Year 1991 1996 2001
Coef. ORa OR 95%b Coef. ORa OR 95%b Coef. ORa OR 95%b
Intercept −2.416 0.089 0.021 0.363 −1.863 0.155 0.039 0.598 −1.212 0.298 0.094 0.928
Distance to downtown 0.026 1.027 0.966 1.089 0.020 1.020 0.963 1.080 0.036 1.037 0.986 1.089
Montreal Ref. Ref. Ref.
Laval −0.595 0.552 0.169 1.525 −1.381 0.251 0.056 0.790 −0.553 0.575 0.213 1.387
Longueuil 0.441 1.554 0.674 3.463 0.591 1.806 0.855 3.737 0.562 1.753 0.910 3.329
Low-income pop. (%) 0.031 1.032 1.010 1.055 0.016 1.016 0.998 1.035 0.018 1.019 0.999 1.038
Recent immigrants (%) −0.124 0.883 0.810 0.952 −0.056 0.945 0.895 0.993 −0.063 0.939 0.884 0.993
5–14 years old (%) −0.011 0.989 0.898 1.089 −0.019 0.981 0.898 1.070 −0.051 0.950 0.879 1.026
65 years old and over (%) 0.013 1.013 0.976 1.050 0.003 1.003 0.968 1.038 −0.017 0.984 0.952 1.014
N 629 630 658
Cox and Snell R2 0.035 0.030 0.023
Nagelkerke R2 0.060 0.051 0.037
AIC 548 564 649
Year 2006 2011 2016
Coef. ORa OR 95%b Coef. ORa OR 95%b Coef. ORa OR 95%b
Intercept 1.006 2.736 0.994 7.689 1.002 2.725 1.131 6.692 0.935 2.548 0.886 7.496
Distance to downtown −0.001 0.999 0.956 1.044 0.005 1.005 0.965 1.046 0.000 1.000 1.000 1.000
Montreal Ref. Ref. Ref.
Laval −0.318 0.727 0.359 1.431 0.888 2.429 1.337 4.452 0.828 2.288 1.292 4.073
Longueuil −0.015 0.985 0.547 1.750 1.236 3.441 2.018 5.964 1.211 3.358 2.000 5.713
Low-income pop. (%) 0.019 1.019 1.000 1.039 0.020 1.020 0.999 1.042 0.020 1.020 0.991 1.050
Recent immigrants (%) −0.089 0.915 0.872 0.958 −0.055 0.947 0.906 0.989 −0.042 0.959 0.911 1.009
5–14 years old (%) −0.126 0.882 0.822 0.944 −0.158 0.854 0.800 0.909 −0.143 0.867 0.810 0.926
65 years old and over (%) −0.029 0.972 0.946 0.998 −0.015 0.985 0.963 1.009 0.000 1.000 0.977 1.023
N 661 685 692
Cox and Snell R2 0.067 0.099 0.103
Nagelkerke R2 0.093 0.132 0.138
AIC 807 880 887
aOdds ratio.
deserts: evaluation of accessibility to food supermarkets. Int. J. Health Geogr. 6. Bagloee, S.A., Sarvi, M., Wallace, M., 2016. Bicycle lane priority: promoting bicycle as a
green mode even in congested urban area. Transp. Res. A Policy Pract. 87, 102–121. Bejleri, I., Steiner, R.L., Fischman, A., Schmucker, J.M., 2010. Using GIS to analyze the
role of barriers and facilitators to walking in children's travel to school. Urban Des. Int. 16, 51–62.
Bergeron, U., 2014. Vélo, métro, boulot: combien ça coûte? LaPresse Affaire. Boyer, R., 2017. Recreational bicycling as a“gateway” to utility bicycling: the case of
Charlotte, NC. Int. J. Sustain. Transp. 1–9.
Broach, J., Dill, J., Gliebe, J., 2012. Where do cyclists ride? A route choice model de-veloped with revealed preference GPS data. Transp. Res. A Policy Pract. 46, 1730–1740.
Buehler, R., Dill, J., 2015. Bikeway networks: a review of effects on cycling. Transp. Rev. 36, 9–27.
Buekers, J., Dons, E., Elen, B., Int Panis, L., 2015. Health impact model for modal shift from car use to cycling or walking in Flanders: application to two bicycle highways. J. Transp. Health 2, 549–562.
Bulsink, V.E., Kiewiet, H., van de Belt, D., Bonnema, G.M., Koopman, B., 2016. Cycling strategies of young and older cyclists. Hum. Mov. Sci. 46, 184–195.
Carrier, M., Apparicio, P., Séguin, A.M., 2016. Road traffic noise in Montreal and en-vironmental equity: what is the situation for the most vulnerable population groups? J. Transp. Geogr. 51, 1–8.
Celis-Morales, C.A., Lyall, D.M., Welsh, P., Anderson, J., Steell, L., Guo, Y., Maldonado, R., Mackay, D.F., Pell, J.P., Sattar, N., Gill, J.M.R., 2017. Association between active commuting and incident cardiovascular disease, cancer, and mortality: prospective cohort study. BMJ 357, j1456.
Chen, S., Claramunt, C., Ray, C., 2014. A spatio-temporal modelling approach for the study of the connectivity and accessibility of the Guangzhou metropolitan network. J. Transp. Geogr. 36, 12–23.
Chin, G.K.W., Van Niel, K.P., Giles-Corti, B., Knuiman, M., 2008. Accessibility and con-nectivity in physical activity studies: the impact of missing pedestrian data. Prev. Med. 46, 41–45.
CMM, 2012. Sociodémographie - Perspective Grand Montréal - Le vieillissement de la population à la lumière du recensement 2011, Bulletin de la Communauté métropolitaine de Montréal. Communauté Métropolitaine de Montréal, pp. 8. Day, R., 2010. Environmental justice and older age: consideration of a qualitative
neighbourhood-based study. Environ Plan A 42, 2658–2673.
Derrible, S., Kennedy, C., 2010. Characterizing metro networks: state, form, and struc-ture. Transportation 37, 275–297.
Dill, J., 2004. Measuring network connectivity for bicycling and walking. In: 83rd Annual Meeting of the Transportation Research Board, Washington, DC, pp. 11–15. Dill, J., Carr, T., 2003. Bicycle commuting and facilities in major U.S. cities: if you build
them, commuters will use them. Transp. Res. Rec. 116–123.
Ekman, R., Welander, G., Svanstrom, L., Schelp, L., Santesson, P., 2001. Bicycle-related injuries among the elderly—a new epidemic? Public Health 115, 38–43. Emond, C.R., Handy, S.L., 2012. Factors associated with bicycling to high school: insights
from Davis, CA. J. Transp. Geogr. 20, 71–79.
Emond, C.R., Tang, W., Handy, S.L., 2009. Explaining gender difference in bicycling behavior. Transp. Res. Rec. 16–25.
Farrell, W., Weichenthal, S., Goldberg, M., Valois, M.F., Shekarrizfard, M., Hatzopoulou, M., 2016. Near roadway air pollution across a spatially extensive road and cycling network. Environ. Pollut. 212, 498–507.
Fernández-Heredia, Á., Jara-Díaz, S., Monzón, A., 2014. Modelling bicycle use intention: the role of perceptions. Transportation 43, 1–23.
Fishman, E., 2015. Cycling as transport. Transp. Rev. 36, 1–8.
Fishman, E., Schepers, P., Kamphuis, C.B., 2015. Dutch cycling: quantifying the health and related economic benefits. Am. J. Public Health 105, e13–15.
Fitch, D.T., Thigpen, C.G., Handy, S.L., 2016. Traffic stress and bicycling to elementary and junior high school: evidence from Davis, California. J. Transp. Health 3 (4), 457–466.
Flanagan, E., Lachapelle, U., El-Geneidy, A., 2016. Riding tandem: does cycling infra-structure investment mirror gentrification and privilege in Portland, Oregon, and Chicago, Illinois? In: Transportation Research Board 95th Annual Meeting. Fuller, D., Gauvin, L., Kestens, Y., Morency, P., Drouin, L., 2013. The potential modal shift
and health benefits of implementing a public bicycle share program in Montreal, Canada. Int. J. Behav. Nutr. Phys. Act. 10, 66–71.
Götschi, T., Garrard, J., Giles-Corti, B., 2015. Cycling as a part of daily life: a review of health perspectives. Transp. Rev. 36, 45–71.
Gouvernement du Québec, 2015. Adresses Québec: Guide de l'utilisateur. Ministère de l'Énergie et des Ressources naturelles. Direction de la cartographie topographique, Québec (Québec), pp. 60.
Grenier, T., Deckelbaum, D.L., Boulva, K., Drudi, L., Feyz, M., Rodrigue, N., Tze, N., Fata, P., Khwaja, K., Chughtai, T., Razek, T., 2013. A descriptive study of bicycle helmet use in Montreal, 2011. Can. J. Public Health 104, e400–e404.
Handy, S.L., Niemeier, D.A., 1997. Measuring accessibility: an exploration of issues and alternatives. Environ Plan A 29, 1175–1194.
de Hartog, J.J., Boogaard, H., Nijland, H., Hoek, G., 2010. Do the health benefits of cy-cling outweigh the risks? Environ. Health Perspect. 118, 1109–1116.
Hatzopoulou, M., Weichenthal, S., Dugum, H., Pickett, G., Miranda-Moreno, L., Kulka, R., Andersen, R., Goldberg, M., 2013. The impact of traffic volume, composition, and road geometry on personal air pollution exposures among cyclists in Montreal, Canada. J. Expo. Sci. Environ. Epidemiol. 23, 46–51.
Hoffmann, M.L., Lugo, A., 2014. Who is ‘world class’? Transportation justice and bicycle policy. Urbanities 4, 45–61.
Horton, D., 2006. Environmentalism and the bicycle. Environ. Polit. 15, 41–58. Iacono, M., Krizek, K., El-Geneidy, A.M., 2008. Access to destinations: how close is close
enough? Estimating accurate distance decay functions for multiple modes and dif-ferent purposes.
Jensen, P., Rouquier, J.-B., Ovtracht, N., Robardet, C., 2010. Characterizing the speed and paths of shared bicycle use in Lyon. Transp. Res. Part D: Transp. Environ. 15, 522–524.
Kaplan, S., Nielsen, T.A.S., Prato, C.G., 2016. Walking, cycling and the urban form: a Heckman selection model of active travel mode and distance by young adolescents. Transp. Res. Part D: Transp. Environ. 44, 55–65.
Lee, R.J., Sener, I.N., Jones, S.N., 2016. Understanding the role of equity in active transportation planning in the United States. Transp. Rev. 37, 211–226. Lowry, M.B., Furth, P., Hadden-Loh, T., 2016. Prioritizing new bicycle facilities to
im-prove low-stress network connectivity. Transp. Res. A Policy Pract. 86, 124–140. Lowry, M.B., Loh, T.H., 2017. Quantifying bicycle network connectivity. Prev. Med. 95
(Suppl S134–S140).
Lusk, A.C., Anastasio, A., Shaffer, N., Wu, J., Li, Y., 2017. Biking practices and preferences in a lower income, primarily minority neighborhood: learning what residents want. Prev. Med. Rep. 7, 232–238.
Lusk, A.C., Furth, P.G., Morency, P., Willett, W.C., Dennerlein, J.T., 2011. Risk of injury for bicycling on cycle tracks versus in the street. Inj. Prev. 17, 131–135. Macmillan, A., Connor, J., Witten, K., Kearns, R., Rees, D., Woodward, A., 2014. The
societal costs and benefits of commuter bicycling: simulating the effects of specific policies using system dynamics modeling. Environ. Health Perspect. 122, 335–344. Marqués, R., Hernández-Herrador, V., Calvo-Salazar, M., García-Cebrián, J.A., 2015. How
infrastructure can promote cycling in cities: lessons from Seville. Res. Transp. Econ. 53, 31–44.
McDonald, N.C., Steiner, R.L., Palmer, W.M., Bullock, A.N., Sisiopiku, V.P., Lytle, B.F., 2016. Costs of school transportation: quantifying thefiscal impacts of encouraging walking and bicycling for school travel. Transportation 43, 159–175.
Morency, P., Archambault, J., Cloutier, M.-S., Tremblay, M., Plante, C., Dubé, A.S., 2013. Sécurité des piétons en milieu urbain: enquête sur les aménagements routiers aux intersections. Agence de la santé et des services sociaux de Montréal, pp. 46. Morissette, C., 1994. Deux roues, un avenir: le vélo en ville., Montréal, Canada. Moudon, A.V., Lee, C., Cheadle, A.D., Collier, C.W., Johnson, D., Schmid, T.L., Weather,
R.D., 2005. Cycling and the built environment, a US perspective. Transp. Res. Part D: Transp. Environ. 10, 245–261.
Mulholland, E.K., 2008. Equity and child-survival strategies. Bull. World Health Organ. 86, 399–407.
Oswald Beiler, M., McGoff, R., McLaughlin, S., 2017. Trail network accessibility: ana-lyzing collector pathways to support pedestrian and cycling mobility. J. Urban Plann. Dev. 143, 04016024.
Pham, T.-T.-H., Apparicio, P., Séguin, A.-M., Landry, S., Gagnon, M., 2012. Spatial dis-tribution of vegetation in Montreal: an uneven disdis-tribution or environmental in-equity? Landsc. Urban Plan. 107, 214–224.
Pucher, J., Buehler, R., 2005. Cycling trends & policies in Canadian cities. World Transp. Policy Pract. 11, 43–61.
Pucher, J., Buehler, R., 2009. Cycling for a few or for everyone: the importance of social justice in cycling policy. World Transp. Policy Pract. 15.
Pucher, J., Buehler, R., Seinen, M., 2011. Bicycling renaissance in North America? An update and re-appraisal of cycling trends and policies. Transp. Res. A Policy Pract. 45, 451–475.
Pucher, J., Dijkstra, L., 2003. Promoting safe walking and cycling to improve public health: lessons from The Netherlands and Germany. Am. J. Public Health 93, 1509–1516.
Pucher, J., Dill, J., Handy, S., 2010. Infrastructure, programs, and policies to increase bicycling: an international review. Prev. Med. 50 (Suppl. 1), S106–125.
Reynolds, C.C., Harris, M.A., Teschke, K., Cripton, P.A., Winters, M., 2009. The impact of transportation infrastructure on bicycling injuries and crashes: a review of the lit-erature. Environ. Health 8, 47.
Rigolon, A., 2017. Parks and young people: an environmental justice study of park proximity, acreage, and quality in Denver, Colorado. Landsc. Urban Plan. 165, 73–83. Ross, D., 2015.“Vive la vélorution!”: Le Monde à bicyclette et les origines du mouvement
cycliste à Montréal, 1975–1980. Bull. d'histoire politique 23, 92–112.
Sahlqvist, S., Goodman, A., Jones, T., Powell, J., Song, Y., Ogilvie, D., iConnect, c., 2015. Mechanisms underpinning use of new walking and cycling infrastructure in different contexts: mixed-method analysis. Int. J. Behav. Nutr. Phys. Act. 12, 24.
Sakurai, R., Kawai, H., Yoshida, H., Fukaya, T., Suzuki, H., Kim, H., Hirano, H., Ihara, K., Obuchi, S., Fujiwara, Y., 2016. Can you ride a bicycle? The ability to ride a bicycle prevents reduced social function in older adults with mobility limitation. J. Epidemiol. 26, 307–314.
Schoner, J.E., Levinson, D.M., 2014. The missing link: bicycle infrastructure networks and ridership in 74 US cities. Transportation 41, 1187–1204.
Séguin, A.-M., Apparicio, P., 2013. Justice environnementale. Cah. Géogr. Québec 57, 211–214.
Smart, M.J., 2010. US immigrants and bicycling: two-wheeled in Autopia. Transp. Policy 17, 153–159.
Stehlin, J., 2015. Cycles of investment: bicycle infrastructure, gentrification, and the restructuring of the San Francisco Bay Area. Environ Plan A 47, 121–137. Stein, S., 2011. Bike Lanes and Gentrification: New York City's Shades of Green. Planners
Network. Accessed November 7, 2014.
Steinbach, R., Green, J., Datta, J., Edwards, P., 2011. Cycling and the city: a case study of how gendered, ethnic and class identities can shape healthy transport choices. Soc. Sci. Med. 72, 1123–1130.
Strauss, J., Miranda-Moreno, L.F., Morency, P., 2013. Cyclist activity and injury risk analysis at signalized intersections: a Bayesian modelling approach. Accid. Anal. Prev. 59, 9–17.
M.J., de Sa, T.H., Kelly, P., Woodcock, J., 2016. Can air pollution negate the health benefits of cycling and walking? Prev. Med. 87, 233–236.
Tal, G., Handy, S., 2012. Measuring nonmotorized accessibility and connectivity in a robust pedestrian network. Transp. Res. Rec. 48–56.
Talen, E., Anselin, L., 1998. Assessing spatial equity: an evaluation of measures of ac-cessibility to public playgrounds. Environ Plan A 30, 595–613.
Teschke, K., Harris, M.A., Reynolds, C.C., Winters, M., Babul, S., Chipman, M., Cusimano, M.D., Brubacher, J.R., Hunte, G., Friedman, S.M., Monro, M., Shen, H., Vernich, L., Cripton, P.A., 2012. Route infrastructure and the risk of injuries to bicyclists: a case-crossover study. Am. J. Public Health 102, 2336–2343.
Thompson, D.C., Rebolledo, V., Thompson, R.S., Kaufnan, A., Rivara, F.P., 1997. Bike speed measurements in a recreational population: validity of self reported speed. Inj. Prev. 3, 43–45.
Tilahun, N.Y., Levinson, D.M., Krizek, K.J., 2007. Trails, lanes, or traffic: valuing bicycle facilities with an adaptive stated preference survey. Transp. Res. A Policy Pract. 41, 287–301.
Titze, S., Stronegger, W.J., Janschitz, S., Oja, P., 2008. Association of built-environment, social-environment and personal factors with bicycling as a mode of transportation among Austrian city dwellers. Prev. Med. 47, 252–259.
Tressider, M., 2005. Using GIS to Measure Connectivity: An Exploration of Issues. School of Urban Studies and Planning. Portland Sate University (43 pages).
Tucker, B., Manaugh, K., 2017. Bicycle equity in Brazil: access to safe cycling routes across neighborhoods in Rio de Janeiro and Curitiba. Int. J. Sustain. Transp. 1–10. Vale, D.S., Saraiva, M., Pereira, M., 2015. Active accessibility: a review of operational
measures of walking and cycling accessibility. J. Transp. Land Use 9 (1), 209–235. Vélo Québec, 2016. État du vélo 2015. Bibliothèque et Archives nationales du Québec. Walker, G., 2009. Beyond distribution and proximity: exploring the multiple Spatialities
of environmental justice. Antipode 41, 614–636.
Winters, M., Teschke, K., 2010. Route preferences among adults in the near market for bicycling:findings of the cycling in cities study. Am. J. Health Promot. 25, 40–47. Woodcock, J., Tainio, M., Cheshire, J., O'Brien, O., Goodman, A., 2014. Health effects of
the London bicycle sharing system: health impact modelling study. BMJ 348, g425. Yuan, Y., Xu, J., Wang, Z., 2017. Spatial equity measure on urban ecological space layout
based on accessibility of socially vulnerable groups—a case study of Changting, China. Sustainability 9, 1552.
Zhao, C., Ma, H., Yang, L., Xiao, Y., 2017. Long-term bicycle riding ameliorates the de-pression of the patients undergoing hemodialysis by affecting the levels of inter-leukin-6 and interleukin-18. Neuropsychiatr. Dis. Treat. 13, 91–100.