In-situ co-doping of sputter-deposited TiO2:WN films for the development of photoanodes 1
intended for visible-light electro-photocatalytic degradation of emerging pollutants
2
N. Delegan,1 R. Pandiyan,1 S. Komtchou2, A. Dirany,2 P. Drogui,2 and M. A. El Khakani1,* 3
1Institut National de la Recherche Scientifique, Centre-Énergie, Matériaux et Télécommunications, 1650 4
Blvd. Lionel-Boulet, Varennes, QC J3X-1S2, Canada
5
2Institut National de la Recherche Scientifique, Centre-Eau, Terre et Environnement, 490 Rue de la 6
Couronne, QC G1K-9A9, Canada
7
*Corresponding author: elkhakani@emt.inrs.ca
8
9
Abstract
10
We report on the magnetron sputtering deposition of in-situ codoped TiO2:WN films intended for 11
electro-photocatalytic (EPC) applications under solar irradiation. By varying the RF-magnetron 12
sputtering deposition parameters, we were able to tune the in-situ incorporation of both N and W 13
dopants in the TiO2 films over a wide concentration range (i.e. 0-9at.% for N and 0-3at.% for W). 14
X-ray photoelectron spectroscopy analysis revealed that both dopants are mostly of a substitutional 15
nature. The analysis of the UV-Vis transmission spectra of the films confirmed that the optical band-16
gap of both TiO2:N and TiO2:WN films can be significantly narrowed (from 3.2eV for undoped-17
TiO2 down to ~2.3eV for the doped ones), by tuning their dopant concentrations. We were thus able 18
to pinpoint an optimal window for both dopants (N and W) where the TiO2:WN films exhibit the 19
narrowest bandgap. Moreover, the optimal codoping conditions greatly reduce the recombination 20
defect state density compared to the monodoped TiO2:N films. These electronically passivated 21
TiO2:WN films are shown to be highly effective for the EPC degradation of atrazine (pesticide 22
pollutant) under sunlight irradiation (93% atrazine degraded after only 30 min of EPC treatment). 23
Indeed, the optimally codoped TiO2:WN photoanodes were found to be more efficient than both the 24
undoped-TiO2 and equally-photosensitized TiO2:N photoanodes (by ~70% and ~25%, respectively), 25
under AM1.5 irradiation. 26
Introduction
1
Since the pioneering work of Fujishima and Honda in 1972 on titanium dioxide (TiO2) water 2
splitting1, the research on the photocatalytic properties of TiO
2 and its varied forms has continued 3
to attract great attention. In fact, TiO2 offers a unique combination of unpaired features among which 4
are its wide bandgap and high chemical stability1–5 in addition to its availability and affordability. 5
All these facts have made TiO2 the candidate of choice for applications in solar energy 6
conversion1,2,5 and photo-degradation of contaminants.6,7 7
Fundamentally, TiO2 is an n-type semiconductor with a wide intrinsic bandgap (Eg) of 3.0 eV and 8
3.2 eV for rutile and anatase polymorphs, respectively. This inherently restricts the photoactivity of 9
titania based devices to the ultra-violet (UV) range (which represents only ~4% of the irradiance of 10
the sunlight) and limits to a certain extent its implementation in large scale industrial photo-11
processes.8 It is thus understandable that substantial research effort is aimed at extending the 12
photosensitivity of TiO2 to the visible light range (which represents ~40% of solar irradiance) 13
through the narrowing of its bandgap via varied approaches including self-doping,9 dye-14
sensitization,2,4 cationic doping,4,7 and anionic doping.3,4,6,7 For the latter approach, substitutional 15
nitrogen (N) doping has been shown to be very effective, as it leads to the formation of discrete N2p 16
acceptor states within the Eg above the valence band maximum (VBM) reducing thereby the 17
bandgap energy from 3.2 eV (anatase) to ~2.3 eV (N-doped anatase).4,6,7 In this context, we have 18
demonstrated in a previous study7 that the in-situ N-doping induced Eg narrowing of sputtered TiO2 19
films was directly correlated with the significant increase of their electro-photocatalytic (EPC) 20
capacity to degrade the chlortetracycline (CTC) contaminant under sunlight exposure. In fact, N 21
doping is a more complex process which induces different energy states within the semiconductor’s 22
forbidden gap.10–17 Some of these energy levels act as acceptor states within the E
g and therefore 23
effectively reduce the energy required for photoexcitation, while others act as charge traps and/or 1
recombination centers hindering thereby the photocharge transport. Notably, the introduction of N 2
into the TiO2 lattice has been shown to lead to two types of these energy states associated with the 3
dopant being into substitutional or interstitial sites. The substitutional doping is associated with the 4
formation of N2p acceptor levels just above the O2p levels, whereas the interstitial one is related with
5
isolated N-O type deep gap states within the Eg that may act as photocharge recombination 6
centers.10–15 In addition, the defects induced by the presence of both dopants are usually 7
compensated for by the oxide structure via the formation of oxygen vacancies (VO), which in turn 8
act as potent recombination centers located beneath the conduction band minimum (CBM).14,16 In 9
sum, both experimental and theoretical studies10–17 indicate that mono-doping (with N for example) 10
while being very effective in narrowing the bandgap, it concomitantly creates recombination centers 11
that tend to reduce the extracted photogenerated current.4,7 This limits the full exploitation of the 12
photocatalytic efficiency gain from the absorption edge red-shift.5 To counteract this limitation, 13
density of states (DOS) models18–24 have showed that it is possible to minimise the undesired side-14
effects arising from N-doping by achieving an electronically passivated acceptor-donor co-doping 15
approach. The latter would suppress the charge defects acting as recombination centers, while 16
maintaining an enhanced visible light absorption.5,18–21,23,24 By theoretically investigating different 17
dopant couples,21,23 tungsten (W) and nitrogen (N) were identified as the most interesting pair that 18
would narrow the Eg while minimizing the recombination of photogenerated excitons through 19
electronic passivation of uncompensated charges.18–20,22 Recent chemical synthesis approaches have 20
attempted simultaneous W and N codoping (WN-codoping) of TiO2 leading to substantial band gap 21
narrowing.25–30 However, these studies showed mainly interstitial type of N-doping and the presence 22
of other contaminants such as amino groups and carbonaceous species (inherent to precursors used 23
in chemical methods). So far, the observed increase in EPC activity was mainly associated with the 24
effective bandgap reduction and surface area increase25,28,31 with almost no focus and/or 1
optimisation of the electronic passivation induced by the co-doping approach. This calls for a more 2
systematic experimental study of the structural, electronic, and chemical effects resulting from W 3
and N codoping of TiO2, over the largest dopant range accessible. The objective being to achieve 4
substitutional doping and identify the optimal doping concentrations leading to both narrowest 5
bandgap and a minimum of photocharges trapping and/or recombination (i.e. longer lifetimes of the 6
photogenerated charges). Practically, an effective co-doping of the TiO2:WN photoanodes will 7
translate into higher EPC photocurrent, which in turn will degrade more efficiently a given 8
contaminant in water. 9
In this paper, we report on the in-situ co-doping of TiO2 films by both W and N atoms by using a 10
reactive magnetron-sputtering process. By concomitantly adjusting the N2-to-Ar gas flow ratio and 11
the W-to-TiO2 target power ratio in the RF-sputtering plasma source, we were able to control the W 12
and N incorporation rates into the films, over the (0 - 3) at.% and (0 - 9) at.% concentration ranges, 13
respectively. The effects of both mono-doping (N and W taken separately), and WN-codoping 14
approaches on the structural, optical, and chemical properties of the sputtered TiO2 films have been 15
systematically investigated. By achieving detailed experimental analyses of the energy band 16
structure of the doped TiO2 films, we have recently demonstrated that optimal W and N doping 17
contents correspond not only to the narrowest Eg value of ~2.2 eV, but also to favorable Fermi level 18
(EF), CBM, and VBM band positions.32 In the present paper, the codoped TiO2:WN films are shown 19
to not only possess favorable optoelectronic properties but most interestingly to exhibit also densities 20
of oxygen vacancies and photocharge recombination centers lower than in their mono-doped 21
counterparts, confirming thereby the achievement of an electronically passivated acceptor-donor co-22
doping approach. To assess the practical advantages of such a co-doping approach, the optimised 23
TiO2:WN films were integrated into photo-anodes for the EPC degradation of atrazine (a pesticide, 24
and residual contaminant in water) under simulated AM1.5 solar light, and found to deliver superior 1
EPC performance their mono-doped photoanode counterparts. 2
3
Experimental
4
All the films were deposited from the sputtering of a TiO2 target by using an RF (13.56 MHz) 5
magnetron gun operating at a constant power density of 8.8 W/cm2. The in-situ N-doping of the 6
films was achieved through the introduction of N2 in conjunction with the Ar sputtering gas, whereas 7
W-doping was obtained through the co-sputtering of both TiO2 and W targets (3”-diam. and 99.99% 8
purity). For the WN-codoping, both N2 gas and W target co-sputtering were combined with the main 9
TiO2 target sputtering. Prior to deposition, the chamber was cryopumped to a base pressure of 2 × 10
10-8 Torr. Thereafter, high purity Ar (99.999 %) and N
2 (99.995 %) gases were introduced into the 11
deposition chamber. High purity O2 (99.995%) was also used for the deposition of the reference 12
TiO2. The gas flow rates were monitored to maintain a constant pressure of 1.4 mTorr inside the 13
chamber during the sputter-deposition process. In order to control the N incorporation in the 14
TiO2:WN and TiO2:N films, the relative nitrogen mass flow rate ratio RN2 (i.e. [N2]/([N2]+[Ar]) was 15
varied between 0 and 15%. The W incorporation was controlled by varying the W target power 16
density (Wpower) from 50 mW/cm2 to 250 mW/cm2. The TiO2:WN films were simultaneously 17
deposited onto different substrates, including: (i) undoped and double side-polished Si(100), (ii) 18
quartz, and (iii) deployed (10 cm x 11 cm) Ti-grids. The substrates were mounted on a holder located 19
off-axis at a distance of 20 cm from the target, and heated during deposition by a quartz lamp heater 20
to an actual on-substrate temperature of ~470 °C. Prior to film deposition, the target was 21
systematically sputter-cleaned with Ar ions for ~15 min with the shutters closed. The thickness of 22
the TiO2:WN films was in-situ monitored by means of a calibrated quartz-crystal microbalance and 23
ex-situ measured through cross-section scanning electron microscopy (SEM) observations by means
of a Jeol JSM-6300F SEM system. No post-acceleration voltage was intentionally applied to the 1
substrates during the sputter-deposition process (they were nonetheless subjected to a built-in 2
plasma sheath bias of ~ -14 V during their growth). The atomic composition and chemical bonding 3
states of the films were systematically investigated by means of X-ray photoelectron spectroscopy 4
(XPS). The XPS spectra were collected by using the ESCALAB 220i-XL spectrophotometer, 5
equipped with an AlKα (1486.6 eV) twin-anode source, after a systematic in-situ surface cleaning 6
by means of 5 keV Ar+ ion sputtering gun. The crystalline structure of the films on quartz substrates 7
was characterized by means of a PANalytical X-Pert Pro X-ray diffractometer (XRD) system 8
using CuKα radiation of 1.5418 . The ultra-violet and visible (UV-Vis) transmittance and 9
reflectance spectra of the TiO2:WN films were systematically measured by using an Agilent/Varian 10
Cary 5000 system. Thus, their Eg values were derived from UV-Vis Tauc plot extrapolation. The 11
EPC properties of the TiO2:WN films deposited onto deployed titanium-grid substrates (used as 12
photoanodes) were evaluated in an EPC reactor of which details are described elsewhere33. 13
14
Results and Discussion
15
The structural and morphological features arising from the concomitant incorporation of N and W 16
atoms into TiO2 were studied via cross-section SEM observations. We have previously showed that 17
the introduction of N2 in the deposition chamber leads to an energetic competition between the the 18
dissociation of N2 molecules and the production ions that contribute to the sputtering process itself.7 19
Here, we focus on the concomitant interplay between W and N sources and their effects on the 20
deposited films. Figure 1(a) presents the deposition rate as a function of Wpower (bottom x-axis; with 21
RN2 kept constant at 6%), and RN2 (top x-axis; with Wpower kept constant at 132 mW/cm2). We note 22
that N2 introduction creates a competitive balance between the energy consumption for N2 molecule 23
dissociation and sputtering ion production with an optimal deposition point at around 7% RN2. It is 24
expected that this optimal point should shift to higher RN2 as more power is put in the system. 1
Additionally, we note that increasing the power imposed on the W target while maintaining RN2 2
constant linearly increased the deposition rate. This power dependence of the deposition rate is 3
typical for metallic targets in a sputtering process.34 The morphology of the sputter-deposited 4
TiO2:WN films showed no significant differences as a function of deposition parameters. From that 5
perspective, all the sputter-deposited films were found to be dense, smooth, and exhibit a uniform 6
apparent morphology regardless of Wpower or RN2. A typical cross sectional SEM image of a 7
TiO2:WN film can be seen in Figure 1(b), the deposition parameters for this film were the crossover 8
point from Figure 1(a): Wpower = 132 mW/cm2 and RN2 = 6%. The thicknesses of the films 9
investigated here are in the 200-400 nm range, depending on the deposition conditions. The exact 10
film thickness will be used for each corresponding film for the determination of its optical absorption 11
coefficient. 12
The effectiveness of our sputter process to incorporate N and W dopants in the TiO2:WN films was 13
investigated by means of XPS analysis of the N 1s, Ti 2p, O 1s, W 4f, and W 4p core level spectra. 14
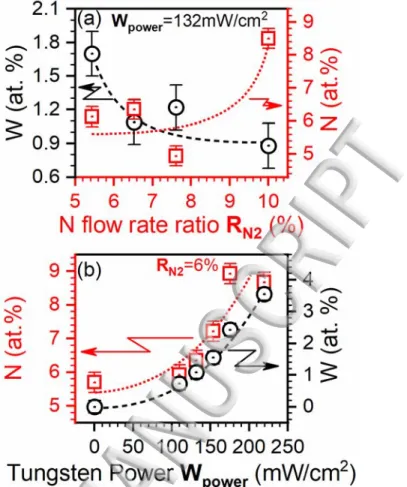
The variation of deposition parameters Wpower and RN2 on the incorporation of each dopant is 15
presented in Figure 2. Figure 2(a) shows the incorporation of W (left y-axis) and N (right y-axis) 16
atoms with varying RN2 while Wpower is maintained constant at 132 mW/cm2. From this Figure 2(a), 17
one can see that the increase of RN2 translates into a progressive increase of N incorporation. 18
However, it is also seen that the increase of N incorporation occurs to the detriment of W 19
incorporation. The increase of N content with RN2 is a direct consequence of an increased amount 20
of N atoms in the plasma mix during the deposition process. This results into more N atoms available 21
for incorporation, which enter in a sort of competition with W atoms (at a fixed power on the W 22
target), lowering thereby their incorporation when RN2 is increased. In contrast, when the RN2 is 23
fixed (at 6% here) and Wpower is increased, the incorporation of both N and W steadily increase with 1
Wpower, as shown in Figure 2(b). This behavior can be explained by two facts: (i) the incorporation 2
of W into the TiO2 lattice is expected to increase the solubility limit of the N dopant.5,23 The 3
solubility increase is caused mainly by the introduction of W atoms into the TiO2 lattice which 4
lowers the formation energy of substitutional N and increases the total free valence of the 5
matrix.21,23,24 Secondly, (ii) the increase of W
power, while keeping a constant RN2, leads to more 6
sputtered W atoms and concomitantly provides additional energy for the dissociation of N2 7
molecules into N atoms. Figures 2 (a) and (b) highlight the ability of our process to precisely control 8
the incorporation levels of each dopant in the sputtered TiO2 films through the appropriate tuning of 9
both Wpower and RN2. Finally, the fundamental characteristics of the XPS binding energy (BE) spectra 10
were found to be very similar within the investigated concentration ranges (i.e. 0 to ~3 at.% and 0 11
to ~9 at.% for W and N contents, respectively). Indicating that for these doping levels, the chemical 12
bonding of these films may vary in content (depending on the doping levels), but their nature remains 13
the same. 14
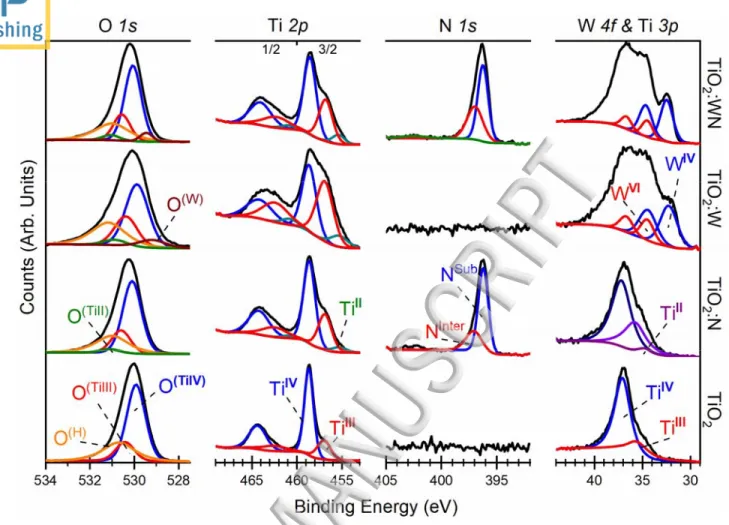
Figure 3 shows the high-resolution BE spectra of the O 1s, Ti 2p, N 1s, and W 4f (from left to right 15
respectively) core levels for different films, namely TiO2, TiO2:N, TiO2:W, and TiO2:WN films 16
(from bottom to top, respectively). These core level spectra were deconvoluted into their different 17
components corresponding to various local electronic environments (oxidation/bonding states). For 18
the TiO2 films, the Ti 2p3/2 peak can be decomposed into two main components corresponding to
19
two oxidation states of Ti, namely TiIV and TiIII at 458.6 eV and 456.9 eV, respectively, with their 20
corresponding Ti 2p1/2 energy levels found at 5.7 eV and 5.5 eV higher BE, having 1:2 branching
21
ratios.7,31,35–37 For subsequent W 4f fitting purposes (as the Ti 3p energy window overlaps the W 4f 22
peak energies), Ti 3p peaks were deconvoluted to reveal TiIV and TiIII oxidation state peaks at 37.1 23
eV and 35.7 eV respectively,38,39 in full agreement with the Ti 2p derived quantifications. The 1
presence of TiIII can be attributed to sub-stoichiometric species formed mainly as a result of 2
preferential sputtering during thin film deposition.7,40 Given that Ar+ ion etch-cleaning is used to 3
eliminate surface carbonaceous contaminants prior to acquisition, the TiIII quantification is assumed 4
to be slightly overestimated. However, this contribution is expected to remain unchanged for all 5
surveyed samples as surface etch-cleaning parameters were kept constant.7,36,40 This feature is 6
important as its presence is indicative of VO in the lattice, a defect associated with high levels of 7
photocharge recombination.4,8,41 The Ti 2p states can be inferred in the corresponding O 1s core 8
levels. The main O(TiIV) peak at 529.9 eV is associated with lattice oxygen in the TiO2 matrix; we 9
note that sub-stoichiometric lattice oxygen can also be distinguished and identified as O(TiIII) at 10
~0.5eV higher binding energy.35,36 Additionally, we note the presence of a third peak, denoted as 11
O(H) at 530.7 eV and about double the FWHM of the other O 1s peaks. Commonly, this peak is 12
attributed to O 1s defective oxygen and surface hydroxide species.35,36,42 This contribution is 13
expected to remain of similar relative intensity in relation to the main O 1s peaks for all films.35,36 14
The XPS derived composition of undoped films, calculated from relative peak intensities, is found 15
to be ~TiO1.87. 16
As nitrogen gas is introduced into the deposition chamber (TiO2:N films), the appearance of the N 17
1s peak in the film’s XPS spectra can be observed with two characteristic components: Nsub and 18
Ninter at 396.2 eV and 397.2 eV binding energies, respectively. The Nsub peak is known to arise from 19
substitutional -Ti-N- type bonds and the Ninterpeak is associated with interstitial -O-N type bonds 20
within the titania crystal structure.4,6,7,11–13 The relative intensity of the peaks confirms that most of 21
the doping is of the substitutional type, associated with the visible light photosensitisation of TiO2:N 22
via the introduction of N 2p levels just above the O 2p composed VBM.4,6,7,11–13 However, the 23
introduction of N into the thin films is accompanied with the appearance of TiII oxidation state 1
species in the Ti 2p BE spectra (TiII 2p3/2 at 455.3 eV and the 2p1/2 component at 5.6 eV higher BE) 2
and Ti 3p (TiII 3p at 34.8 eV).4,43 This reduced state can also be inferred on the O 1s spectra with 3
the appearance of O(TiII) (~1eV higher BE than the O(TiIV) peak).35,38 These reduced valence states 4
are known to arise from the electronic distortions induced by nitrogen doping, reducing TiIV species 5
into TiIII, and on a much lesser extent into TiII. These bonding states are indicative of the lattice 6
compensating for localised deep charge defects (known to arise from interstitial type N doping), 7
mainly via the formation of VO.4,7,8,14,41 If substitutional type of doping is considered, the obtained 8
stoichiometry of the N-doped films is ~TiO1.69:N0.12 (total N ~6.3 at.%, with Nsub ~4.2 at.%); this 9
relatively low O content indicates a high density of VO present within the thin films, justifying the 10
significant increase of highly reduced Ti species. 11
The addition of tungsten (W) in the co-sputtering process, via sputtering of a metallic W target 12
concomitantly with the TiO2 target sputtering, leads to the appearance of two main features in the 13
W 4f BE window of the TiO2:W thin-films (Figure 3). These W 4f peaks are due to the WVI and WIV 14
states in the oxide form with the main 4f7/2 components appearing at 34.5 eV and 32.3 eV,
15
respectively, with the corresponding 4f5/2 doublets found at 2.2eV higher BE with a 3:4 peak
16
intensity ratio.37,44–47 The appearance of the O(W) peak at 529.2 eV in the O 1s spectra can be inferred, 17
as some of oxygen species are associated with W.46 The XPS derived composition of these films is 18
~TiO1.84:W0.06 (total W ~2.3 at.%). From these analyses, we note that W doped films present lower 19
density of VO than N doped films. This aligns with theoretical models predicting that W-doping 20
should reduce the formation of VO (increase in formation energy) as compared to N-doping.20 21
Due to size constraints, W and N are mostly expected to substitute for Ti and O atoms, respectively 22
(nonetheless, interstitial N is also possible as above discussed), and -W-N- type bonds are 23
energetically superimposed to -Ti-N- type bonds.48,49 Therefore, little effect is expected in the N 1s 1
and corresponding cation signatures. Thus, it can be confirmed that both the W and N species are 2
incorporated into mostly substitutional locations within the TiO2 matrix as they present identical 3
chemical energy states as the TiO2:N4,6,7 and TiO2:W.37,44–46 This being said, the XPS derived 4
composition of this codoped film is ~TiO1.83:W0.04N0.09 (N ~4.9 at.% and W ~1.2 at.%). This film 5
composition indicates that there is a lack of O in the films, at a similar atomic proportions as in the 6
undoped samples (which were interestingly deposited with additional oxygen during sputtering). 7
This indicates that there are less oxygen vacancies in the codoped films as compared to the N-8
monodoped ones. This is in accordance with theoretical models that predict that when both dopants 9
(W and N) are introduced simultaneously, there is a significant reduction of electronic defect 10
formation (such as VO).5,18–21,23,24 Table 1 summarises the XPS derived dopant levels of the 11
TiO2:WN films along with their corresponding thickness, as determined from SEM cross-section 12
observations. 13
N (at.%) W (at.%) Thickness (nm)
0.0 0.0 200 2.4 0.0 260 5.7 0.0 250 0.0 0.6 400 0.0 2.3 380 0.0 3.1 430 2.5 2.4 300 5.9 0.7 310 6.4 1.1 300 7.2 1.6 300 8.9 2.4 410 4.9 1.2 370 8.5 0.9 270 7.7 0.2 270 7.9 0.3 280 8.7 3.6 340 6.4 3.6 270
Table 1: Film thickness (as derived from SEM observations) and total dopant contents (from XPS) 1
for the samples used in the UV-Vis. characterizations. 2
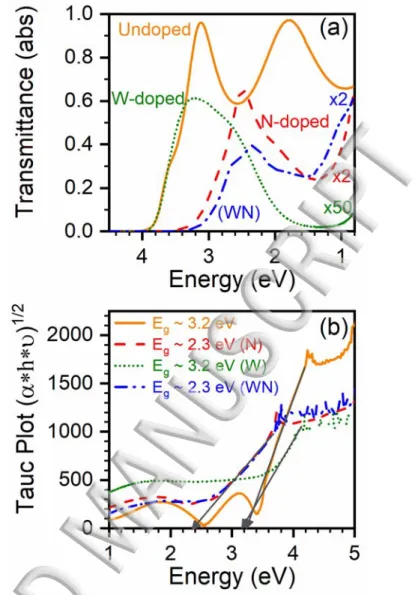
Our previous work has shown that the N substitutional doping significantly affects the optical 3
properties of the N-doped TiO2 films, namely narrowing their bandgap.7 Hence, the effect of W and 4
N dual doping on the optical properties of the TiO2:WN films was systematically investigated as a 5
function of the doping scheme (i.e., N, W, and WN). Figure 4(a) shows UV-Vis transmittance 6
spectra of the TiO1.87, TiO1.84:W0.06, TiO1.69:N0.12, and TiO1.83:W0.04N0.09 films deposited onto quartz 7
substrates. We note a significant red shift of the absorption band edge of the spectra from about 8
320nm for undoped TiO2 films to ~420nm for the TiO1.69:N0.12 films, and to ~440 nm for 9
TiO1.83:W0.04N0.09 films. In agreement with our previous work, our results showed that any doping 10
content beyond this doping point did not necessarily translate into further red shifting of the 11
absorption edge.7 It is to be noted that the W-doped films (TiO
1.84:W0.06) showed the same absorption 12
edge as undoped TiO2 films (no red-shift). This confirms that it is indeed nitrogen that produces 13
energy states responsible for the observed photosensitization of the TiO2:WN films in the visible. In 14
order to derive a quantitative value of the Eg for these thin films, the corresponding UV-Vis spectra 15
(transmittance and reflectance used to extract the absorption coefficient) were analyzed according 16
to the Tauc formalism,45 where the E
g value can be deduced from the x-intercept of the tangential 17
extrapolation of the Tauc plots, as shown in Figure 4(b). We note that indeed, both the TiO1.69:N0.12, 18
and TiO1.83:W0.04N0.09 samples show significant optical Eg reduction to around ~2.3 eV, while the 19
TiO1.87 and TiO1.84:W0.06 films exhibit an Eg of ~3.2 eV, consistent with indirect gap values quoted 20
for titania in the literature.4,8 These results confirm that W doping has no significant impact on the 21
absorption edge of the films, while the N doping induced visible photosensitisation is still effective 22
in the co-doping scheme. In order to get a broader picture, the Eg values were derived for numerous 23
TiO2:WN codoped films with a broader range of doping levels and reported in a sort of a 2D map 24
of which X and Y axes are N and W doping level, as shown in Figure 5. We note that in the Y-axis 1
(W concentration) that there is a very little to no effect on the Eg variation (varying W by about 3 2
at.% induces only a small ~0.2 eV change in Eg value), mostly through the creation of shallow states 3
below the CB.19,50 In contrast, the main determining factor for bandgap narrowing of the TiO2:WN 4
films (and thereby their photosensitisation to visible light) is their N doping level. Additionally, we 5
noticed that beyond a N-doping level ~6 at.% of N, no additional gain in visible light absorption can 6
be obtained. This points up the existence of an optimal nitrogen doping concentration range (5-6 7
at.%) where the Eg stays at its lowest value of ~2.3 eV (a bandgap value that ensures effective visible 8
light photosensitization of TiO2 films). This observation, along with the theoretical prediction20 that 9
states that the acceptor-donor passivation is most efficient with the N:W ratio close to 2:1 is what 10
guided the selection of our representative TiO2:WN samples to be used for further analysis. Thus, 11
the following film compositions were investigated: TiO1.87, TiO1.84:W0.06, TiO1.69:N0.12, and 12
TiO1.83:W0.04N0.09. In order to better understand the relationship between EPC performance and 13
dopant induced band-gap narrowing, one has to have access to other physical parameters, such as 14
the Fermi energy, work function, and valence band maximum (VBM)/conduction band minimum 15
(CBM) energy levels (a study that is beyond the scope of the present paper). In fact, the measurement 16
and quantification of the above-mentioned optoelectronic characteristics of the doped TiO2 films in 17
order to reconstruct the band energy diagrams is a thorough study that has been reported elsewhere.32 18
We briefly highlight here some of the relevant insights gained from this study32 : first, (i) W-doping 19
keeps most of the Eg features unchanged outside of the introduction of new states below the CBM, 20
(ii) N-doping shrinks the Eg mostly via the introduction of new mid-gap N 2p states above the mostly 21
O 2p populated VBM while reducing the work function, and (iii) WN-codoping shrinks the Eg 22
mostly via hybridizing N 2p states with VBM O 2p states while leaving most other features 23
unchanged.32 In summary, while both N-doped and WN-codoped samples show a significant 24
reduction in their Eg, the acceptor-donor codoped samples are expected to outperform monodoped 1
ones due to less midgap states, defect states, and better placements of the VBM energy levels.32 2
It is worth reiterating that the crystallinity of the films plays a key role in their EPC properties as it 3
determines features such as the bandgap, average crystallite size (mean free path of charges), etc4,8. 4
Therefore, we have used XRD to investigate the crystalline structure of our films as a function of 5
their doping scheme, and the obtained spectra are displayed in Figure 6. The TiO1.87 films are seen 6
to crystallize in the anatase (A) phase with the characteristic (101), (103), (004), (112), (200), (105), 7
and (211) peaks (JCPDS no.: 84-1286); with the main A(101) peak at 25.4° with 0.4° of full width 8
at half maximum (FWHM). The Williamson-Hall size-strain analysis51 revealed lattice parameters 9
typical of anatase under low tensile strain (~0.66%), as shown in Table 2. This is most likely due to 10
the oxygen vacancies present in the structure, causing some of the Ti atoms to reduce from TiIV to 11
TiIII (as above-shown by XPS), increasing their atomic radii. When nitrogen is incorporated into the 12
structure, the crystalline quality of the TiO2:N films is significantly reduced as seen in Figure 6 13
(signal to noise ratio and FWHM ~0.7° for the A(101)). The tensile strain of the TiO2:N films 14
increased to ~2.75%, explaining the observed relative deterioration of their crystalline quality. This 15
strain exists due to a couple of reasons: (i) N-doping reduces the formation energy of VO facilitating 16
sub-stoichiometric oxide formation,4,23,24,52,53 and (ii) interstitial N-doping will impose a certain 17
stretching of the lattice.54 In the case of W doping, the crystallinity of the TiO
2:W films is also seen 18
to be greatly affected. Given that WVI and TiIV are of similar ionic radii (around 0.600 and 0.605 19
), substitutional WVI doping should not affect the TiO
2 lattice structure significantly. However, as 20
shown by XPS analysis in Figure 3 we note the presence of WIV species in the TiO
2 structure, this 21
reduced state is of higher atomic radii (0.660 ) and is associated with the distortion of the crystal 22
lattice to higher 2θ values.37 Additionally, WIV species (WO2 type crystal) naturally crystallize in a 23
rutile structure.55 In fact, this and the W doping generated strain (as high as ~4.06%) in the lattice 1
induce the TiO2:W films to transition into the rutile polymorph.7,37 In Figure 6 the rutile phase peaks 2
are seen to be predominant and very broad (with a FWHM as large as ~2.1° for the R(110) peak). 3
The less intense anatase peak (A(101) is also found to be very broad with a FWHM of ~1.9°). 4
Interestingly, in the case of WN-codoping, the anatase phase is recovered with a high crystalline 5
quality (the FWHM of the anatase (101) peak FWHM is of ~0.5°) and a moderate tensile strain 6
(estimated to ~1.9%). The crystallite size (of ~30 nm) of these codoped films was found to be very 7
comparable to that of undoped TiO1.87 films. Moreover, one can note that the strain in the WN-8
codoped films is lower as compared to their monodoped counterparts (i.e. W-doped and N-doped; 9
see Table 2). This recovery of the anatase phase seems to be a direct result of local dopant charge 10
passivation, leading to a reduction of structural defects that arise from uncompensated lattice 11
charges. Indeed, substitutional W and N dopants have been reported to result in a charge-passivated 12
lattice with lower VO formation.21–24 13
Sample TiO2 TiO1.89 TiO1.84:W0.06 TiO1.69:N0.12 TiO1.83:W0.04N0.09
a (nm) 0.378 0.378 N/A 0.381 0.384
b (nm) 0.378 0.378 N/A 0.381 0.384
c (nm) 0.950 0.944 N/A 0.966 0.934
c/a 0.251 0.250 N/A 0.254 0.243
Vol. (nm3) 0.136 0.135 N/A 0.140 0.138
Crys. Size (nm) N/A 27.68 6.40 7.00 32.93
Internal strain (η) 0.00% 0.66% 4.10% 2.75% 1.90%
Table 2: Williamson-Hall calculated lattice parameters based on the XRD spectra of Figure 4 for 14
the various doping schemes alongside theoretical TiO2 lattice values. 15
Finally, in order to assess the electro-photocatalytic properties of our doped TiO2 films, while taking 16
advantage of their visible light photosensitisation and the acceptor-donor passivated codopants, the 17
codoped TiO1.83:W0.04N0.09 films along with TiO1.87, TiO1.69:N0.12, and TiO1.84:W0.06 films were 18
deposited onto both sides of deployed Ti-grid substrates (10 cm x 11 cm) and used as photoanodes. 1
Those photoanodes were integrated into a home built electro-photocatalytic (EPC) reactor (of which 2
details can be found elsewhere33). The EPC performance of our photoanodes was assessed towards 3
the degradation of a real emerging contaminant that is atrazine. Atrazine is a pollutant that is widely 4
used as a pesticide in agriculture. For the purpose of the present study, synthetic solutions containing 5
atrazine concentrations of 60 µg/L (60 ppb, as these are the typical concentrations of heavily polluted 6
areas) were prepared and treated in our EPC reactor under AM 1.5G solar simulator while 7
continuously circulating the solution during the treatment time which was of up to 2 hours. The 8
reaction kinetics for the four different types of photoanodes are shown in Figure 7(a). We note that 9
while TiO1.87 is found to degrade atrazine, the degradation reaction is relatively slow (after 1 hour 10
of treatment, ~20 ppb of atrazine I still present in the solution). In the case of TiO1.69:N0.12 11
photoanodes, the degradation efficiency is seen to improve due to the photosensitisation effect of 12
nitrogen doping; allowing the use of a higher portion of visible light photons for the generation of 13
excitons to be used in the photocatalytic process.7,33 Surprisingly, TiO1.84:W0.06 photoanodes were 14
found to perform similarly (within the statistical error margin) to the photosensitized TiO1.69:N0.12, 15
even if their bandgap is much larger than that of N-doped TiO2. This effect is mainly attributed to 16
the W induced increase of the photocharge lifetimes of the TiO2:W films, as compared to the N-17
doped photoanodes.19,50,56 In fact, a more systematic study of the effect of the doping scheme on the 18
photocharge lifetimes has been carried out and reported elsewhere.56 Important to underline here is 19
that the W dopant was found to increase the formation energy of VO defects, and to locally passivate 20
charge disparities when co-introduced with N.56 These effects have led to WN-codoped samples 21
exhibiting a very good visible-light sensitivity while having photocharge lifetimes up to three times 22
longer than those measured in their N-doped TiO2 counterparts (photocharge trapping decay 23
constant of 90 ± 7 ns for TiO2:WN versus 30 ± 10 µs for TiO2:N).56 This corroborates well with the 24
fact that the codoped TiO2:WN photoanodes are the most effective ones for atrazine degradation, as 1
can be clearly seen in Figure 7(b). Indeed, after just 30 min of treatment, the TiO2:WN photoanodes 2
degraded 94% of the atrazine present in the solution (this represents 24% and 71% more than the N-3
doped and the undoped TiO2 photoanodes, respectively). Those results clearly confirm the benefit 4
of the TiO2 photoanode WN-codoping for the EPC degradation of pollutants. In fact, nitrogen 5
doping allows for photosensitivity of the photoanodes in the visible domain, permitting thereby the 6
additional use of visible light photons for photocatalysis. However, part of this advantage is 7
counteracted by N doping induced deep states in the Eg that act as recombination centers trapping 8
the photogenerated charges. This drawback, in turn, can be minimised via the electronically 9
passivated WN-codoping approach, allowing for the recovery of a significant increase in EPC 10
performance,21,23,24 as exhibited here by our TiO
2:WN photoanodes. 11
Conclusion
12
In summary, we were able to develop and apply a reliable RF magnetron sputtering process for the 13
fabrication on in-situ doped and codoped TiO2 films with different W and N doping concentrations, 14
in the ranging 0-3 at.% and 0-9 at.% ranges, respectively. All the deposited films have shown a 15
dense, smooth, and uniform apparent morphology, regardless of their doping conditions. By 16
adjusting the relevant operating parameters, namely Wpower and RN2, we were able to fine-tune the 17
incorporation of W and N dopants into the TiO2 films. The XPS analyses have revealed that both 18
the W and N species are mostly incorporated into substitutional doping locations in the TiO2 matrix. 19
The N-doping was shown to increase significantly the density of VO defects (TiO1.69:N0.12 20
composition as compared to the undoped TiO1.87). In contrast, the (WN) codoping was found to 21
minimise the formation of VO (i.e.; TiO1.83:W0.04N0.09). From optoelectronic viewpoint, both N-22
doping and WN-codoping were found to induce a significant red shift of the absorption edge, leading 23
to a bandgap narrowing by ~0.9 eV. Thus, the bandgap of both TiO2:N and TiO2:WN films was 1
found to be in the visible range with a value as low as 2.3 eV. N-doping was pinpointed as the most 2
determining factor for bandgap narrowing. An N-doping concentration of ~5.5 at.% was identified 3
as the optimal content for the narrowest bandgap. Higher N-doping contents do not translate into 4
additional narrowing of the bandap. On the other hand, XRD results have shown a significant 5
decrease in crystalline quality of the films and an increase in their lattice strain in the case of 6
monodoping. This was particularly observed in the case of W-doped films, where the relatively 7
strong tensile strain has led to a transition from anatase to rutile phase. This drawback of 8
monodoping was significantly reduced when the codoping scheme was adopted, as the lattice strain 9
was found to diminish significantly along with the recovery of high crystallinity (of the anatase 10
phase) of the codoped films. Finally, our EPC experiments have shown that TiO2:WN codoped 11
photoanodes are the most effective for atrazine degradation (93% of atrazine was degraded within 12
the first 30 min of treatment time under AM1.5G solar radiation). Indeed, the codoped TiO2:WN 13
photoanodes have performed 71% better than the undoped-TiO2 and 24% better than the N-doped 14
TiO2:N ones, during the first 30 min of treatment. This emphasizes the benefit of using WN-codoped 15
TiO2 for EPC applications through the enhanced harvesting of visible light (as evidenced by 16
improved EPC performance) in comparison to N-doped photoanodes. The developed TiO2:WN 17
photoanodes definitely open up new prospects for the degradation of emerging contaminants in 18
water while using the direct sunlight radiation. 19
Acknowledgements
20
The authors would like to acknowledge the financial support from NSERC (the Natural Science and 21
Engineering Research Council of Canada), and the FRQNT (Le Fonds de Recherche du Québec-22
Nature et Technologies) through its strategic Network “Plasma-Québec”. 23
References
1
1 A. FUJISHIMA and K. HONDA, Nature 238, 37 (1972). 2
2 B. O’Regan and M. Grätzel, Nature 353, 737 (1991). 3
3 S.U.M. Khan, M. Al-Shahry, and W.B. Ingler, Science 297, 2243 (2002). 4
4 A. V. Emeline, V.N. Kuznetsov, V.K. Rybchuk, and N. Serpone, Int. J. Photoenergy 2008, 1 5
(2008). 6
5 I.S. Cho, C.H. Lee, Y. Feng, M. Logar, P.M. Rao, L. Cai, D.R. Kim, R. Sinclair, and X. Zheng, 7
Nat. Commun. 4, 1723 (2013). 8
6 R. Asahi, Science (80-. ). 293, 269 (2001). 9
7 N. Delegan, R. Daghrir, P. Drogui, and M.A. El Khakani, J. Appl. Phys. 116, 153510 (2014). 10
8 A. Fujishima, X. Zhang, and D. Tryk, Surf. Sci. Rep. 63, 515 (2008). 11
9 D.O. Scanlon, C.W. Dunnill, J. Buckeridge, S. a Shevlin, A.J. Logsdail, S.M. Woodley, C.R. a 12
Catlow, M.J. Powell, R.G. Palgrave, I.P. Parkin, G.W. Watson, T.W. Keal, P. Sherwood, A. 13
Walsh, and A. a Sokol, Nat. Mater. 12, 798 (2013). 14
10 C. Di Valentin, G. Pacchioni, A. Selloni, S. Livraghi, and E. Giamello, J. Phys. Chem. B 109, 15
11414 (2005). 16
11 C. Di Valentin, G. Pacchioni, and A. Selloni, Phys. Rev. B 70, 85116 (2004). 17
12 J. Lynch, C. Giannini, J.K. Cooper, A. Loiudice, I.D. Sharp, and R. Buonsanti, J. Phys. Chem. C 18
119, 7443 (2015).
19
13 F. Peng, L. Cai, H. Yu, H. Wang, and J. Yang, J. Solid State Chem. 181, 130 (2008). 20
14 G.R. Torres, T. Lindgren, J. Lu, C.-G. Granqvist, and S.-E. Lindquist, J. Phys. Chem. B 108, 21
5995 (2004). 1
15 M. D’Arienzo, N. Siedl, A. Sternig, R. Scotti, F. Morazzoni, J. Bernardi, and O. Diwald, J. 2
Phys. Chem. C 114, 18067 (2010). 3
16 B. Liu, L. Wen, and X. Zhao, Mater. Chem. Phys. 106, 350 (2007). 4
17 R. Katoh, A. Furube, K. Yamanaka, and T. Morikawa, J. Phys. Chem. Lett. 1, 3261 (2010). 5
18 W.-J. Yin, H. Tang, S.-H. Wei, M.M. Al-Jassim, J. Turner, and Y. Yan, Phys. Rev. B 82, 45106 6
(2010). 7
19 V. Çelik and E. Mete, Phys. Rev. B 86, 205112 (2012). 8
20 M. Li, J. Zhang, and Y. Zhang, Chem. Phys. Lett. 527, 63 (2012). 9
21 R. Long and N.J. English, Chem. Mater. 22, 1616 (2010). 10
22 R. Long and N.J. English, Appl. Phys. Lett. 94, 132102 (2009). 11
23 D. Wang, Y. Zou, S. Wen, and D. Fan, Appl. Phys. Lett. 95, 12106 (2009). 12
24 Y. Gai, J. Li, S.-S. Li, J.-B. Xia, and S.-H. Wei, Phys. Rev. Lett. 102, 36402 (2009). 13
25 X. Cui, S. Rong, Y. Cao, Y. Yin, S. Li, and M. Li, Appl. Phys. A 113, 47 (2013). 14
26 S.S. Thind, G. Wu, M. Tian, and A. Chen, Nanotechnology 23, 475706 (2012). 15
27 S.S. Thind, G. Wu, and A. Chen, Appl. Catal. B Environ. 111–112, 38 (2012). 16
28 A. Kubacka, B. Bachiller-Baeza, G. Colón, and M. Fernández-García, Appl. Catal. B Environ. 17
93, 274 (2010).
18
29 A. Folli, J.Z. Bloh, E.-P. Beukes, R.F. Howe, and D.E. Macphee, J. Phys. Chem. C 117, 22149 19
(2013). 20
30 J.Z. Bloh, A. Folli, and D.E. Macphee, J. Phys. Chem. C 118, 21281 (2014). 21
31 S.S. Thind, G. Wu, M. Tian, and A. Chen, Nanotechnology 23, 475706 (2012). 1
32 R. Pandiyan, N. Delegan, A. Dirany, P. Drogui, and M.A. El Khakani, J. Phys. Chem. C 120, 2
631 (2016). 3
33 R. Daghrir, P. Drogui, I. Ka, and M.A. El Khakani, J. Hazard. Mater. 199–200, 15 (2012). 4
34 L.I. Maissel, R. Glang, and P.P. Budenstein, J. Electrochem. Soc. 118, 114C (1971). 5
35 M.C. Biesinger, B.P. Payne, A.P. Grosvenor, L.W.M. Lau, A.R. Gerson, and R.S.C. Smart, 6
Appl. Surf. Sci. 257, 887 (2010). 7
36 M.J. Jackman, A.G. Thomas, and C. Muryn, J. Phys. Chem. C 119, 13682 (2015). 8
37 S. Sathasivam, D.S. Bhachu, Y. Lu, N. Chadwick, S. a. Althabaiti, A.O. Alyoubi, S.N. Basahel, 9
C.J. Carmalt, and I.P. Parkin, Sci. Rep. 5, 10952 (2015). 10
38 F. Werfel and O. Brümmer, Phys. Scr. 28, 92 (1983). 11
39 J. Riga, C. Tenret-Noël, J.J. Pireaux, R. Caudano, J.J. Verbist, and Y. Gobillon, Phys. Scr. 16, 12
351 (1977). 13
40 D. Brassard, M. a. El Khakani, and L. Ouellet, J. Appl. Phys. 102, 34106 (2007). 14
41 A.K. Rumaiz, J.C. Woicik, E. Cockayne, H.Y. Lin, G.H. Jaffari, and S.I. Shah, Appl. Phys. Lett. 15
95, 262111 (2009).
16
42 M. Kitano, K. Funatsu, M. Matsuoka, M. Ueshima, and M. Anpo, J. Phys. Chem. B 110, 25266 17
(2006). 18
43 M.-S. Wong, H. Pang Chou, and T.-S. Yang, Thin Solid Films 494, 244 (2006). 19
44 T. Mishra, M. Mahato, N. Aman, J.N. Patel, and R.K. Sahu, Catal. Sci. Technol. 1, 609 (2011). 20
45 J. Li, J. Xu, W.L. Dai, H. Li, and K. Fan, Appl. Catal. B Environ. 82, 233 (2008). 21
46 K.T. Ng and D.M. Hercules, J. Phys. Chem. 80, 2094 (1976). 1
47 M. Sun, N. Xu, Y.W. Cao, J.N. Yao, and E.G. Wang, J. Mater. Res. 15, 927 (2000). 2
48 Y.-C. Nah, I. Paramasivam, R. Hahn, N.K. Shrestha, and P. Schmuki, Nanotechnology 21, 3
105704 (2010). 4
49 Y. Zhao, W. Hu, Y. Xia, E. Smith, Y. Zhu, C. Dunnill, and D. Gregory, J. Mater. Chem. (2007). 5
50 X.. Li, F.. Li, C.. Yang, and W.. Ge, J. Photochem. Photobiol. A Chem. 141, 209 (2001). 6
51 G.. Williamson and W.. Hall, Acta Metall. 1, 22 (1953). 7
52 A. Kumar and T. Mohanty, J. Phys. Chem. C 118, 7130 (2014). 8
53 L. Wan, J.F. Li, J.Y. Feng, W. Sun, and Z.Q. Mao, Mater. Sci. Eng. B 139, 216 (2007). 9
54 Y. Shen, T. Xiong, T. Li, and K. Yang, Appl. Catal. B Environ. 83, 177 (2008). 10
55 F.J. Wong and S. Ramanathan, J. Mater. Res. 28, 2555 (2013). 11
56 N. Delegan, R. Pandiyan, S. Johnston, A. Dirany, S. Komtchou, P. Drogui, and M.A. El 12
Khakani, J. Phys. Chem. C 7b11266 (2018). 13
14
Figures
1
2
Figure 1: (a) variation of deposition rate at constant RN2 (black dash-dot line) with varying Wpower 3
and the variation with constant Wpower with varying RN2 (red dash line); (b) SEM micrograph of a 4
Wpower = 132 mW/cm2 and RN2 = 6 % deposited TiO2:WN film. 5
1
Figure 2: (a) W and N incorporation rate (left and right hand y-axis respectively) at constant 2
Wpower with varying RN2, (b) N and W incorporation (left and right hand y-axis respectively) at 3
constant RN2 with varying Wpower. 4
1
Figure 3: High-resolution XPS spectra of the O 1s (a), Ti 2p (b), N 1s (c), and W 4f core levels 2
(from left-to-right) of the TiO2, TiO2:N, TiO2:W, and TiO2:WN films (from bottom-to-top) as a 3
function of each doping scheme. Ti 3p signatures obscured in the case of W containing films as to 4
prioritise visibility of W 4f levels. 5
1
Figure 4: (a) Selected UV-Vis transmittance spectra of the sputter-deposited TiO2, TiO2:N, 2
TiO2:W, and TiO2:WN films (b) Tauc plots of those films with their corresponding extrapolated Eg 3
values. 4
1
Figure 5: 2D-map displaying the variation of Eg as a function of both Nitrogen and Tungsten 2
doping concentrations. The color scale (on the right-hand side) depicts the bandgap values. 3
1
Figure 6: Typical XRD spectra of the sputter-deposited TiO2, TiO2:N, TiO2:W, and TiO2:WN 2
films. 3
1
Figure 7: (a) Residual Atrazine concentration as a function of EPC degradation time, and (b) 2
electro-photocatalytic degradation efficiency of atrazine, under AM1.5 solar irradiation, for the 3
four different photoanodes (i.e. TiO2, TiO2:N, TiO2:W, and TiO2:WN thin-films). 4
5