Open Archive TOULOUSE Archive Ouverte (OATAO)
OATAO is an open access repository that collects the work of Toulouse researchers and
makes it freely available over the web where possible.
This is an author-deposited version published in :
http://oatao.univ-toulouse.fr/
Eprints ID : 17433
To link to this article : DOI : 10.1016/j.jnoncrysol.2016.10.025
URL :
http://dx.doi.org/10.1016/j.jnoncrysol.2016.10.025
To cite this version :
Roggero, Aurélien and Dantras, Eric and
Paulmier, Thierry and Tonon, Claire and Lewandowski, Simon and
Dagras, Sabine and Payan, Denis Dynamic glass transition of filled
polysiloxane upon electron irradiation. (2017) Journal of
Non-Crystalline Solids, vol. 455. pp. 17-23. ISSN 0022-3093
Any correspondence concerning this service should be sent to the repository
administrator:
[email protected]
Dynamic glass transition of filled polysiloxane upon electron irradiation
A. Roggero
a, E. Dantras
a,⁎
, T. Paulmier
b, C. Tonon
c, S. Lewandowski
b, S. Dagras
c, D. Payan
daPhysique des Polymères CIRIMAT, Université de Toulouse, Université Paul Sabatier, 108 route de Narbonne, Bât. 3R1b2, 31062 Toulouse Cedex 9, France bONERA, The French Aerospace Lab, F-31055, France
cAirbus Defence and Space, 31 Avenue des Cosmonautes, 31402 Toulouse, France dCentre National d'Etudes Spatiales, 18 Avenue Edouard Belin, 31400 Toulouse, France
a b s t r a c t
The influence of radiation-induced crosslinking on the molecular mobility of a filled silicone elastomer near the glass transition (α-relaxation) was analyzed using broadband dielectric spectroscopy. Samples of the isolated polysiloxane matrix (neat) were also studied so as to assess the filler influence on the evolution of the α-relaxation.
A slowing-down of the segmental dynamics was observed with increasing ionizing dose. It was ascribed to the relaxing dipoles losing degrees of freedom as a result of network stiffening. An enhancement of intermolecular coupling, associated with the cooperativity of the α-relaxation, was deduced from the dielectric analysis. Similar observations were made in the past with chemically crosslinked polysiloxanes. This study evidenced that even though the crosslinks formed upon chemical crosslinking (mainly Si\\CH2\\CH2\\Si) differ in nature from those formed upon irradiation (mainly SiO3and SiO4), they affect the dynamic glass transition in a very similar
way.
The filler influence on the dynamic glass transition was also studied upon irradiation. One of the main outcomes of this study is the fading of the filler-related effect in the most irradiated samples: both the shape and dynamics of the α-relaxation were identical in the most highly irradiated neat and filled samples.
Keywords: Silicone elastomer Ionizing radiations Crosslinking Glass transition Molecular mobility Fillers 1. Introduction
This study is encompassed within the field of materials ageing in space environment. It is focused on a silicone elastomer used as an ad-hesive in solar panels bonded assemblies for communication satellites. In a previous study[1], the structural evolution of a space-used filled silicone elastomer exposed to high energy electrons was investigated. A preferential crosslinking process of the polysiloxane matrix was ob-served, involving the formation of SiO3bonds in the network. Moreover,
the inorganic fillers (silica and iron oxide) were shown to cause further radiation-induced crosslinking through the formation of SiO4bonds at
the filler-matrix interfaces. This additional crosslinking process resulted in an increase in mechanical modulus upon irradiation that was more pronounced in the filled samples than in the isolated matrix (neat sam-ples). On another hand, scanning calorimetry measurements showed no significant filler influence on the evolution of the glass transition temperature.
The α-relaxation of model linear PolyDiMethylSiloxane (PDMS)
[2–4]and PolyMethylPhenylSiloxane (PMPS)[5,6]has been studied
thoroughly, partly because neither secondary relaxations (they occur
at much lower temperatures) nor electrical conductivity (observed at higher temperatures) interfere with it. Broadband Dielectric Spectros-copy proved to be a particularly adequate tool for that purpose. Regard-ing three-dimensional polymer networks, multiple studies involvRegard-ing a variety of polymers[7–10]– including silicone networks[11,12]– led to the general conclusion that an increasing degree of crosslinking re-sults in a slowing-down of the α-relaxation dynamics, as well as a more pronounced deviation from Arrhenius behavior: crosslinked poly-mers tend to be more fragile than linear ones with the same backbone. In such studies, the degree of crosslinking is generally controlled chem-ically (i.e. by varying hardener proportion). Polyadditive crosslinking of the two components-RTV silicone rubbers mainly proceeds through the formation of silethylene links (Si\\CH2\\CH2\\Si)[13], while radiation-induced crosslinking primarily involves the formation of SiO3crosslinks
[1,14].
Silicone elastomers for space applications are filled with inorganic particles. Silica fillers are undoubtedly the most used as they enhance their mechanical properties[15]. Fillers incorporated in a polysiloxane matrix affect the α-relaxation: it is generally accepted that a polymer layer of reduced mobility (~ a few nm) is formed at the surface of the fillers[16]. The filler influence on the α-relaxation mainly depends on their geometry, relative quantity, and on their interactions with the matrix.
⁎ Corresponding author.
E-mail address:[email protected](E. Dantras).
The present study aims at assessing the influence of the crosslinks nature (chemical or radiation-induced) on the α-relaxation of a silicone elastomer. It will also bring insight in the filler influence on the dynamic glass transition throughout chemical ageing, which has not been stud-ied yet.
2. Materials and methods 2.1. Materials
The studied material is a commercial (Wacker) two components sil-icone elastomer which crosslinks at room temperature (RTV, Room Tem-perature Vulcanization). Part A mainly consists of a poly(dimethylsiloxane-co-methylphenylsiloxane) resin (approx. 35 wt%) mixed with crystalline silica (α-quartz particles of the glass splinter type, the size of which is comprised in the range [0.2–20 μm]) and iron(III) oxide (spherical particle size in the range [0.1–1 μm]) fillers. Part B is a hardener containing a Pt catalyst responsible for poly-merization. A filtering process performed on part A allowed separation and removal of the fillers from the resin. Consecutive polymerization with unmodified part B allowed the elaboration of neat samples (no fillers), as opposed to filled unmodified samples (with fillers).
The two components are manually mixed (weight ratio 9:1, accord-ing to data sheet) and poured into a mold consistaccord-ing of a 50 × 50 mm2
aluminum substrate the borders of which had been covered with alumi-num tape. Even though this material is able to crosslink at room temper-ature, a curing process of 6 h at 100 °C was performed after mixing in order to enhance sample reproducibility.
The glass transition temperature of both filled and neat materials were measured at −117 ± 1 °C, suggesting a low phenyl side groups content (the phenylmethylsiloxane mass fraction was estimated to be approximately 10%[17]).
2.2. Electron irradiations
Electron irradiations were performed under secondary vacuum in the SIRENE facility at ONERA[18]. The procedure and dose calculations are detailed elsewhere[1]and summarized here. 150 μm-thick elasto-mer films were irradiated using a 400 keV-Van de Graaff electron accel-erator along with a scattering foil in order to uniformly expose the sample surface. Ionizing doses up to 1.4 106 Gy were achieved in
b 12 h thanks to high beam currents in the order of 10 nA.cm−2. Ionizing dose D expressed in Grays (1 Gy = 1 J⋅kg−1
) is defined by Eq.(1). D ¼ Φ1 d dE dx ! " ð1Þ
where Φ is the particle fluence, d the material density and dE/dx the en-ergy lost by an incident particle by unit length travelled in the material. The samples irradiated in this way are uniformly aged and the indi-cated doses are mean values in the middle of the films.
2.3. Broadband dielectric spectroscopy
Broadband Dielectric Spectroscopy (BDS) measurements were per-formed isothermally in the frequency range [10−2
–106 Hz] on 150 μm-thick films placed between gold-plated stainless steel elec-trodes (30 mm diameter), using a Novocontrol BDS 4000 impedance analyzer.
Complex dielectric permittivities (Eq.(2)) were calculated from the experimental values of impedance.
ε$ð Þ ¼ εω 0ð Þ−iεω 00ð Þ ¼ω 1
iωC0Z$ð Þω ð2Þ
where ε′ is the real component of the complex dielectric permittiv-ity, ε″ its imaginary component, C0the capacitance in air and Z⁎ the
complex impedance.
The Havriliak-Negami parametric equation (see Eq.(3)) and the Schönhals-Schlosser model (see Eqs.(7a) and (7b)) were used to per-form the fits of the experimental data.
3. Results and discussion
First of all, in the ionizing dose range performed in this study, the crosslink densities of the materials were previously shown to be linearly increasing functions of absorbed ionizing dose[1], in agreement with Delides and Shepherd[19]who observed a linear increase of crosslink density up to 1.6 106
Gy of γ-rays in PDMS. In this section, the ‘ionizing dose’ abscissae in most of the figures are therefore proportionally linked to the ‘crosslink density’ of the samples.
3.1. Crosslinking-induced constraints on the α-relaxation
InFig. 1are represented the Broadband Dielectric Spectroscopy (BDS) loss spectra obtained at − 105 °C from pristine and irradiated filled samples. The glass transition manifests as a well-defined dielectric loss peak. This is mainly due to the absence of crystallization peak – hin-dered by both the crosslinks of the network and the phenyl side groups
[20] – and local segmental β-relaxation in the vicinity of the α-relaxation. With increasing ionizing dose, the maximum of the peak is shifted to lower frequencies, its intensity decreases, and its breadth increases.
The spectra inFig. 1were individually normalized to the coordinates of their respective maxima (fmax, ε″max). They are represented in the
inset ofFig. 1. The increase in the breadth of the peak is highlighted in the normalized spectra: the half-height width of the most irradiated sample is approximately 7 times larger than the pristine one. This broadening will be discussed in the subsection entitled “shape of the α-relaxation loss peak”.
In order to analyze the α-relaxation segmental dynamics, the BDS isothermal dielectric loss comprising the relaxation (such as those in
Fig. 1) were fitted using the Havriliak-Negami parametric equation[21]:
ε$¼ ε∞þ
εs−ε∞
1 þ iωτð H−NÞαH−N
# $βH−N ð3Þ
where εsand ε∞are respectively the low and high frequency limits of the
real relative permittivity, ω the angular frequency of the applied voltage, τH − Nthe mean relaxation time for the distribution of dipoles and αH − N
and βH − Nadjustment parameters in the range [0–1] respectively
con-trolling the breadth and the symmetry of the relaxation function. Thus obtained τH − Nare represented in the Arrhenius plot inFig. 2
for the pristine and irradiated filled samples. The mean relaxation times
Fig. 1. BDS loss spectra at −105 °C of filled samples exposed to various ionizing doses. Inset: same spectra normalized to their respective maxima.
of the α-relaxation increase with increasing ionizing dose, which is equivalent to the shifting of the α-peak towards lower frequencies as observed inFig. 1. As a result of network stiffening caused by increasing crosslink density, the relaxing dipoles lose degrees of freedom. In other words, the α-relaxation is progressively slowed down.
The relaxation times inFig. 2were very satisfactorily fitted with the Vogel-Fulcher-Tammann (VFT) law[22]: τ Tð Þ ¼ τVFT0 e B T−T∞ ð Þ¼ τVFT 0 e 1 α f T−T∞ð Þ ð4Þ
where τ0VFTis the pre-exponential factor, B a constant, αfthe thermal
ex-pansion coefficient of free volume and T∞the Vogel temperature (below
which there is no more free volume).
Various theoretical approaches (e.g. Adam-Gibbs model[23], free volume theory[25], coupling model by Ngai[24]) accounting for the VFT behavior of the α-relaxation exist. The free volume approach was chosen because it allows the interpretation of the VFT fit parameter B, as the reciprocal thermal expansion coefficient of free volume 1/αf
(see Eq.(4)). Before analyzing the evolution of the VFT fit parameters, the validity of the free volume approach was checked for the studied samples. Let aside the good mathematical match of the fit with the ex-perimental points for all the samples, two physical arguments support the use of the VFT law to fit the experimental data inFig. 2. The first one is the order of magnitude of the pre-exponential factor: 10−13
– 10−12s (seeFig. 3). Kremer and Schönhals reported that 10−13s is
the typical relaxation time of local orientational fluctuations in poly-mers[26]while Angell et al. considered the quasilattice vibration period (10−14 s) to be a physically acceptable value for the VFT
pre-exponential factor[27]. The second argument stems from the definition of the thermal expansion coefficient of free volume αfas the difference
between the material's thermal expansion coefficients above and below the glass transition temperature[25]. Thermomechanical measure-ments were performed on a pristine neat sample and yielded the linear thermal expansion below and above the glass transition temperature: 0.14 10−3K−1and 0.70 10−3K−1respectively. As the neat material is
homogeneous and isotropic, these values were multiplied by 3 to obtain the volumetric thermal expansion coefficients αvreported inTable 1.
The difference between αvabove and below Tgis 1.68 10 −3K−1,
which is in the same order of magnitude as αf= 1.56 10
−3K−1(see
Fig. 3), thus providing experimental validation of the definition of αf
and a satisfactory correlation between thermomechanical and dielectric spectroscopy measurements. Such correlation could not be verified for the filled material due to the important filler content causing heterogeneity.
As seen inFig. 3, the three VFT fit parameters increase linearly with respect to ionizing dose, for both the neat and filled materials. Schroeder and Roland[11]observed similar tendencies in chemically crosslinked PDMS networks. The evolutions of calorimetric Tgon one hand, τ0VFT
and especially T∞on the other hand, are coherent with increasing
crosslinking-induced constraints. The increase in αf, however, was not
expected as it qualitatively implies that while the network stiffens, free volume thermally expands more easily. Some insight might be given into this counterintuitive result by studying the cooperativity of the α-relaxation.
3.2. Influence of network crosslinking on the intermolecular coupling and the local motions of the α-relaxation
Two main contributions may account for the broadening of the α-relaxation loss peak (Fig. 1). One of them is the segmental heterogenization introduced by the new crosslinks: the segments closer to the crosslinks are expected to have lower mobilities than those far-ther, resulting in a larger distribution of relaxation times. The other one is intermolecular cooperativity, a characteristic feature of the glass transition in polymers: the individual segmental motions are influenced by the motions of neighboring segments.
3.2.1. Fragility evolution with respect to ionizing dose/crosslink density Tg-scaled plots were used by Angell[28]as a mean of classifying
glass formers depending on the deviation of the α-relaxation from Ar-rhenius behavior: strong liquids display ArAr-rhenius dependence while fragile ones exhibit pronounced VFT behavior. The fragility index m, de-fined as the derivative of log(τα) in order of Tg/T calculated at T = Tg
(Eq.(5)), m ¼ d log τð αÞ d T# g=T$ ! T¼Tg ð5Þ
where τα(T) = τH − N(T) is the mean dipole relaxation time, and Tgthe
calorimetric glass transition temperature, allows to quantify the devia-tion from Arrhenius behavior.
Fig. 2. Arrhenius plot of the Havriliak-Negami relaxation times associated with the α-relaxation of the filled material irradiated at various ionizing dose levels. Vogel-Fulcher-Tammann fits are represented in dashed lines.
Fig. 3. Evolution of the VFT fit parameters with respect to ionizing dose for the neat and filled materials.
Table 1
Volumetric thermal expansion coefficients in the vicinity of the glass transition tempera-ture (thermomechanical measurements) and thermal expansion coefficient of free vol-ume (VFT fit of BDS data) of the pristine neat material.
αv[10−3K−1] Δαv[10−3K−1] αf(free volume) [10−3K−1]
0.42 for T b Tg 1.68 1.56
Roland and Ngai[29]actually discussed the applicability of the term “fragility” to polymers, which do not experience a modification of their chemical structure when passing the glass transition, and suggested the fragility plots could be called “cooperativity plots” instead. The physical meaning of fragility in polymers has indeed been thoroughly discussed since the 1980s. Experimental and theoretical correlations with other parameters of the glass transition have been investigated, the most con-clusive of which was probably revealed by Böhmer et al.[30]. For a va-riety of amorphous polymeric materials, they evidenced a narrow correlation between fragility and nonexponentiality (that is the non-Debye nature of the relaxation). In 1979, Ngai developed the coupling model[24] which links the stretch exponent of the Kohlrausch– Williams–Watts associated with the α-relaxation to the strength of the intermolecular constraint. In this model, the shape of the relaxation function therefore varies according to the degree of cooperativity of the relaxation[31–35]. Under the light of the coupling model, the conclu-sion formulated by Böhmer et al. (fragility being correlated to nonexponentiality) suggests that fragility is to a great extent correlated to the cooperativity of the α-relaxation.
A cooperativity plot of the pristine and irradiated filled samples is represented inFig. 4. The temperature axis has been normalized to the calorimetric Tgof each sample. Given the estimated ±1 °C error on Tg,
the cooperativity plots of the irradiated samples were manually trans-lated so that they all intersected at Tg/T = 1. None of these adjustments
exceeded the uncertainty range of Tg. The VFT fits extrapolated towards
lower temperatures were represented inFig. 4instead of the data due to the experimental τH − Nbeing smaller than 1 s (seeFig. 2).
The Tg-scaled plot inFig. 4visually emphasizes the influence of
irra-diation on the temperature dependence of the relaxation times. Corre-sponding fragilities m were obtained by extracting the slope at Tg/
T = 1 from the cooperativity plots inFig. 4.
Fig. 5reports the evolution of fragility with respect to ionizing dose, for the neat and filled materials. The fragility of both the pristine sam-ples is approximately 111, which is in good agreement with existing lit-erature: m is generally about 100 in linear PDMS[4,11]as well as in linear PMPS[6,36]and values up to 110 were reported for PDMS elasto-mers[16]. These are high fragility values given the flexibility of the polysiloxane backbone that should lead to low fragilities. Kunal et al.
[37]explained these high fragilities in terms of side group stiffness rel-atively to the backbone, which is high in polysiloxanes regardless of the side groups being methyls or phenyls. Thus, the fragilities of PDMS and PMPS are approximately the same while PMPS has a higher Tgthan
PDMS due to the phenyl side groups being bulkier than the methyl ones. The fragility of both materials increases linearly with increasing ion-izing dose. This moderate fragility increase (~+16% for the highest dose level) suggests an increase in intermolecular coupling, leading to higher cooperativity of the α-relaxation as the polysiloxane network crosslinks. If these materials display high fragilities in their pristine state due to relative side groups/backbone stiffness (intramolecular
origin), the origin of their increasing fragility with crosslink density is intermolecular.
Schroeder and Roland[11]came to similar conclusions with chemi-cally crosslinked PDMS networks, which brings more insight into this study. In one hand, chemical crosslinking (polyaddition) of these two components-RTV silicone rubbers mainly proceeds through the forma-tion of silethylene links (Si\\CH2\\CH2\\Si)[13]. On the other hand, ionizing radiation-induced crosslinking of these materials primarily proceeds through the formation of SiO3bonds[1]. Therefore, the nature
of the crosslinks involved in the silicone network stiffening does not seem to have a significant impact on the evolution of the molecular mobilities.
3.2.2. The increase in the thermal expansion coefficient of free volume αf
Böhmer et al.[30]derived an expression of m in terms of the VFT fit parameters (Eq.(6)).
m ¼ DT∞=Tg
ln 10ð Þ 1−T∞
Tg
' (2 ð6Þ
where T∞is the Vogel temperature, Tgthe calorimetric glass transition
temperature and D the strength parameter related to the VFT parame-ters by DT∞= (αf)
−1.
Eq.(6)shows that m is proportional to D and therefore inversely proportional to αf. The observed increase in αf(seeFig. 3) seems
inco-herent with the increase in fragility observed inFig. 5. This apparent in-consistent behavior of αfstresses the complicated effect of T∞on
fragility. Two physical arguments accounting for the increase in αfare
proposed.
The general characteristic length scale (or equivalently size of coop-eratively rearranging regions) of the glass transition was estimated around 1–2 nm by Donth[38], i.e. much smaller than the distance be-tween crosslinks, even in the most crosslinked of samples. Therefore, stating that certain mobilities may be enhanced by crosslinking is not incompatible with the global network stiffening indicated by the in-creases in mechanical modulus (which is directly dependent on the density of crosslinks) on the rubber plateau and calorimetric Tg: for
in-stance, the appearance of rigid crosslinks may involve the disruption of prior physical bonding in between newly formed crosslinks.
Another possible physical origin of the apparent inconsistent behav-ior of αfresides in the evolution of side groups upon irradiation and
their role in free volume. As evidenced by Charlesby[39], silicone degra-dation upon irradiation mainly involves side groups scissions, resulting in H2, CH4and C2H6outgassing. At localized scale, the silicone backbone
mobility may be enhanced in the vicinity of a methyl side group that was either removed or degraded to a smaller form such as Si\\H. Addi-tionally, the phenyl side groups are particularly resistant to ionization (the ejection of an electron is compensated by the ring structure[40]). Thus expected increasing phenyl/methyl side groups ratio upon
Fig. 4. Cooperativity plot corresponding to the VFT fits inFig. 2.
irradiation is also coherent with the localized molecular mobility en-hancement due to the decrease in methyl side groups.
3.2.3. Shape of the α-relaxation loss peak
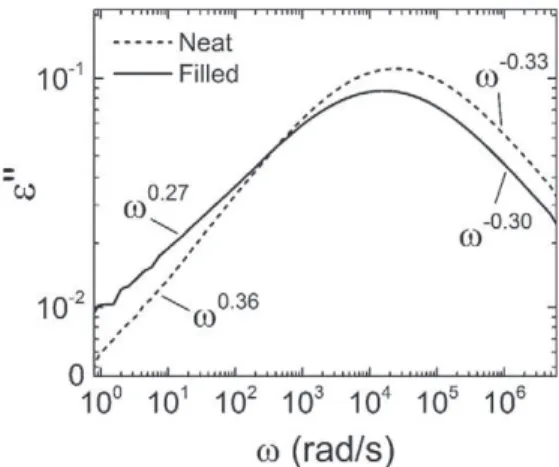
Schönhals and Schlosser[35]formulated a simple phenomenologi-cal model (Eqs.(7a) and (7b)) that consists in fitting with power laws of frequency the two sides of the dielectric loss peak associated with the dielectric manifestation of the glass transition. In this theoretical framework, the low-frequency exponent mS − Sis related to the
large-scale intermolecular correlations, while the high-frequency exponent nS − Sis associated with the small-scale, local motions of the network
segments.
ε00 ωð Þ ' ωmS−Swith 0bm
S−S≤1 for ω≪ω0 ð7aÞ
ε00 ωð Þ ' ω−nS−S
with 0bnS−S≤0:5 for ω≫ω0 ð7bÞ
where ω0is the angular frequency at which ε″ is maximum.
The analysis of the loss peak shape may equivalently be performed by means of the Havriliak-Negami adjustment parameters αH − Nand
βH − N, as mS − S= αH − Nand nS − S= αH − N.βH − N[7]. However,
in this study, power laws on both sides of the peak better fitted experi-mental data than the Havriliak-Negami equation, in particular for the points farther from the peak maximum.
As illustrated inFig. 6for the pristine neat and filled samples, the ex-ponents mS − Sand nS − Swere determined from the α-relaxation
di-electric loss peaks (not normalized) of the irradiated samples. The evolution of these shape parameters with respect to ionizing dose is represented inFig. 7.
As the crosslink density of the network increases, mS − Sdecreases
for both materials, but in a more pronounced manner in the neat case (−60% at the highest dose). Under the light of the Schönhals-Schlosser model, this decrease is associated with the promotion of large-scale in-termolecular coupling, or cooperativity. Bearing in mind the strong cor-relation between fragility and nonexponentiality evidenced in polymers by Böhmer et al.[30], the decrease in mS − Sis consistent with the
in-crease in fragility observed inFig. 5. Various authors came to similar conclusions by varying the crosslink density of polymer networks and analyzing the shape of the loss peak[8–10,41,42].
The high-frequency shape parameter nS − Salso decreases with
in-creasing ionizing dose, indicating that the segmental dynamics (intra-molecular diffusion processes) are slightly hindered by the crosslink densification. This evolution is in good agreement with studies of a po-lymerizing epoxy network[42]and heterocyclic polymer networks[8]
in both of which a less pronounced increase in nS − Sthan in mS − S
was observed with increasing crosslink density. On another hand,
there seem to be a contradiction with a study by Glatz-Reichenbach et al.[9]who observed a constant nS − Sregardless of the crosslink
den-sity of a styrene-butyl acrylate copolymer. This difference could be material-related but is more likely to originate from different crosslink density ranges: the high ionizing dose levels performed in this study may have allowed reaching higher crosslink densities than those in ref.[9].
3.3. Filler influence on the evolution of segmental motions under ionizing radiations
One of the most striking features ofFig. 7is the discrepancy in the evolutions of mS − Sin the two materials, when nS − Sis much less
influ-enced by the presence of fillers.
In the pristine state, mS − Sis lower in the filled sample than in the
neat one. This gap decreases as the crosslink density of the network in-creases, and the two materials display almost identical values of mS − S
at the highest ionizing dose level. On the contrary, neither the calori-metric Tg[1]nor the temperature dependence of the relaxation times
(VFT parameters,Fig. 3) nor the fragility (Fig. 5) are significantly im-pacted by the presence of fillers in the polysiloxane matrix. It therefore seems that, from the data at our disposal, only the loss peak shape pa-rameters bring to light the filler influence on the α-relaxation of this material.
Three main interpretation schemes may account for this inhomoge-neous broadening of the α-relaxation towards the low frequencies as a consequence of fillers incorporation and the evolution under ionizing radiations.
Hydrogen bonding evidenced at the interface between the silica fillers and the polysiloxane network[1]could result in cooperativity en-hancement of the large-scale motions. Upon irradiation, the H-bonds are progressively replaced with chemical crosslinks (SiO4) which also
promote cooperativity of the α-relaxation, therefore resulting in further decrease of the exponent mS − S. In the neat material, the absence of
filler-related H-bonds in the pristine state results in a more pronounced decrease in mS − Supon irradiation.
Secondly, a parallel may be drawn with the asymmetrical broaden-ing of the α-relaxation loss peak of semicrystalline polymers as com-pared to the amorphous state. For instance, Hensel et al.[43]observed a significant broadening of the low-frequency side (equivalent to de-creasing mS − S) of the dielectric loss peak while the high-frequency
side of the peak remained unaltered (equivalent to unchanged nS − S).
They ascribed this asymmetry to geometrical confinement caused by the crystallites. On one hand, this confinement is effective on large-scale motions as their characteristic length is similar to the distance
Fig. 6. Dielectric loss peak at −105 °C for pristine neat and filled samples, and illustration of the Schönhals-Schlosser model with indication of the mS − Sexponents on the left, and
of the nS − Sexponents on the right.
Fig. 7. Evolution of the Schönhals-Schlosser shape parameters mS − Sand nS − Swith
between crystallites. On the other hand, the lengths associated with high-frequency local motions are negligible compared to the distance between crystallites. In the filled silicone elastomer, the inorganic fillers could induce geometrical confinement in a similar way.
A third interpretation could account for the inhomogeneous broad-ening of the α-relaxation due to the incorporation of fillers in the ma-trix. Fragiadakis et al.[44]evidenced a second α’-relaxation in a PDMS
elastomer reinforced with nanometric silica fillers. This second peak at higher temperatures/lower frequencies was associated with a polymer layer (2–3 nm-thick) of reduced mobility located at the interface with the fillers. In the present study, the fillers are not nanometric and very distributed in size, which would not allow the observation of a distinct second peak but could account for the broadening of the main α-relaxation peak towards the low frequencies.
Regardless of the interpretation scheme adopted, the highly irradiat-ed samples are similar when it comes to the asymmetrical broadening of the α-relaxation. This means that the crosslinking-induced mechan-ical constraints applied to the polysiloxane matrix dominate the relaxa-tion behavior of these samples. In other words, the presence of fillers no more has impact on the large-scale cooperative motions of the network. 4. Conclusion
This study aimed at analyzing the influence of radiation-induced chemical ageing on the molecular mobility of a filled silicone elastomer. Complementary representations and fits of the experimental dielectric loss measured in broadband dielectric spectroscopy led to the following conclusions.
The radiation-induced crosslinking of the polysiloxane matrix re-sulted in a slowing-down of the α-relaxation dynamics, as evidenced by the shifting of the dielectric loss peak towards lower frequencies (equivalent to an increase in the mean dipole relaxation times) and by the increase in the Vogel-Fulcher-Tammann fit parameters with in-creasing ionizing dose. This slowing-down was accompanied with an inhomogeneous broadening of the dielectric loss peak. The two sides of the loss peak were successfully fitted with power laws of frequency, the exponents of which indicated a greater increase of the low-frequency side as compared to the high-low-frequency side. In the frame-work of the Schönhals-Schlosser model, this asymmetrical broadening was attributed to cooperative intermolecular motions enhancement (low frequencies) as well as a slight hindrance of intramolecular local motions (high frequencies). The increase in cooperativity was also evi-denced by an increase in fragility upon irradiation. An apparent incon-sistent increase in the thermal expansion coefficient of free volume was also observed, which could be due to the promotion of certain mobilites in between the newly formed crosslinks (possibly involving the disruption of prior physical bonding) and/or a consequence of an in-creasing phenyl/methyl side groups ratio.
This study evidenced that while chemically produced (mainly Si\\CH2\\CH2\\Si) and radiation-induced crosslinks (mainly SiO3)
have different nature, they influence the dynamic glass transition of sil-icone in a very similar way.
Another main outcome of this study is related the filler influence on the radiation-induced evolution of the α-relaxation. Neither the mean relaxation times nor the Vogel-Fulcher-Tammann fit parameters nor the fragility were affected by the presence of fillers in the matrix. How-ever, a significant discrepancy was observed on the low-frequency ex-ponent of the dielectric loss peak. In the pristine filled sample, the loss peak was broader and more asymmetrical towards low frequencies than in the pristine neat sample. With increasing crosslinking density, this discrepancy progressively reduced to the extent that the most irra-diated samples showed negligible differences in the shape of the loss peak. Three interpretation schemes were discussed to explain this re-markable behavior: cooperativity enhancement due to hydrogen bond-ing, filler-related geometrical confinement and immobilized polymer layer at the filler-matrix interfaces. Regardless of the interpretation
scheme, it seems that the crosslinking-related mechanical constraints generated in the polysiloxane matrix dominate the relaxation behavior of the filled material at high doses, that is in the highly crosslinked samples.
References
[1] A. Roggero, E. Dantras, T. Paulmier, C. Tonon, S. Dagras, S. Lewandowski, D. Payan, Inorganic fillers influence on the radiation-induced ageing of a space-used silicone elastomer, 2016. Polym. Degrad. Stab. 128 126–133, ,http://dx.doi.org/10.1016/j. polymdegradstab.2016.03.010.
[2] H. Adachi, K. Adachi, Y. Ishida, T. Kotaka, Dielectric relaxation of polydimethylsilox-ane, 1979. J. Polym. Sci. Polym. Phys. Ed. 17 851–857, ,http://dx.doi.org/10.1002/pol. 1979.180170510.
[3] K.U. Kirst, F. Kremer, V.M. Litvinov, Broad-band dielectric spectroscopy on the mo-lecular dynamics of bulk and adsorbed poly(dimethylsiloxane), 1993. Macromole-cules 26 975–980, ,http://dx.doi.org/10.1021/ma00057a015.
[4] C.M. Roland, K.L. Ngai, Segmental relaxation in poly(dimethylsiloxane), 1996. Mac-romolecules 29 5747–5750, ,http://dx.doi.org/10.1021/ma960045d.
[5] D. Boese, B. Momper, G. Meier, F. Kremer, J.U. Hagenah, E.W. Fischer, Molecular dy-namics in poly(methylphenylsiloxane) as studied by dielectric relaxation spectros-copy and quasielastic light scattering, 1989. Macromolecules 22 4416–4421, ,
http://dx.doi.org/10.1021/ma00202a005.
[6] S. Pawlus, S.J. Rzoska, J. Ziolo, M. Paluch, C.M. Roland, Effect of temperature and pres-sure on segmental relaxation in polymethylphenylsiloxane, 2003. Rubber Chem. Technol. 76 1106–1115, ,http://dx.doi.org/10.5254/1.3547790.
[7] E. Schlosser, A. Schönhals, Dielectric relaxation in polymer solids part 2: application of the new model to polyurethane systems, 1989. Colloid Polym. Sci. 267 133–138, ,
http://dx.doi.org/10.1007/BF01410351.
[8] V.Y. Kramarenko, T.A. Ezquerra, I. Šics, F.J. Baltá-Calleja, V.P. Privalko, Influence of cross-linking on the segmental dynamics in model polymer networks, 2000. J. Chem. Phys. 113 447, ,http://dx.doi.org/10.1063/1.481809.
[9] J.K.W. Glatz-Reichenbach, L. Sorriero, J.J. Fitzgerald, Influence of crosslinking on the molecular relaxation of an amorphous copolymer near its glass-transition tempera-ture, 1994. Macromolecules 27 1338–1343, , http://dx.doi.org/10.1021/ ma00084a010.
[10] C.M. Roland, Constraints on local segmental motion in poly(vinylethylene) net-works, 1994. Macromolecules 27 4242–4247, , http://dx.doi.org/10.1021/ ma00093a027.
[11] M.J. Schroeder, C.M. Roland, Segmental relaxation in end-linked poly(dimethylsilox-ane) networks, 2002. Macromolecules 35 2676–2681, ,http://dx.doi.org/10.1021/ ma011678h.
[12] B.D. Fitz, J. Mijovic, Segmental dynamics in poly(methylphenylsiloxane) networks by dielectric relaxation spectroscopy, 1999. Macromolecules 32 3518–3527, ,
http://dx.doi.org/10.1021/ma981937b.
[13] F. de Buyl, Silicone sealants and structural adhesives, 2001. Int. J. Adhes. Adhes. 21 411–422http://dx.doi.org/10.1016/S0143-7496(01)00018-5.
[14] D.J. Hill, C.M. Preston, A.K. Whittaker, NMR study of the gamma radiolysis of poly(dimethyl siloxane) under vacuum at 303 K, 2002. Polymer (Guildf). 43 1051–1059, ,http://dx.doi.org/10.1016/S0032-3861(01)00711-X.
[15] L. Bokobza, Elastomeric composites. I. Silicone composites, 2004. J. Appl. Polym. Sci. 93 2095–2104, ,http://dx.doi.org/10.1002/app.20684.
[16] P. Klonos, A. Panagopoulou, L. Bokobza, A. Kyritsis, V. Peoglos, P. Pissis, Comparative studies on effects of silica and titania nanoparticles on crystallization and complex segmental dynamics in poly(dimethylsiloxane), 2010. Polymer (Guildf). 51 5490–5499, ,http://dx.doi.org/10.1016/j.polymer.2010.09.054.
[17] K.E. Polmanteer, Current perspectives on silicone rubber technology, Rubber Chem. Technol. 54 (1981) 1051–1080.
[18] T. Paulmier, B. Dirassen, D. Payan, M. Van Eesbeek, Material charging in space envi-ronment: experimental test simulation and induced conductive mechanisms, 2009. IEEE Trans. Dielectr. Electr. Insul. 16 682–688, ,http://dx.doi.org/10.1109/TDEI.2009. 5128506.
[19] C.G. Delides, I.W. Shepherd, Dose effects in the crosslinking of irradiated polysiloxane, 1977. Radiat. Phys. Chem. 10 379–385, ,http://dx.doi.org/10.1016/ 0146-5724(77)90047-4.
[20] D.W. McCarthy, J.E. Mark, S.J. Clarson, D.W. Schaefer, Synthesis, structure, and prop-erties of hybrid organic-inorganic composites based on polysiloxanes. II. Compari-sons between poly(methylphenylsiloxane) and poly(dimethylsiloxane), and between titania and silica, 1998. J. Polym. Sci. B Polym. Phys. 36 1191–1200, ,
http://dx.doi.org/10.1002/(SICI)1099-0488(199805)36:7b1191::AID-POLB8N;2-X. [21] S. Havriliak, S. Negami, A complex plane analysis of α-dispersions in some polymer
systems, 1966. J. Polym. Sci., Part C: Polym. Symp. 14 99–117, ,http://dx.doi.org/10. 1002/polc.5070140111.
[22] (a) H. Vogel, The law of the relation between the viscosity of liquids and the tem-perature, Phys. Z. 22 (1921) 645–646;
(b) G.S. Fulcher, Analysis of the recent measurements of the viscosity of glasses, 1925. J. Am. Ceram. Soc. 8 339–355, ,http://dx.doi.org/10.1111/j.1151-2916. 1925.tb16731.x;
(c)G. Tammann, W. Hesse, Die abhängigkeit der viscosität von der temperatur bie unterkühlten flüssigkeiten, Z. Anorg. Allg. Chem. 156 (1926) 245–257.
[23] G. Adam, J.H. Gibbs, On the temperature dependence of cooperative relaxation prop-erties in glass-forming liquids, 1965. J. Chem. Phys. 43 139, ,http://dx.doi.org/10. 1063/1.1696442.
[24] K.L. Ngai, Universality of low-frequency fluctuation, dissipation, and relaxation properties of condensed matter. I, comments, Solid State Phys. 9 (1979) 127–140.
[25] M.H. Cohen, D. Turnbull, Molecular transport in liquids and glasses, 1959. J. Chem. Phys. 31 1164, ,http://dx.doi.org/10.1063/1.1730566.
[26] F. Kremer, A. Schönhals, The scaling of the dynamics of glasses and supercooled liq-uids, 2003. in: F. Kremer, A. Schönhals (Eds.), Hill, Springer-Verlag, Berlin 2003, pp. 99–129, ,http://dx.doi.org/10.1007/978-3-642-56120-7_4.
[27] C.A. Angell, K.L. Ngai, G.B. McKenna, P.F. McMillan, S.W. Martin, Relaxation in glassforming liquids and amorphous solids, 2000. J. Appl. Phys. 88 3113, ,http:// dx.doi.org/10.1063/1.1286035.
[28] C. Angell, Relaxation in liquids, polymers and plastic crystals — strong/fragile pat-terns and problems, 1991. J. Non-Cryst. Solids 131–133 13–31, ,http://dx.doi.org/ 10.1016/0022-3093(91)90266-9.
[29] C.M. Roland, K.L. Ngai, Segmental relaxation and molecular structure in polybutadi-enes and polyisoprene, 1991. Macromolecules 24 5315–5319, ,http://dx.doi.org/10. 1021/ma00019a016.
[30] R. Böhmer, K.L. Ngai, C.A. Angell, D.J. Plazek, Nonexponential relaxations in strong and fragile glass formers, 1993. J. Chem. Phys. 99 4201, ,http://dx.doi.org/10. 1063/1.466117.
[31] A. Schönhals, Molecular dynamics in polymer model systems, in: F. Kremer, A. Schönhals (Eds.), Broadband Dielectr. Spectrosc, Springer-Verlag, Berlin 2003, pp. 225–293.
[32] I.M. Hodge, Effects of annealing and prior history on enthalpy relaxation in glassy polymers. 4. Comparison of five polymers, 1983. Macromolecules 16 898–902, ,
http://dx.doi.org/10.1021/ma00240a013.
[33] K.L. Ngai, C.M. Roland, Chemical structure and intermolecular cooperativity: dielec-tric relaxation results, 1993. Macromolecules 26 6824–6830, ,http://dx.doi.org/10. 1021/ma00077a019.
[34] L.A. Dissado, R.M. Hill, A cluster approach to the structure of imperfect materials and their relaxation spectroscopy, 1983. Proc. R. Soc. Lond. A Math. Phys. Sci. 390 131–180, ,http://dx.doi.org/10.2307/2397657.
[35] A. Schönhals, E. Schlosser, Dielectric relaxation in polymeric solids part 1. A new model for the interpretation of the shape of the dielectric relaxation function, 1989. Colloid Polym. Sci. 267 125–132, ,http://dx.doi.org/10.1007/BF01410350. [36] D.J. Plazek, K.L. Ngai, Correlation of polymer segmental chain dynamics with
temperature-dependent time-scale shifts, 1991. Macromolecules 24 1222–1224, ,
http://dx.doi.org/10.1021/ma00005a044.
[37] K. Kunal, C.G. Robertson, S. Pawlus, S.F. Hahn, A.P. Sokolov, Role of chemical struc-ture in fragility of polymers: a qualitative picstruc-ture, 2008. Macromolecules 41 7232–7238, ,http://dx.doi.org/10.1021/ma801155c.
[38] E. Donth, The size of cooperatively rearranging regions at the glass transition, 1982. J. Non-Cryst. Solids 53 325–330, ,http://dx.doi.org/10.1016/0022-3093(82)90089-8. [39] A. Charlesby, Changes in silicone polymeric fluids due to high-energy radiation, 1955. Proc. R. Soc. A Math. Phys. Eng. Sci. 230 120–135, ,http://dx.doi.org/10. 1098/rspa.1955.0116.
[40] A.S. Palsule, S.J. Clarson, C.W. Widenhouse, Gamma irradiation of silicones, 2008. J. Inorg. Organomet. Polym. Mater. 18 207–221, , http://dx.doi.org/10.1007/s10904-008-9205-0.
[41] C.M. Roland, K.L. Ngai, D.J. Plazek, The viscoelastic behaviour of networks, 1997. Comput. Theor. Polym. Sci. 7 133–137, , http://dx.doi.org/10.1016/S1089-3156(97)00016-0.
[42] R. Casalini, A. Livi, P.A. Rolla, G. Levita, D. Fioretto, Self-similarity of dielectric relax-ation and conductivity in cross-linking systems, 1996. Phys. Rev. B 53 564–568, ,
http://dx.doi.org/10.1103/PhysRevB.53.564.
[43] A. Hensel, J. Dobbertin, J.E.K. Schawe, A. Boller, C. Schick, Temperature modulated calorimetry and dielectric spectroscopy in the glass transition region of polymers, 1996. J. Therm. Anal. Calorim. 46 935–954 .http://www.akademiai.com.sci-hub. org/doi/abs/10.1007/BF01983612(accessed June 17, 2015).
[44] D. Fragiadakis, P. Pissis, Glass transition and segmental dynamics in poly(dimethyl-siloxane)/silica nanocomposites studied by various techniques, 2007. J. Non-Cryst. Solids 353 4344–4352, ,http://dx.doi.org/10.1016/j.jnoncrysol.2007.05.183.
![Fig. 1 ) were fitted using the Havriliak-Negami parametric equation [21] :](https://thumb-eu.123doks.com/thumbv2/123doknet/3050030.86025/3.892.507.772.865.1074/fig-fitted-using-havriliak-negami-parametric-equation.webp)