O
pen
A
rchive
T
OULOUSE
A
rchive
O
uverte (
OATAO
)
OATAO is an open access repository that collects the work of Toulouse researchers and makes it freely available over the web where possible.This is an author-deposited version published in : http://oatao.univ-toulouse.fr/
Eprints ID : 18788
The contribution was presented at MABS 2016 :
https://sites.google.com/site/mabsworkshop2016/
To cite this version : Philippon, Damien and Choisy, Marc and Drogoul, Alexis and Gaudou, Benoit and Marilleau, Nicolas and Taillandier, Patrick and Truong, Chi Quang Exploring trade and health policies influence on Dengue spread with an Agent-Based Model. (2017) In: 17th International Workshop on Multi-Agent-Based Simulation (MABS 2016) at AAMAS 2016, 9 May 2016 - 10 May 2016 (Singapore, Singapore).
Any correspondence concerning this service should be sent to the repository administrator: [email protected]
Exploring Trade and Health Policies Influence
on Dengue Spread with an Agent-Based Model
Damien Philippon1(B), Marc Choisy2,3, Alexis Drogoul1, Benoit Gaudou4,
Nicolas Marilleau1, Patrick Taillandier5, and Quang Chi Truong1,6,7
1
UMI 209 UMMISCO, IRD, Bondy, France
[email protected], [email protected], [email protected]
2
UMR 34394 MIVEGEC, IRD, Montpellier, France [email protected]
3
Oxford University Clinical Research Unit (OUCRU), Hanoi, Vietnam 4
UMR 5505 IRIT, CNRS, University Toulouse 1 Capitole, Toulouse, France [email protected]
5
UMR IDEES, University of Rouen, Rouen, France [email protected]
6
CENRES and DREAM Team, Can Tho University, Can Tho, Vietnam [email protected]
7
PDIMSC, University Pierre and Marie Curie/IRD, Paris, France
Abstract. With the globalization, several free trade areas have been and are being created all around the world. They usually have positive con-sequences for increasing economic exchanges, but negative ecological or health side effects. These negative effects are difficult to predict or even to understand due to the complexity of the system and of the number of involved processes. In this article, we focus on the Southeast Asia free trade area (the ASEAN) and specifically in the East-West economic corridor. A significant correlation has been observed in this area between the corridor opening and dengue fever cases, without being able to establish a causal-ity relationship. We choose to tackle this issue by building an agent-based geographically explicit model. We propose an approach coupling dengue fever dynamics, climate data, economic mobility and health policies, fol-lowing a design methodology decomposing these processes in sub-models and linking them to make one integrated model. In addition, we propose a way to deal with lack of data in the modeling process. Our simulation results show that there is influence of the increase in mobility and appli-cation of different control policies on the increase of dengue cases.
Keywords: Agent-based model
·
Epidemiological model·
GIS data·
Health policy1
Introduction
Small countries have been forced to create associations or unions to compete in the international marketplace, because of globalization. The first goal of these
associations is to represent the countries as a unique economical area. To sym-bolize their union, the associations open free trade areas which help promot-ing internal trade by improvpromot-ing, for instance, their infrastructures or reducpromot-ing taxes. Although these associations reach their goals of increasing good exchanges between countries, they also bring collateral effects that do not necessarily con-cern economy directly.
We chose to focus on the East-West Economic Corridor (EWEC) crossing Myanmar, Thailand, Laos and Vietnam, as it is a relatively small area with a lot of countries, different cultures but has also a strong economical trade area. A correlation link has been observed between the improvement of such infrastruc-tures, by increasing the trade between countries and the number of dengue fever cases (cf. Fig.1). Dengue is wide spread in Southeast Asia and a huge economic burden for the countries which fight it with heterogeneous policies. We chose to use an Agent-Based Model (ABM) to represent the problem, as it could offer the possibility to assess policies to combat dengue in silico, thus not interfering on the real environment without having a clear idea of the impacts that such policy may cause.
The contribution of this article is twofold. First, it presents a design method-ology to build a complex model involving processes at different time and space scales in a context of limited available data. To deal with this shortage of data, we had to cross geographical data and epidemiological reports (to get dengue fever incidence by province, month and year) and scientific and institutional reports to estimate policies applied by countries. The proposed model combines an equation-based model for the disease dynamics, an individual microscopic mobility model and a policy application model at the country scale. Second, it presents a summary of the implemented model and discusses its results and its validation.
This paper is organized as follows. Section2 presents the context of the case study with the presentation of the Association of Southeast Asian Nations (ASEAN) and of the EWEC corridor, a presentation of the dengue fever and and the different control policies employed to combat the mosquitoes in these differ-ent countries. Section3 presents the methodology used, in particular concerning the collection of data and the implementation of the model. Section4 is focused on the model itself, described using the O.D.D. Protocol [5]. Section5 shows the results obtained and discusses them. At last Sect.6 concludes and proposes some perspectives.
2
Context
2.1 ASEAN
ASEAN is composed of 10 countries of Southeast Asia including Indonesia, Thailand, Brunei, Cambodia, Lao PDR, Malaysia, Philippines, Myanmar, Sin-gapore and Vietnam. This association aims at accelerate the economic growth and social progress of the concerned countries. The first plan was to establish a common internal market by promoting free trade, respecting agreements and
collaborations. From this plan, different urbanisation projects between countries have been developed; one of them is the construction or improvement of economic corridors. In this study we are interested in the East West Economic Corridor, a corridor with its concept agreed in 1992 [12], built to promote the development of Myanmar, Thailand, Lao PDR and Vietnam and based on 1450 km of roads from Mawlamayine (Myanmar) to Da Nang (Vietnam). The corridor initially facili-tates mainly the economy of the concerned countries, with new roads facilitating the transport of resources from one city to another along or near the corridor. But with the development of the corridor and the growth of trade among these countries (opening of the EWEC corridor the 12th December 2006), a collateral unwanted effect appeared: as the trade inside the corridor increased, so did the number of dengue fever cases. A correlation link have been made between these two data series but causality has not been proved yet (Fig.1).
Fig. 1.Dengue cases and trade in the corridor.
2.2 Dengue Fever
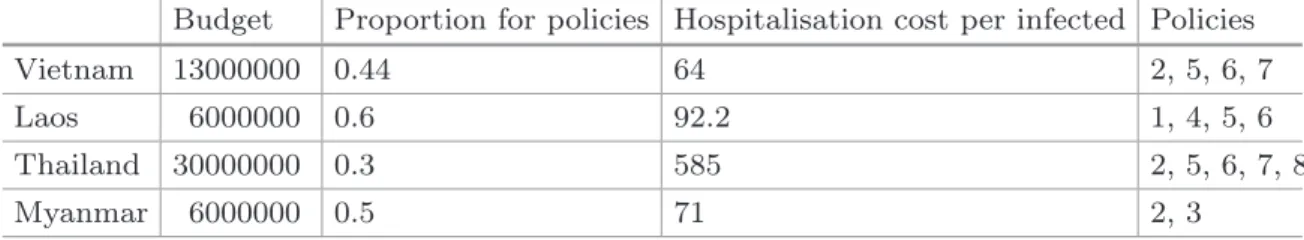
The dengue fever is a disease which has an important incidence in the Asia Pacific: 75% of the world-wide population exposed to the dengue fever live in this area [9] (cf. Fig.2). In the ASEAN, the number of cases has increased year after year over the last 10 years. This disease is a vector-borne disease, which means that its spread is only possible thanks to an organism, and in this case, two mosquito species: the aedes albopictus (a rural mosquito species) and the aedes aegypti (an urban mosquito species). An Infected mosquito bites a susceptible human being, which will lead to his/her infection. But human beings are also an infection source for the mosquitoes: an infected human being bitten by a susceptible mosquito will lead to its infection too.
The symptoms of the dengue fever are high fever, headache, pain behind the eyes, muscle and joint pains, nausea, vomiting, rash, and last for 2 to 7 days. But the real problems come with the severe dengue which can develop dengue shock syndrome in 30% of cases and is lethal in 20% of the cases (but only 1%
Fig. 2. Boosted Regression Trees (BRT) model probability of occurrence map. Map predicted at a 5 km × 5 km resolution with exclusion criteria [2].
with hospital treatment). As 90% of severe dengue cases affect children under 15 years old [7], the severe dengue is a worrying problem.
So countries are facing a social but also an economic problem, as the dengue fever affects also workers, preventing them to work from two to three weeks. An outbreak can paralyze the country economy for a long period, but also have an economic impact because of the extraordinary activity of hospitals and the losses caused by the work stop. In Thailand, the economic cost of a dengue case is 731.10 USD for direct costs like medical costs and 62.5 USD for indirect costs [11].
To avoid epidemics and the increase of the number of dengue cases, countries have employed several different control polices.
2.3 Health Policies
Health Policies or Control Policies denote all strategic choices of private (and in particular Non-Governmental Organisations (NGOs)) and public organisms aim-ing at improvaim-ing health conditions of populations from whom they are responsi-ble. A lot of existing Health Policies (cf. Fig.3 for some examples) are available for countries with more or less efficiency and lower and higher cost depending on the area and population. Each country should make a trade-off between their budget, the cost of these policies and their effect on the population and on the disease spread. In the context of the dengue fever, Health Policies can be vector-control policies, which will, for example, reduce the number of mosquitoes in an area. They can also try to improve the Prevention and Education and tend to decrease the probability of being infected for the human population by putting mosquito nets, using repellents or simply advising population to wear long sleeve shirts.
Policies are not limited to cure and prevention systems, but include also anti-vector systems (cf. Fig.3). We can consider four main kinds of anti-vector health policies: killing adult mosquitoes, preventing the breeding sites or killing larvae, preventing mosquito bites and preventing the virus transmission. All of these
Fig. 3. Health policies available against dengue fever: guppy fishes to kill larvae, pes-ticide to kill adults or vaccine to prevent human infection...
Health Policies have the same goal: fighting against the dengue fever; however they use different means: killing adult mosquitoes relies more on pesticide, while reducing the number of mosquito bites relies on mosquito nets or on repellents. Whereas all the means are more or less available to each country, real dif-ferences can be observed between countries in applied policies: for instance, in Asia, it is unthinkable to put chemicals inside the water tank, whereas in South America, it is unthinkable to put guppy fishes (a fish eating larvae) inside water tanks [6]. In the EWEC, there are two main causes for the differences in terms of policies applied. The first one is the kind of larvae breeding sites. In rural countries like Laos and Vietnam, the breeding sites correspond to water-holding containers, jars, which allow biological control by using fishes or mesocyclops when it is allowed and accepted by the communities. In urbanized areas, the breeding sites are flower pots, water dispenser troughs or even gutters, which do not allow application of policies like in rural areas. The second reason is the climate of each country. Southeast Asia proposes a large diversity of climates and each of them can increase or reduce the effects of a policy: in Vietnam, the mesocyclops coupled with bacteria killing larvae are showing better results than in Laos and Cambodia, where the guppy fish is more effective [6].
3
Methodology
3.1 Implementation of the Model
We chose to implement an ABM as it appears to be a good choice when we want to couple models from different domains. In our case, we are interested in
the dynamics of a disease spreading (the dengue fever), trucks mobility among the EWEC corridor and the application of policies by countries. We thus couple Geographic Information System (GIS) Data (for the countries and meteorolog-ical stations) with epidemiologmeteorolog-ical model (and data). We finally superimpose the policies dimension on the coupled model of those two previous ones. The decision and application of policies by a country (if it is included in its budget) are complex mechanisms as they depend on different parameters such as the geographical situation or the importance of the outbreak.
During the model’s design and at each step of their implementation, epidemi-ologists were invited to validate the dynamics of the dengue fever. A difficulty we had to face was the implementation of a vanilla model, without any policies applied on the corridor and the validation of this model before applying the different policies.
The models have been developed using the GAMA Platform [4], a modeling and simulation development environment for building spatially explicit agent-based simulations. The GAMA Platform eases the integration of geographical data in a model and the creation of models in any kind of field. We choose this platform because it will make easier the launching of simulation with dif-ferent geographical data: for instance, the model developed concerns the East West Economic Corridor, but the geographical files can be replaced by ones of another corridor, like the China-Pakistan economic corridor. The platform also makes possible the development and maintenance of submodels with different paradigms using different levels of abstraction like ODE, which is exactly in what we are interested in, and which is not easily done with its direct contender NetLogo [13].
3.2 Empirical Data
Building this model has required economical, epidemiological, meteorological, geographical data but also data about the different health policies used.
We get the economic data (i.e. exportation in dollars for each country with the other ones) and convert it into a number of trucks passing through the borders by giving a value in dollar to trucks. We make the assumption that those countries only exchange using terrestrial ways. This assumption comes from the idea that both maritime and aerial ways are used to exchange with other countries like China, but not for the countries in which we are interested. The destination of the truck always is a city, and the probability of this city to be chosen over the others depend on the population of the city. All these data were available on the website of the ministries of trade of the different countries. They are stored in a CSV file, with for each country its probability of export to another country of the corridor, its export budget and its economic growth for 2004 (Table1).
The epidemiological data were provided by different ministries of health and contain the number of cases recorded by province, by month and by year. They are used to initialize the model. We use the incidence of the dengue fever of January, 2004 to initialize the model, mainly because it is a year in which we
Table 1. Probabilities of exportation for each country Vietnam Laos Thailand Myanmar Vietnam 0 0.12 0.86 0.02
Laos 0.33 0 0.66 0.01
Thailand 0.6 0.21 0 0.19 Myanmar 0.02 0.01 0.97 0
have data and it is before the opening of the corridor. An important point is that the data from Myanmar were not available.
The meteorological data were obtained from the website Climate-data.org1.
This website provides information about different meteorological stations, recording temperature and rainfall by month. These data were used to com-pute the climate in the different cells of the cellular automata and are used in the emergence function of mosquitoes. We use the climate data of 2004.
The geographical shapefile data of the different countries, provinces, districts, cities and roads of the corridor come from OpenStreetMap website2. They
rep-resent 4 countries, 22 provinces and an area of 1500 km by 400 km (Fig.4).
Fig. 4. Geographical representation of the Corridor with countries (yellow), provinces (green), districts (purple), cities (circles), weather stations (triangles) and the road. (Color figure online)
The data about the different policies (see Table2) are more qualitative: they come from different articles and studies (mainly Community Based Dengue Vec-tor Control [6]). Each policy will have effect on simplified parameters:
– Emergence of mosquitoes for policies which kill larvae (Environment manage-ment, Guppy fishes, BTI Briquets),
1
http://climate-data.org. 2
Table 2. List of the different policies possible Id Name of the Policy Description
1 No policy No policy will be applied
2 BTI briquets Chemicals used to kill larvae inside water tanks 3 Natural predation Guppy fishes are used inside water tanks to eat
larvae
4 Natural preservation Protection of the environment and the natural predators of the mosquitoes
5 Botanicals Plants used to kill the mosquitoes
6 Mosquito nets Nets used to prevent the mosquitoes from entering or biting people
7 Education Formation, advertisements to inform people (removing water from pots for instance) 8 Environment management Removing stagnant water sites near houses 9 Vaccines Using the vaccination to immunize people from
dengue
10 Insecticides Aerosols used to kill adult mosquitoes 11 Genetically modified mosquitoes Sterile male mosquitoes used to mate female
mosquitoes
12 Ovitraps Traps used to trap female mosquitoes and kill its eggs once layed inside the trap
– Population of mosquitoes for policies killing adult mosquitoes (insecticides, natural predation),
– Biting Rate for policies reducing the probability of being bitten by a mosquito (mosquito nets, long sleeves shirts),
– Transmission probability for policies reducing the probability of transmission (vaccination).
We estimate the budget allocated by each country to health policies consid-ering the budget for public health policies (See Table3).
Table 3.Health budget, rate between policy application and hospitalisation coverage, and policies applied by each country
Budget Proportion for policies Hospitalisation cost per infected Policies
Vietnam 13000000 0.44 64 2, 5, 6, 7
Laos 6000000 0.6 92.2 1, 4, 5, 6
Thailand 30000000 0.3 585 2, 5, 6, 7, 8
4
Model
We present the model following the basic steps of the O.D.D. protocol [5]. Due to space limitation, we restrict ourselves to main parts of the protocol only. 4.1 Purpose
The aim of this model is to reproduce the dengue spread at the scale of the ASEAN East-West Economic corridor given the increase of trades between coun-tries and provinces thanks to the corridor opening. We also aim at investigating the impact of the countries control policies.
4.2 Entities, Variables and Scales
As presented in Sect.3.2, the considered reference system is an area of approx-imately 1500 km × 400 km, which groups a selected number of districts and provinces in Myanmar, Thailand, Laos and Vietnam along the East-West cor-ridor with a population of millions of inhabitants and much more mosquitoes. The model starts in February 2004, with a time step duration of 12 h. There is no limit date that will stop the model, so that user can see the impact of policies in a long-term perspective.
Given this huge area, the fact that we do not have data to locate spatially each individual human being and animal and that case data are at the province scale, it is not relevant to model each individual. As a consequence, we will discretize the environment on a regular grid. Each cell, a 10 km square, will contain the number of human beings and mosquitoes in each infectious state and the parameters of the epidemic dynamics. The infection process will thus be performed at the cell scale. The population of human beings contained inside the cell is computed as follow: is if the cell contained a city, the population of the cell will be equals to the one of the city, else, it will be equals to the rural population of the district divided by the number of rural cells (cells not containing a city). Trades in the corridor will be simply represented by economic exchanges between big cities through truck flows. Each individual truck agent will be able to carry infected people or mosquitoes and release them at their target city.
We add to this system country agents to manage health policies.
In addition, the model will contain several passive agents dedicated to inte-grating data in the model, such as meteo station dealing with temperature and rainfall data in the surrounding area, district and province agents to provide data about dengue case number and population and city and road agents to support truck mobility. The use of passive agents to embed data in the model is a very common modeling choice when dealing with socio-environmental systems (e.g. [3]). It allows the model to be homogeneous in terms of interactions between entities.
4.3 Process Overview and Scheduling
At each simulation step, the model does follow the same schedule. The countries apply their control policies on each cell. The epidemic dynamics is computed in each cell: it will update the (mosquito and human) population in each infection states. Finally the mobility process is executed to create new trucks, make them move to their targets and come back to their source. There is a small probability of epidemic interaction between truck and cells. All these processes are detailed in Sect.4.5)
In addition, every year, countries update their global policy concerning dengue mitigation and the growth of country export is updated.
4.4 Initialization
At the initialization of the model, all the different processes use the data pre-sented in Sect.3.2 to define their initial state.
For the epidemiological part, we get from data the population of each country, province, district and city. However, we spread the population of human beings among the cells of the grid. We follow these steps:
1. each cell determines its district, if there is a city inside its shape and the closest meteorological station,
2. if the cell has a city, its population is immediately equal to the population of the contained city,
3. for all the other cells, we distribute homogeneously the remaining population of the district (i.e. the district population without the population of the cities), 4. each city receives the number of infected people of the province divided by the total number of cities of the province. If there is no city in the province, the number of infected people will be distributed among the cells with the highest population of the province,
5. finally, we compute the minimal number of mosquitoes needed to get the number of people infected in the cell using the number of people infected, the minimal number of bites that occurred to have this number of people infected with the probability of transmission given. As we know the minimal number of bites and the mean number of bites a mosquito can do, we can finally find the minimal number of mosquitoes needed.
For the mobility part, we just compute for each country the number of trucks needed for the year according to the export given for the current year and the estimated value of a truck. Using the probability of export, we can know how many trucks will go from one country to another country. To determine the origin and target cities for a truck, we consider the population of cities as a weight to determine the probability of the city to be chosen.
For the policy part, we follow these steps:
1. we use data to initialize the information about policies (their factor, their time of efficiency, their cost, the percentage of people to consider the policy applied as a success and their condition that the cell will have to check to apply the policy),
2. we use the lists of policies of each country and their budget to finally initialize the budget allocated for each policy by a country.
4.5 Submodels
Epidemiological Process. This process is based on two sub-processes: the first one spreads the disease to neighbour cells and the second one computes the evolution of humans and mosquitoes infectious states in the current cell. Given the time scale, we needed to represent explicitly mosquitoes population and its life-cycle because, depending on the season the number of mosquitoes can be extremely different and so is the number of new dengue cases. In addition, the various Health Policies do have an effect on mosquitoes depending on their state. Each day a small rate of the cell mosquito population is thus exchanged with neighbour cells. Although mosquitoes have a very small move range, this represents mosquitoes population at the border of two cells3.
We choose a compartment Ordinary Differential Equations (ODE) model for the disease dynamics (in particular because we choose to gather in a single entity, the cell, the human beings and mosquitoes populations, so each cell contains an ODE system, interpolated using Range Kutta 4 method). It is based on the model proposed by [8]. We have 2 populations: the mosquitoes and the human beings (cf. Fig.5): human beings can be in 4 states (Susceptible, Exposed, Infected and Recovered). Once a human being is recovered from the dengue, it cannot be infected by the same serotype. But as there are 4 serotypes of dengue, we consider that a recovered human can become susceptible again (this represent the fact that a human being is susceptible to other serotypes). Mosquitoes can be only in 3 states (Susceptible, Exposed and Infected) as they cannot recover. As shown in the Fig.5, humans become infected because of an infected mosquito and conversely.
The evolution of this model is described using the following ODE systems (left column for the mosquito dynamics, right column for the human beings one):
dSv dt = hv(Sv+ Ev, t) − λv(t)Sv− µvSv dSh dt = −λh(t)Sh+ ωhRh dEv dt = λv(t)Sv− υvEv− µvEv dEh dt = λh(t)Sh− υhEh dIv dt = hv(Iv, t) + υvEv− µvIv dIh dt = υhEh − γhIh dRh dt = γhIh− ωhRh 3
We choose to represent the diffusion process through mosquitoes exchanges in order to stay simple and more flexible if we want to change the simulation step length: in particular it avoids us to take into account commuting process when simulation step length is lower than 1 day and we want to represent spread diffusion through human migrations.
Fig. 5.SEIRS-SEI compartment model for dengue contamination
with: λv(t) (resp. λh(t)) the transfer rate from Susceptible to Exposed for the
vector (resp. human beings), υv (resp. υh) the transfer rate from Exposed to
Infected for vectors (resp. human beings). γh (resp. ωh) is the transfer rate from
Infected to Recovered (resp. Recovered to Susceptible) for human beings. Given the time scale of the simulation we take into account demography only for the vector: hv is the emergence rate given a population and the time t and µv is the
vector mortality rate. This emergence function comes from [10]: the population increase rate is a function of the temperature and rain given a double Poisson distribution.
Trade Exchange Submodel. We made the hypothesis that we can represent trade exchange by taking into account only the commercial trucks mobility car-rying goods between cities. The trade exchange model requires thus 3 steps at 3 different time scales:
1. (Each year) Update of each country economic growth and of the export value. 2. (Each day) Truck creation: each country, based on its export value, creates a number of trucks in their cities and provides them with targets in other countries.
3. (Each simulation step) Truck movement: trucks move back and forth from their origin to their target (and conversely) and are removed when they come back.
The truck movement takes benefits of the GAMA platform features that provide built-in functions to deal with agents move on a (road) graph (given an agent speed and simulation step length).
Policy Submodel. We make the hypothesis that control policies are decided and managed at the country level. Each country has a given amount of money they can use either to cure people or to invest in control policies. A policy is
applied on each cell and has an impact on disease dynamics parameters. Among all the existing policies, each country only uses a subset (for practical, financial or cultural reasons). The dynamics of the model obeys a 3-step process:
1. (Each year) Reallocate budget: each country computes the budget allocated to control and to hospitalisation and to each policy (same algorithm as for the initialization).
2. (Each day) Apply policies: each country computes for each of its policy: – if it can be applied (depending on the period and of remaining budget)
on each cell,
– the impact of the policy application on disease dynamics and spread para-meters.
3. (Each day) Update budget: each country computes the cost of its policy and updates its budget.
Each country has a set of policies to apply.
5
Results and Discussion
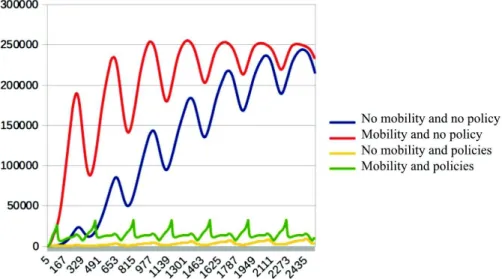
The main result of this model is to be able to show that there is a correlation relationship between the evolution of the economic exchanges and the evolution of Dengue cases (in the West-East ASEAN corridor area). Figure6 shows the results in four different cases: with or without mobility and with or without policies. The red and blue curves show unrealistic cases where policies would not be applied. The only goal of these scenarios is to show that without policies, the mobility has only an impact on the spreading speed of the disease, allowing the disease to reach its maximal incidence faster. The green and yellow curves are more realistic. The yellow one shows the incidence of the disease without mobility (only the one for mosquitoes is present), which corresponds more or
Fig. 6. Results of different experiments: the figure shows the number of Dengue cases given the step number (one step is one day). (Color figure online)
less to the region before the setting up of the corridor. The green one represents the incidence of the disease with the setting up of the corridor, facilitating those outbreaks. We can observe the huge impact of policies application on Dengue cases number. We can also observe a speeding up effect of the mobility on the case number evolution.
The goal of the model is not to show that reducing the mobility along the corridor would help to fight against dengue fever, but to explain the correlation between the growth of dengue cases and the growth of trade between the differ-ent countries. The mobility has certainly an effect on the dengue fever spread, however, it also provides funds for the concerned countries, which can be used for the health policies.
As we can see in Fig.7, if a country uses different policies, it would have consequences for all the countries among the corridor. By applying the policies of Myanmar, Laos reduced the number of dengue cases within the corridor (pre-cisely with Thailand and Vietnam as Laos does not trade a lot with Myanmar, and the trucks do not pass through Myanmar too).
We have checked the validity of the model and of its results at various steps. First, the conceptual model has been designed together with an expert in epi-demiology and in particular in Dengue fever, which ensures that assumptions made are correct. The model has then been carefully implemented, each sub-process being tested separately and then coupled. Finally we made an attempt to validate the model using real data.
A problem concerning this validity of the model raised. The first way to validate the model would be to compare the number of infected people inside the model and the data we have for each month by province. However, the data available are only for the hospitals of the provinces, which can have false positive or true negative data. But these numbers do not take into account the rural population of the provinces: the rural population is most of the time poorer than the urban population, which prevent the human beings to go to hospital to be cured, and thus the cases are not recorded. Another method to validate the model using data could be to validate the model only on city populations: but even if the result would be correct, that does not prove that the behaviour of the rural cells is correct, so we could validate city cells but not the whole model. So we decided to check the validity of the model by asking experts’ opinions about the dynamics of the model and the results are quite encouraging.
In addition, this model has shown to be robust and flexible enough to be manipulated by non-computer scientist researchers (during an initiation to agent-based modeling4). They were able to implement and assess various coor-dination policy scenarios.
From a methodological point of view and similarly to the model presented in [1], our model is based on the coupling of very different dynamics at different scales and involving different paradigms: the epidemic model at the cell scale, based on a macroscopic ODE-based model working at the population scale and the individual truck mobility model. Coupling these two paradigms allow us to
4
(a) Laos Applying its policies
(b) Laos Applying Myanmar Policies Fig. 7.Different policies for Laos
apply processes at the scale of a population (of millions of individuals) and at the scale of individuals.
6
Conclusion
In this paper we have presented an integrated agent-based model coupling dengue fever, climate, mobility and health policies processes in order to tackle the ques-tion of the relaques-tionship between the evoluques-tion of dengue cases and East-West ASEAN corridor opening. The model has shown very promising preliminary results despite validation difficulties.
In the future, we plan to integrate a flexible time scale in the model, which is something that could enlarge the time dimension of the model to use it in cases of longer period (climate change, floods for instances). We also want to better diffuse the climate among the cellular automata by using satellites data rather than using a simple diffusion by location (there is not any interpolation for cells between two meteorological stations, they just get the meteorological data from the closest station). Finally, we would like to add in the model the human mobility, e.g. by representing the movement of the tourists or the workers.
Acknowledgements. This work was part of and supported by the Tam Dao Summer School in Social Sciences (JTD). Authors want to thank the three anonymous reviewers for their helpful comments.
References
1. Banos, A., Corson, N., Gaudou, B., Laperrière, V., Coyrehourcq, S.R.: Coupling micro and macro dynamics models on networks: application to disease spread. In: Gaudou, B., Sichman, J.S. (eds.) MABS 2015. LNCS, vol. 9568, pp. 19–33. Springer, Cham (2016). doi:10.1007/978-3-319-31447-1_2
2. Bhatt, S., Gething, P.W., Brady, O.J., Messina, J.P., Farlow, A.W., Moyes, C.L., Myers, M.F.: The global distribution and burden of dengue. Nature (2013)
3. Gaudou, B., et al.: The MAELIA multi-agent platform for integrated analysis of interactions between agricultural land-use and low-water management strategies. In: Alam, S.J., Parunak, H.V.D. (eds.) MABS 2013. LNCS, vol. 8235, pp. 85–100. Springer, Heidelberg (2014). doi:10.1007/978-3-642-54783-6_6
4. Grignard, A., Taillandier, P., Gaudou, B., Vo, D.A., Huynh, N.Q., Drogoul, A.: GAMA 1.6: advancing the art of complex agent-based modeling and simulation. In: Boella, G., Elkind, E., Savarimuthu, B.T.R., Dignum, F., Purvis, M.K. (eds.) PRIMA 2013. LNCS (LNAI), vol. 8291, pp. 117–131. Springer, Heidelberg (2013). doi:10.1007/978-3-642-44927-7_9
5. Grimm, V., Berger, U., DeAngelis, D.L., Polhill, J.G., Giske, J., Railsback, S.F.: The ODD protocol: a review and first update. Ecol. Model. 221(23), 2760–2768 (2010)
6. Lloyd, L.S., Beaver, C., Seng, C.M.: Managing regional public goods for health community-based dengue vector control. Technical report, Asian Development Bank, World Health Organization (2013)
7. Malavige, G., Fernando, S., Fernando, D., Seneviratne, S.: Dengue viral infections. Postgrad. Med. J. 80(948), 588–601 (2004)
8. Manore, C.A., Hickmann, K.S., Hyman, J.M., Foppa, I.M., Davis, J.K., Wesson, D.M., Mores, C.N.: A network-patch methodology for adapting agent-based models for directly transmitted disease to mosquito-borne disease. J. Biol. Dyn. (2015) 9. Murray, N.E.A., Quam, M.B., Wilder-Smith, A.: Epidemiology of dengue: past,
present and future prospects. Clin. Epidemiol. 5, 299–309 (2013)
10. Parham, P., Michael, E.: Modeling the effects of weather and climate change on malaria transmission. Environ. Health Perspect. 118(5), 620–626 (2010)
11. Shepard, D.S., Undurraga, E.A., Halasa, Y.A.: Economic and disease burden of dengue in southeast asia. PLoS Negl. Trop. Dis. 7(2), e2055 (2013)
12. The Centre for Logistics Research in Thammasat University. The GMS east west economic corridor logistics benchmark study. Technical report, Thammasat Uni-versity (2016)
13. Wilensky, U., Evanston, I.: Netlogo. Center for connected learning and computer based modeling. Technical report, Northwestern University (1999)

![Fig. 2. Boosted Regression Trees (BRT) model probability of occurrence map. Map predicted at a 5 km × 5 km resolution with exclusion criteria [ 2 ].](https://thumb-eu.123doks.com/thumbv2/123doknet/3056244.86254/5.892.122.744.102.349/boosted-regression-probability-occurrence-predicted-resolution-exclusion-criteria.webp)