To cite this version :
Benhamed, Imane and Barthe, Laurie and Kessas,
Rachid and Julcour-Lebigue, Carine and Delmas, Henri Effect of transition
metal impregnation on oxidative regeneration of activated carbon by
catalytic wet air oxidation. (2016) Applied Catalysis B: Environmental, 187.
228-237. ISSN 0926-3373
O
pen
A
rchive
T
OULOUSE
A
rchive
O
uverte (
OATAO
)
OATAO is an open access repository that collects the work of Toulouse researchers and
makes it freely available over the web where possible.
This is an author-deposited version published in :
http://oatao.univ-toulouse.fr/
Eprints ID : 20830
To link to this article: DOI :
10.1016/j.apcatb.2016.01.016
URL :
https://doi.org/10.1016/j.apcatb.2016.01.016
Any correspondence concerning this service should be sent to the repository
administrator:
[email protected]
Effect of transition metal impregnation on oxidative regeneration of
activated carbon by catalytic wet air oxidation
Imane Benhamed
a,b,c, Laurie Barthe
a,b, Rachid Kessas
c, Carine Julcour
a,b,∗,
Henri Delmas
a,baUniversité de Toulouse, INP, UPS, LGC (Laboratoire de Génie Chimique), 4 Allée Emile Monso, CS 84234, F-31432 Toulouse, France bCNRS, LGC, F-31432 Toulouse, France
cUniversité des Sciences et de la Technologie d’Oran, BP 1505, El Mnaouer, Oran 31 000, Algerie
Keywords:
Wastewater treatment Sequential process Fixed bed
Supported iron catalyst Supported copper catalyst
a b s t r a c t
Impregnation of a commercial activated carbon (AC) with transition metals was investigated to extend its reuse as phenol adsorbent after regeneration by catalytic wet air oxidation (CWAO). Iron and copper catalysts were prepared with varied metal dispersions and oxidation states by using different heat treat-ments. The main feature of the iron catalysts was to reduce the phenol oligomerization due to oxidative coupling, while the copper catalyst was prone to leaching promoting homogeneous reaction. However their regeneration efficiency was not significantly improved with respect to the starting AC due to an increased adverse effect of CWAO itself on their adsorptive properties.
1. Introduction
Phenols are commonly found in wastewater discharges as major compounds of oil refineries, coal conversion processes, petrochem-ical and pharmaceutpetrochem-ical industries, steel and resin manufacturing plants[1]. Due to their low biodegradability, phenol and deriva-tives can be toxic even at low concentration and cause undesirable effects on marine wildlife[2]and human health[1].
Therefore phenol is probably the most investigated pollu-tant in the numerous studies examining physical and chemical wastewater treatments in complement or replacement of the usual biological processes. For instance, adsorption on activated carbon (AC) is a popular technique to remove phenol because of its high efficiency, simplicity of design and operation, and low energy cost
[3–5]. However adsorption provides only a temporary solution by displacing the pollution and the spent activated carbon itself may be considered as a hazardous material which requires regeneration or incineration. Several techniques of regeneration have already been studied based either on desorption or pollutant decomposi-tion[6,7]. Thermal regeneration using steam or inert gas stream
(generally operated at temperatures above 700◦C)[8], supercrit-ical wet oxidation[9] and wet air oxidation (WAO)[10,11]are proved to be efficient, but they request high energy consumption and/or expensive equipment. When WAO is operated directly on AC, the later can act as an efficient catalyst, tempering the required conditions of temperature and pressure[12,13].
In this context, a sequential adsorption/oxidation (AD-OX) process has been developed which combines low-cost effective adsorption onto activated carbon (AC) to in-situ regeneration of the adsorbent by catalytic wet air oxidation (CWAO)[14–16], thereby destroying (at least partially) adsorbed organic pollutants. In this process the main wastewater stream is thus treated at ambient conditions, yielding energy saving with respect to the continuous oxidation. Furthermore remaining degradation products should be less an issue (with respect to their possible toxic effects) as they would be more readily extracted from AC during the oxidation step than during the next adsorption. However the whole process per-formance suffers from a dramatic loss of AC adsorption capacity after the first cycle, mainly due to the deposit of phenolic oligomers formed during oxidation. Several works have suggested that incor-poration of inexpensive transition metals onto AC surface could help to preserve its porous structure, besides increasing phenol abatement and mineralization[17–19]. For instance, Quintanilla et al.[18]observed a 89% decrease in the BET surface area of a com-mercial activated carbon after use for the continuous oxidation of
phenol, but a decrease of only 40% for the same carbon impreg-nated with 2.5 wt% of Fe. Sheintuch et al.[6]also compared the regeneration efficiency of virgin and 5–10 wt% metal oxide loaded activated carbons after saturation with phenol. The catalyst was prepared by wet impregnation of AC with a mixture of copper, iron and chromium salts and regeneration was done by flowing air or 5% oxygen in nitrogen at 240–290◦C. The authors concluded that the presence of metals was required to fully restore the adsorption capacities of AC which then could be reused over 10 cycles.
The aim of this work is to investigate the effect of iron or cop-per oxide deposit on AC activity in CWAO and to extend its lifetime as an adsorbent by improving its regeneration under mild oxida-tive treatment. For that purpose, transition metal impregnated ACs were tested in repeated adsorption/oxidation cycles performed in a fixed bed set-up, as well as in “standard” batch oxidations in an autoclave reactor.
2. Materials and methods
2.1. Activated carbon and metal sources
A granular activated carbon (AC) produced from wood (Merck 2514) was used as a reference, as it had proved its activity in the CWAO of phenol[12,20]and AD-OX process[15]. It was received in the form of millimeter-sized pellets and sieved to get the 1.2–1.6 mm fraction. Its textural properties are reported inTable 1, showing both meso- and micro-porosity and a high surface area (960 m2/g).
This AC was impregnated using iron or copper nitrate as this precursor was found to yield well anchored and well dispersed catalysts[21,22]. Owing to the high water solubility of these salts (more than 1 kg of hydrated salt/kg of water at 20◦C[23]), concen-trated precursor solutions were used, containing 598 and 314 g/L of Fe(NO3)3,9H2O and Cu(NO3)3,3H2O, respectively.
2.2. Metal deposition on activated carbon
5 wt% metal loaded activated carbons were prepared using incipient-wetness impregnation at ambient temperature. The preparation consisted in contacting during one hour the activated carbon with a small volume of precursor solution, equivalent to 110% of the AC porous volume[24]. 15 g of catalyst were prepared at once.
Impregnation was followed by overnight drying at 110◦C. Two protocols were tested for subsequent calcination carried out in a muffle furnace. The first one (a) consisted in heating the solid up to 200◦C under air (with two successive ramps of 0.67◦C/min and 1.67◦C/min) and maintaining this temperature for 4 h (correspond-ing solids were labeled Fe/ACa and Cu/ACa), while the second one (b) used a calcination temperature of 350◦C (1.4◦C/min ramp and 4 h plateau) under nitrogen flow (Fe/ACb and Cu/ACb).
The first procedure was adopted by Quintanilla et al.[18]for the preparation of their iron on AC catalyst, while the second was used to ensure a complete decomposition of the precursors. Accord-ing to previous studies[25,26]. Fe(NO3)3, 9H2O should be entirely decomposed at 160◦C (first into oxyhydroxide), while a tempera-ture of 250◦C might be required to yield CuO from Cu(NO3)2, 3H2O. As a significant combustion of the metal impregnated AC occurred when heated up to 350◦C under air (85% weight loss after 4 h), calcination “b” was performed under nitrogen instead.
A reduced iron catalyst (Fe/ACb H2) was prepared from Fe/ACb by a subsequent heat treatment under hydrogen flow (ramp of 5◦C/min up to 400◦C, followed by 1 h at this temperature). After reduction, the catalyst was cooled down to room temperature, hydrogen was replaced by argon stream in which oxygen
con-centration was gradually increased from 0.5% to 20% to prevent undesired overheating.
2.3. Characterization of the metal loaded activated carbons
All the synthesized materials were examined by various tech-niques to analyze the effect of the metal addition on the carbon surface properties and to determine the deposit features according to the preparation method.
2.3.1. Textural properties
The specific area and porosity were measured by nitrogen adsorption/desorption at 77 K using a Micromeritics ASAP 2010 surface area analyzer. Prior to the measurement, the solid sample was evacuated at 200◦C for 2 h.
The specific surface area was calculated from BET plot for relative pressures between 0.01 and 0.2[27], whereas the meso-porous and micromeso-porous volumes were estimated according to Barrett-Joyner-Halenda[28]and Horvath-Kawazoe methods[29]
respectively.
2.3.2. Chemical surface properties
Acido-basic properties were measured by the Boehm method
[30]: 1 g of solid was placed in 20 mL of aqueous solution containing either NaOH 0.1 N (to neutralize all acid surface groups), NaHCO3 0.1 N (for carboxylic ones) or HCl 0.1 N (for basic ones). The sus-pensions were let three days at room temperature under gentle stirring, then filtrated and each solution was back titrated.
Since surface oxygen groups decompose upon heating at dif-ferent temperature ranges, thermograms were also recorded on a SDT Q600 thermobalance (TA Instruments) operated under nitro-gen flow. A heating rate of 10◦C/min was applied up to 700◦C. The weight loss in the 150–400◦C and 400–700◦C ranges were exam-ined, which should correspond to the decomposition of carboxylic (150–400◦C), then lactone (350–600◦C), phenol and anhydride functions (600–700◦C)[31,32].
2.3.3. Metal deposit characterization
The iron or copper content was checked by ICP/AES analysis (Ultima 2, Horiba Jobin-Yvon) after combustion and acid attack at 150◦C. Three different samples of 0.5 g each were used to get an average value.
The distribution and dispersion of the metal nanoparticles were examined by microscopy coupled to energy-dispersive X-ray spec-troscopy for elemental identification. Surface and cut sections of the millimetric pellets were observed on a Hitachi TM 3000 scanning electron microscope and ultramicrotome slices on a JEOL JSM-2100F transmission electron microscope. These observations were complemented by XRD analysis on a Bruker AXS D4 Endeavor to identify the nature of the deposited phases and obtain the mean crystallite size from Scherrer formula.
Based on these characterizations, some catalysts were selected and tested in the AD-OX process.
2.4. Experimental set-ups and procedures 2.4.1. AD-OX process
The successive AD-OX cycles were performed using a small jack-eted fixed bed reactor (18 cm high and 1 cm internal diameter) containing about 7 g of solid. The set-up included a continuous liq-uid feed for the adsorption step, as well as a continuous gas feed, a liquid recycling loop with a pressurized tank, a pre-heating system and a gas-liquid separator for the oxidation step. A set of three-way valves controlled the switch from one mode to another. A schematic diagram was given in Julcour Lebigue et al.[33].
Table 1
Physicochemical properties of the original AC and the prepared catalysts following different heat treatment.
Catalyst label BET surface area (m2/g) Micropore volume (cm3/g) Mesopore volume (cm3/g) TGA weight loss (%) Surface groups by Boehm titration (mmol/g)
Metal content from ICP/AES (wt%)
150–400◦C 400–700◦C acidic (carboxylic) basic
Bare AC 959 0.38 0.17 0.6 2.0 0.42 (0.07) 0.37 Fe: 0.1
Cu:
-Fe/ACa 925 0.36 0.15 1.8 6.6 n.a. n.a. 4.2
Fe/ACb 868 0.34 0.13 1.6 6.5 1.29 (0.40) 0.29 4.3 ± 0.1
Fe/ACb H2 970 0.31 0.34 – 7.2 1.76 (0.23) 0.30 n.a.
Cu/ACa 920 0.35 0.17 3.0 8.3 n.a. n.a. 4.2
Cu/ACb 862 0.34 0.15 2.4 8.1 1.10 (0.27) 0.35 4.0 ± 0.2
n.a. = non available.
During the adsorption step, the reactor was continuously fed at 0.23 L/h with a 0.5 g/L phenol solution. The adsorption capacity of the AC was calculated from the concentration-time profile of phenol measured at the reactor outlet.
The semi-batch oxidation step then started after complete bed saturation. The liquid was recycled at 1 L/h between the fixed bed and the liquid tank initially filled with 350 mL of phenol solu-tion (0.5 g/L). The reactor was pressurized at 50 bar by flowing air concurrently upward at 30 NL/h. Simultaneously the thermofluid circulating in the reactor jacket and in the gas-liquid preheater was heated to the required temperature (150◦C). Solution samples were regularly taken in the tank for analysis.
Three consecutive adsorption-regeneration cycles were per-formed for each catalyst.
2.4.2. Autoclave oxidation tests
To better compare the catalytic activity of the materials, oxi-dation tests were also performed in a 300 mL stirred autoclave reactor. They also followed successive adsorption and oxidation cycles – but achieved at the same temperature of 150◦C – and they used a smaller amount of catalyst (1 g) to lower the contribution of adsorbed pollutants and allow an easier comparison of the catalyst activity based on liquid phase analysis.
First, the catalytic pellets (maintained in a fixed basket) and 200 mL of 1 g/L phenol solution were mixed (800 rpm) and left 3 h at 150◦C under nitrogen atmosphere for adsorption equilibration. Then a liquid sample was taken to get initial concentration before air was continuously fed at a flow rate of 40 NL/h through a pres-sure regulating valve to enpres-sure a constant oxygen partial prespres-sure. Total pressure was here set to 20 bar. During the oxidation, liquid samples were periodically withdrawn for analysis (cf. § 2.4.3).
2.4.3. Analysis of liquid samples
Phenol concentration was measured by high performance liq-uid phase chromatography (HPLC) with UV detection (UV2000 detector, Thermo Finnigan). The separation was achieved on a C18 reverse phase column (ProntoSIL C18 AQ) using as a mobile phase a mixture of acetonitrile and deionized water at pH 2 (isocratic method for adsorption samples and gradient method for oxidation samples) fed at 1 mL/min. The wavelength was set to 254 nm for phenol detection. Quantification was made from a calibration curve periodically updated with fresh standard solutions. The relative error of the analysis did not exceed 2% between 0.05 and 0.5 g/L.
During oxidation, the solution was also analyzed for the remain-ing chemical oxygen demand (COD) by a closed-type reflux colorimetric method[34]. Precision of the method was assessed with standard solutions and showed a standard deviation of less than 5%.
Some liquid samples were also examined by ICP/AES to follow metal loss during the successive steps.
3. Results and discussion
3.1. Physicochemical properties of the synthesized catalysts
Table 1compares the porous structure and chemical surface properties of the transition metal loaded carbons with those of the starting AC.
As expected, metal impregnation led to a decrease in spe-cific area, but only by maximum 10%. Moreover a similar limited decrease in mesoporous and microporous volume was observed, suggesting that adsorption capacity would not be significantly altered. Whatever the metal nature, the calcination method “b” always led to the lowest surface area and microporous volume. On the other hand, the reduction under hydrogen flow at 400◦C (Fe/ACb H2) created new mesopores by partial gasification of the activated carbon.
The metal addition had more impact on the surface chemical properties, as the thermogravimetric analysis revealed a significant increase of the weight loss in both the 150–400◦C and 400–700◦C ranges, whatever the calcination protocol. Such modifications were not observed if the starting AC was simply treated at 200◦C under air, which proves the role of the metal (or precursor decomposition) in promoting the formation of oxygen surface groups during the calcination step. If an imperfect correlation was observed between the TGA weight loss and the amount of titrated functional groups, Boehm method however confirmed the previous trends: new acidic groups were created on supported iron and copper oxide catalysts, and in particular carboxylic ones. These strong acidic functionalities were at least partially removed when Fe/ACb was subjected to the reductive treatment.
Regarding the metal deposit itself, a slight difference was found between the theoretical content (5 wt%) and the measured values reported in Table 1. It may be attributed rather to an incom-plete dissolution of the combustion residues than to some deposit inhomogeneity, as small deviations were recorded between the different examined solid samples. At the pellet scale, SEM/EDX investigation showed some excess of metal (up to 30 wt%) on the most external surface due to the preparation method. However, a rather uniform metal content was measured within the particles with an order of magnitude (2 to 8 wt%) close to the theoretical value.
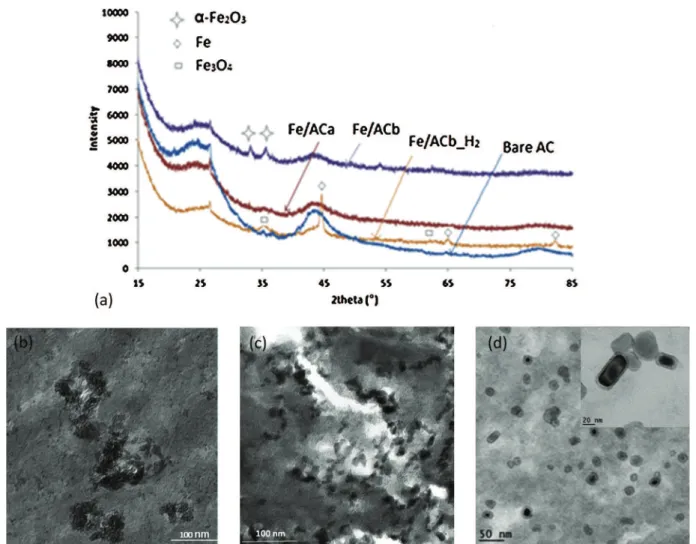
The diffractogram of Fe/ACa (Fig. 1a) did not exhibit any extra diffraction peak with respect to bare AC, which might result from iron oxide crystallites being too small to be detected. However this conclusion was not supported by TEM observation, as only aggregates of several tens of nanometers (black areas) could be distinguished (Fig. 1b).
On the other hand, XRD analysis confirmed the presence of hematite crystallites of about 15 nm for Fe/ACb, which was con-sistent with TEM images showing nanoparticles of ca. 10 nm (Fig. 1c).
Fig. 1. Iron (oxide) catalysts: (a) X-ray diffractograms of Fe impregnated and bare ACs, and TEM micrographs of (b) Fe/ACa, (c) Fe/ACb, (d) Fe/ACbH2.
These deposits should be mainly located within the mesopores, without generating significant pore blockage.
After reduction of Fe/ACb, a clear core-shell structure was observed (Fig. 1d), identified as Fe◦for the core and Fe3O4for the thin passivation layer resulting from the slow reintroduction of oxygen. Scherrer calculation provided a mean diameter of 20 nm for the metal core, indicating a limited sintering of the nanoparticles under the reductive treatment.
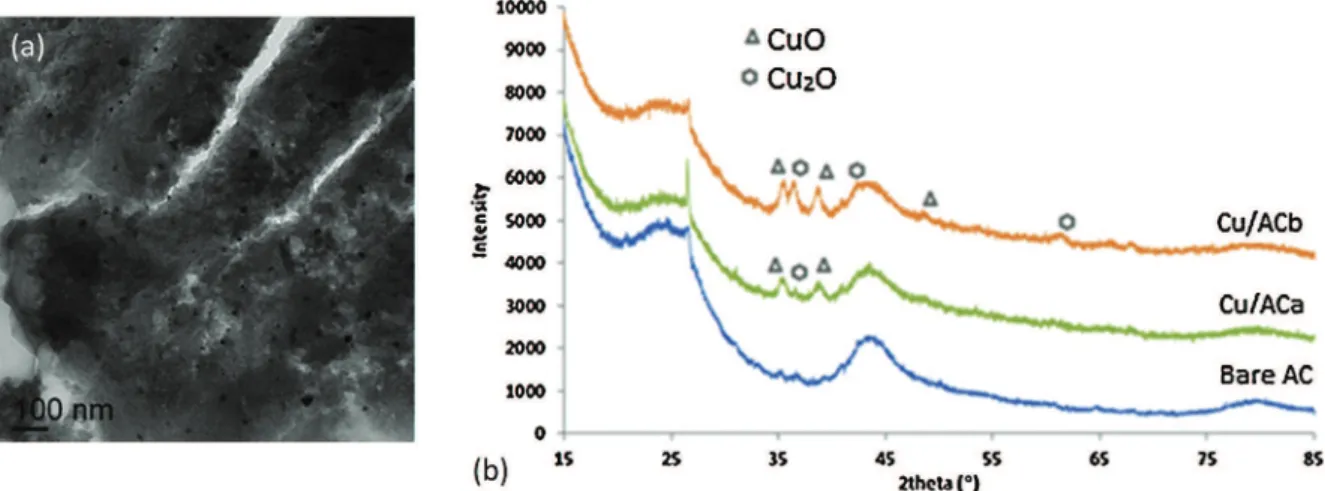
Concerning the copper deposit, small individual oxide nanopar-ticles of tens of nanometer were also detected for Cu/ACb (Fig. 2a), corresponding to a mixture of CuO and Cu2O. More Cu2O was detected after calcination protocol “b” under N2, due to the reduc-tion of CuO (Fig. 2b).
Exhibiting well defined oxide phase and good dispersion, cata-lysts calcinated following method “b” were selected for extensive investigation in CWAO regeneration. Some preliminary tests (not described) also showed that calcination “a” yielded increased metal leaching under AD-OX process conditions (see Table S1 in Supple-mentary Information).
3.2. Performance of the selected catalysts in the AD-OX process 3.2.1. Adsorption step
An example of the consecutive breakthrough curves obtained during the AD-OX cycles is given inFig. 3for the original AC.
It clearly shows that CWAO only provided a partial regenera-tion of the bare AC, with the most significant loss of the adsorpregenera-tion capacity observed between the first and second cycles.
From numerical integration of the first breakthrough curve, a value of 0.19 g of phenol/g of AC was calculated for the fresh AC at equilibrium with the feed concentration (0.5 g/L), which agrees well with the value of 0.20 g/gACderived from the adsorption isotherm
[35].
Likewise the phenol amounts adsorbed on the different catalysts were calculated for each cycle and the corresponding values are gathered inFig. 4. Regarding the initial adsorption properties, the addition of metal oxide only reduced the phenol uptake by about 16% as compared to the original AC, in accordance with the low reduction in BET surface area obtained for Fe/ACb or Cu/ACb (cf.
Table 1). Albeit providing a high surface area, Fe/ACb H2 exhib-ited the lowest pollutant retention due to its lower microporous volume. This also means that the observed changes in surface acid-ity should have only a limited effect on the adsorption capacacid-ity as the reductive treatment also removed part of the carboxylic groups which could hinder phenol adsorption.
On the other hand, fitting the starting of the initial breakthrough curves by a porous diffusion model[15]yielded an effective diffu-sion coefficient reduced by a factor 2–3 for Fe/ACb or Cu/ACb, but only by 30% for Fe/ACb H2with respect to the bare AC (Table 2). Note that for these simulations, the same value of the Langmuir adsorption constant was used for all the materials, corresponding to that of phenol on bare AC[35]. This suggests a stronger effect of the chemical surface properties on the adsorption dynamics, the effective diffusivity of the pollutant resulting mainly from surface diffusion.
Fig. 2. Copper oxide catalysts: (a) TEM micrograph of Cu/ACb and (b) X-ray diffractograms of Cu impregnated and bare ACs.
Fig. 3. Successive breakthrough curves on fresh and CWAO regenerated AC: QL= 0.23 L/h, CPh,feed= 0.5 g/L, mAC= 7.25 g, T = 25◦C.
Because of stop during the night, the first breakthrough exhibits readsorption negative peaks (in grey level) when restarting the phenol feed.
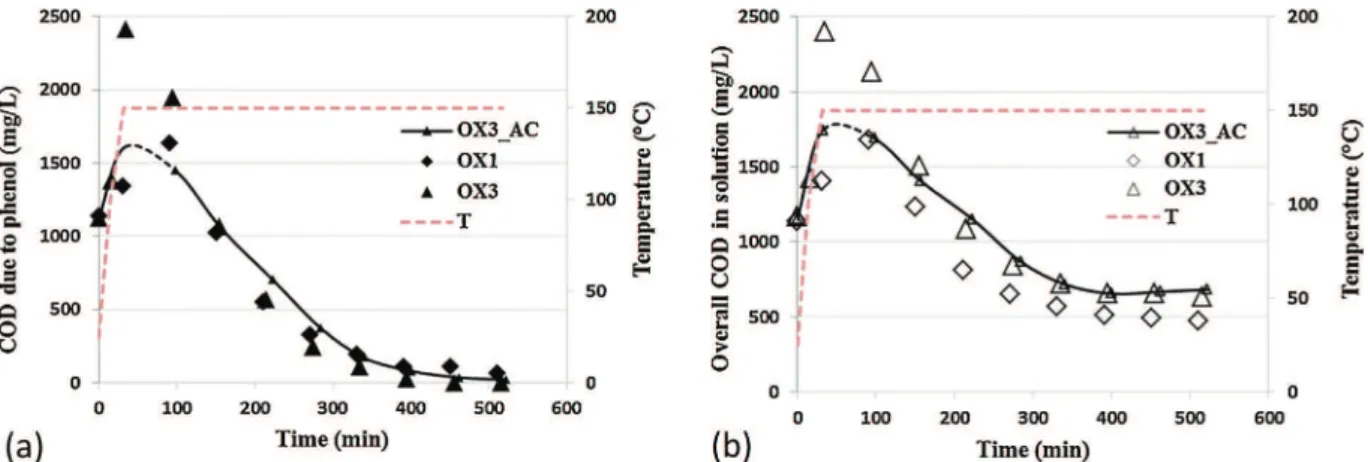
Fig. 5. Evolution of (a) COD due to phenol and (b) overall COD in solution during the first and third oxidations on Fe/ACb (large symbols) and during the third oxidation on bare AC (lines with small symbols): QL= 1 L/h, Qair= 30 NL/h, CPh,ox0= 0.5 g/L, mcat= 7.42 g, VL= 350 mL, T = 150◦C, Ptot= 50 bar.
Table 2
Values of saturation capacity (qmax) and effective diffusivity (De) of phenol identi-fied from the initial breakthrough curve (Langmuir adsorption constant KLset to 0.88 m3/mol (Andriantsiferana et al.[35]), Deaccounting for both the contributions of pore and surface diffusion).
Catalyst label qmax(molPh/kgcat) De(m2/s)
Bare AC 2.2 4.0 × 10⁻⁹
Fe/ACb 1.8 1.7 × 10⁻⁹
Fe/ACb H2 1.6 3.1 × 10⁻⁹
Cu/ACb 1.9 1.6 × 10⁻⁹
For the subsequent AD-OX cycles, metal addition proved ben-eficial, enhancing material regeneration by CWAO: adsorption capacity of bare AC, Fe/ACb, Fe/ACb H2and Cu/ACb reached respec-tively 21%, 35%, 39% and 27% of their initial value after two oxidative regeneration cycles. Nonetheless, for all the catalysts, breakthrough occurred at a much shorter time after treatment (see Figs. S1–S3 in Supplementary information), due to a still strong reduction of both the diffusivity and the adsorption constant[15,36].
3.2.2. Oxidation step
As for adsorption, the efficiency of the catalysts was better at the first use and got almost stabilized after two cycles. Therefore only the results of first and third oxidations are shown inFigs. 5–7
for the selected catalysts. The trends measured with the bare AC at the last cycle are also represented on these figures for comparison purpose.
The oxidation step starting with a heating period under air flow (about 30 min to reach the set temperature of 150◦C), it involved simultaneous desorption and oxidation. This gave rise to similar evolution for the three catalysts: due to very different temperature effects on adsorption and reaction, fast desorption occurred before efficient reaction, leading to a maximum of phenol concentration in the liquid phase (cf.Figs. 5–7a where phenol concentration is expressed in equivalent COD value). Later on (close to 150◦C) reac-tion prevailed and complete degradareac-tion of phenol was achieved. Profiles of overall COD in solution (Figs. 5–7b) followed the same trend, except that they seemed to plateau with only a partial min-eralization achieved after 8 h of oxidation.
A closer look to the values measured at the last cycle indicates that a larger desorption peak occurred with Fe/ACb, while the oxi-dation ended with almost the same COD value as with bare AC (Fig. 5). The results obtained with Fe/ACb H2(Fig. 6) were simi-lar to those of Fe/ACb, probably due to a fast oxidation of the zero valent iron during the regeneration process under air.
Conversely, Cu/ACb (Fig. 7) always achieved a better elimination of phenol and COD in solution: the residual value reached 300 mg/L
vs. 680 mg/L for bare AC and 630 mg/L for Fe/ACb. However this bet-ter mineralization in the liquid phase did not significantly improve its regeneration, as shown onFig. 4.
This poor correlation in between the apparent catalytic activity of the materials and their readsorption could be surprising, but it should be recalled that the analysis of the liquid phase only gave a partial vision of the complex involved phenomena. The remaining COD in solution was mainly composed of low-weight intermedi-ates which should be poorly adsorbed on the carbons. This seems confirmed by the close match between the overall COD and that calculated from phenol concentration during the heating period (up to the maximum): the contribution of these end-products was therefore much lower than that of phenol added in the subsequent adsorption step.
On the other hand, as above mentioned, one main obstacle of the oxidative regeneration lies in the concomitant formation of phenol oligomers, which are more stable than the original molecule and remain chemisorbed on the solid. Therefore their respective con-tribution can be only compared through an analysis of the materials after use.
3.2.3. Physicochemical properties of the aged catalysts
3.2.3.1. Role of phenol condensation products and carbon oxida-tion. Successive methanol extractions were first performed on the carbons recovered after the third cycle (oxidation 3). Only 4-hydrobenzoic acid was specifically identified as a reaction inter-mediate by the HPLC/MS analysis of the extracts. The formation of this compound had already been reported during phenol oxidation, but only when activated carbon was used as catalyst, due to some interaction in between AC surface, phenol and oxygen[24]. Being adsorbed preferentially[35], this molecule might not be removed by phenol during the adsorption step. Nonetheless it was not found in a sufficient amount (less than 10 g/kgAC) to explain the extensive reduction of phenol uptake after the first cycle.
The formation of condensation products was assessed through thermogravimetric analysis, whose results are given inTable 3. In all cases, the used carbons exhibited an increased weight loss between 150 and 700◦C with respect to the original ones (cf.
Table 1), but to a smaller extent when transition metal was added: it was multiplied by a factor six for the bare AC, but it only doubled for the other catalysts. In the 150–400◦C range, where phenol oligomers are expected to be decomposed together with carboxylic surface functions, the lowest values were achieved for the iron loaded materials. Similarly a lower reduction of surface area was observed for Fe/ACb, 34% only, as compared to 55% and 77% for Cu/ACb and original AC, respectively. Note that in all cases it corresponded to a decrease of microporosity, while the
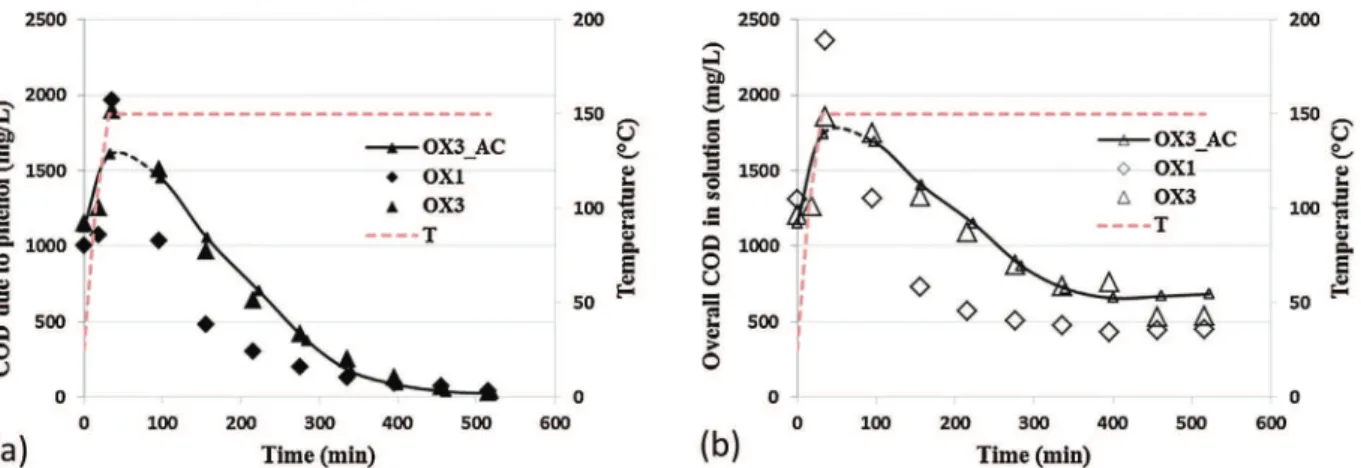
meso-Fig. 6. Evolution of (a) COD due to phenol and (b) overall COD in solution during the first and third oxidations on Fe/ACb H2(large symbols) and during the third oxidation on bare AC (lines with small symbols): QL= 1 L/h, Qair= 30 NL/h, CPh,ox0= 0.5 g/L, mcat= 5.60 g, VL= 350 mL, T = 150◦C, Ptot= 50 bar.
Fig. 7. Evolution of (a) COD due to phenol and (b) overall COD in solution during the first and third oxidations on Cu/ACb (large symbols) and during the third oxidation on bare AC (lines with small symbols): QL= 1 L/h, Qair= 30 NL/h, CPh,ox0= 0.5 g/L, mcat= 7.49 g, VL= 350 mL, T = 150◦C, Ptot= 50 bar.
Table 3
Textural and surface properties of the aged materials after three AD-OX fixed bed cycles.
Catalyst label BET surface area (m2/g)
Micropore volume (cm3/g)
Mesopore volume (cm3/g)
TGA weight loss (%)
150–400◦C 400–700◦C Bare AC 220 0.09 0.15 5.8 10.2 Fe/ACb 571 0.22 0.19 4.9 10.8 Fe/ACb H2 553 0.17 0.22 4.2 10.6 Cu/ACb 391 0.15 0.14 7.5 10.9 Table 4
Adsorption capacity of the materials after WAO (without pollutant).
Catalyst label Adsorbed phenol amount (gPh/kgcat)
Bare AC 152
Fe/ACb 75
Cu/ACb 95
pore volume was almost unaffected or even slightly increased for Fe/ACb. This is in line with the conclusions of Quintanilla et al.[18]
who reported that transition metals could limit the formation of phenolic condensation products blocking the smallest pores.
Besides the oxidative treatment itself might have also changed some features of the carbons, by modifying their surface functions or their porous structure. To evaluate this contribution, wet air oxi-dation was performed without any pollutant on bare AC, Fe/ACb and Cu/ACb prior to the classical phenol adsorption. The adsorption capacities calculated from the corresponding breakthrough curves are summarized inTable 4.
Table 5
Textural properties of the metal oxide catalysts after WAO (and phenol adsorption).
Catalyst label BET surface area (m2/g) Micropore volume (cm3/g) Mesopore volume (cm3/g) Fe/ACb 604 0.19 0.24 Cu/ACb 633 0.20 0.21
A comparison with the values given inFig. 4shows that wet air oxidation only slightly reduced the adsorption capacity of original AC which was still much higher than after the first regeneration. However the decrease was more significant in the case of metal impregnated carbons (with 40–53% loss) and should explain why these materials were not much better regenerated.
Examination of the textural properties of the oxidized catalysts (Table 5) revealed that WAO resulted in an enlargement of their pore size: the mesoporous volume clearly increasing to the detri-ment of that of micropores, from 0.13 to 0.24 cm3/g and from 0.15 to 0.21 cm3/g for Fe/ACb and Cu/ACb, respectively. For the iron
sup-Fig. 8. Fe/ACb H2after use: (a) TEM image and (b) X-ray diffractogram.
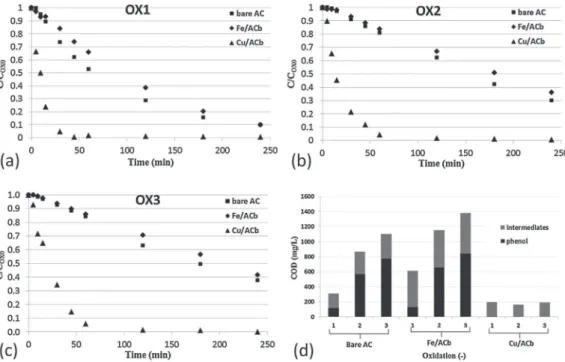
Fig. 9. Evolution of the normalized phenol concentration during three successive oxidations ((a) to (c)) using bare and metal loaded ACs and (d) residual COD in solution after 4 h of oxidation (CPh,ad0= 1 g/L (prior to adsorption step), mcat= 1 g, VL= 200 mL, T = 150◦C, Ptot= 20 bar).
COX0stands for the concentration after the preliminary adsorption.
ported catalyst, the resulting surface area and pore distribution were found very close to those observed after the AD-OX cycles (cf.Table 3). Once again, increased oxidation effects appeared as the main reason of this catalyst aging.
3.2.3.2. Catalyst stability. The main features of the catalytic deposit after use were examined using the methods described in Section
2.3.3.
Metal content of Fe/ACb was found unchanged after use, but a loss of about 25% was observed for Cu/ACb. Analysis of liquid samples collected during the successive steps indicated that cop-per leaching mainly occurred during the very first minutes of the initial adsorption step, which contributed for about 30% of the metal loss. This rapid dissolution probably corresponded to the metal excess on the particle surface, after which the leaching rate was
reduced by diffusion effects. The subsequent adsorption and oxi-dation steps then resulted each in a metal loss accounting for 2–4% of the initial amount (see Fig. S4 in Supplementary information). As this dissolved copper could also act a catalyst during the oxidative regeneration, the contribution of the homogeneous reaction was further examined during the autoclave tests (cf. § 3.3).
The high dispersion of Fe/ACb was rather well maintained under CWAO with mainly nanoparticles of 10–20 nm found on TEM images and few 50 nm particles aggregates (see Figure S5 in Sup-plementary Information). The lower stability of the copper oxide deposit resulted in larger individual particles (20–50 nm) and more aggregates containing rods up to 100 nm in length (see Fig. S6 in Supplementary information). The intensity of the copper oxide peaks was also strongly reduced on the XRD pattern of the aged Cu/ACb.
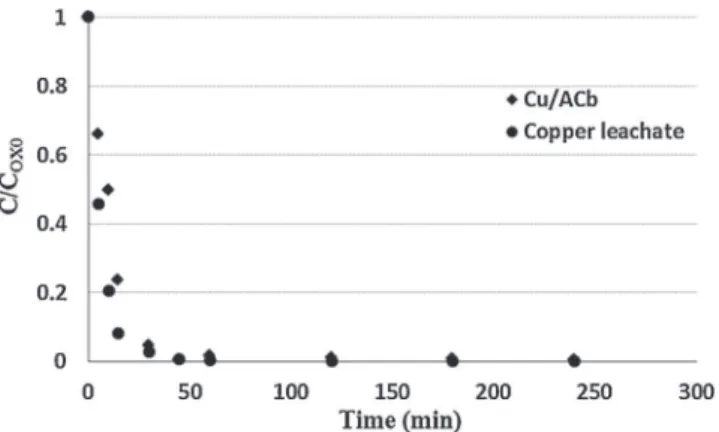
Fig. 10. Phenol oxidation on fresh Cu/ACb (mcat= 1 g) and with the corresponding leachate (CPh,OX0= 0.7–0.6 g/L, VL= 200 mL, T = 150◦C, Ptot= 20 bar).
As suspected as well, wet air oxidation strongly modified Fe/ACb H2: the initial core-shell structure almost disappeared (Fig. 8a) and only hematite phase was detected after use (Fig. 8b). This explains the similar behavior of this catalyst with Fe/ACb. 3.3. Autoclave oxidation tests
The performance of Fe/ACb and Cu/ACb as oxidation catalysts was further examined using a much lower solid to liquid weight ratio - 1/200 as compared to 1/50 in the fixed bed operation - in order to reduce the contribution of the solid phase. As described in §2.4.2, a sequential procedure was also applied for these tests: first a batch adsorption step at 150◦C for 3 h under nitrogen, then the oxidation. The catalyst stability was evaluated over three succes-sive uses, by measuring the time-concentration of the pollutant in the liquid phase, as well as residual COD at the end of the oxida-tion run.Fig. 9a-c exhibits such profiles after normalization by the values measured after the preliminary adsorptions.
In these autoclave tests, Cu/ACb more clearly outperformed the other catalysts, resulting in a full conversion of the phenol within 45 min at the first use, while more than 4 h were required with Fe/ACb or bare AC. Moreover, as shown inFig. 9d, this cata-lyst also achieved high and stable mineralization of the pollutant (about 90% with respect to the phenol concentration measured after adsorption). The main difference in between the two reactor con-figurations being the pollutant distribution in between solid and liquid phases, it might result in a stronger effect of the homoge-neous reaction catalyzed by dissolved copper under the present conditions. Note also that the Cu/ACb sample used in the autoclave did not undergo a preliminary “washing” as it was the case during the continuous adsorption of the AD-OX process.
To assess the activity of the leached copper, the solution recov-ered after the first run on Cu/ACb was supplemented with phenol and tested under the same reaction conditions.Fig. 10, which com-pares the respective time-phenol concentration profiles, points out a dominant effect of dissolved copper on the pollutant conver-sion. However, this homogeneous oxidation yielded a final COD of about 662 mg/L, so three times higher than that obtained with Cu/ACb (cf.Fig. 9d). Therefore, the copper catalyst should involve both homogenous and heterogeneous mechanisms, as suggested in previous studies[37].
On the other hand, surprisingly, these experiments cast serious doubt on the catalytic activity of the iron oxide deposit: Fe2O3/AC indeed led to almost the same phenol conversion as bare AC and apparently to a lower pollutant mineralization according to the residual COD values measured in solution (Fig. 9d). However, as previously highlighted, part of the phenol removed from the liquid phase should be transformed into oligomers preferably retained on
the solids. To better elucidate the pollutant fate with both the cat-alysts, a carbon balance was performed during the first oxidation, based on an alkali trapping of CO2and volatile organic compounds from the gas outflow. Despite very different values in solution (cf. corresponding COD values inFig. 9d), both Fe/ACb and bare AC yielded very similar amount of total carbon emitted in the gas phase. This is consistent with a lower carbonaceous deposit on the supported iron catalyst, even when accounting for its larger com-bustion upon WAO. Moreover the weight of bare AC increased by 10% after the oxidations while that of Fe/ACb was reduced by 5%. This confirms that main effect of iron addition was indeed to hinder the oxidative coupling phenomena.
4. Conclusion
Metal oxide loaded carbons were prepared by incipient-wetness impregnation followed by different heat treatments in the view of increasing their stability under repetitive adsorption/oxidative regeneration cycles. The application of a higher calcination temper-ature (350◦C vs. 200◦C) resulted in an improved crystallinity and a lower metal leaching. Despite an increased acidity, these catalysts showed only a slightly lowered phenol uptake with respect to the starting carbon, due to a preserved porous structure otherwise. A reduced catalyst was also prepared exhibiting core-shell nanopar-ticles (Fe0core and Fe
3O4passivating layer), a higher mesoporosity and less carboxylic surface functions.
Whatever the nature of the metal (iron or copper) or its ini-tial oxidation state, the addition of transition was found to only marginally improve the restauration of adsorptive properties by CWAO due to opposite effects. If on the one hand it could lower the oxidative coupling and thus the microporosity blockage by phenol condensation products, as demonstrated for Fe/ACb, on the other hand it increased the adverse effect of oxidation on the carbon properties: adsorption capacity of the catalyst was decreased by one-half after the oxidative treatment (without any pollutant) vs. 20% for the original AC. Fe/ACb H2 exhibited a fast re-oxidation under CWAO conditions and almost behaved as Fe/ACb.
The copper catalyst also showed a significant leaching which promoted a homogeneous reaction. It accelerated the pollutant degradation in solution but did not improve the regeneration effi-ciency either.
Acknowledgements
The authors are grateful for financial support of PHC Tassili CMEP 11MDU833. They also thank P. Alphonse (CIRIMAT Toulouse) for the synthesis of the reduced catalyst and XRD analyses, M.L. Pern, G. Raimbeaux, C. Rey-Rouch, M.L. de Solan-Bethmale, D. Riboul (LGC Toulouse) for their help on catalyst and liquid phase characteriza-tions, J.L. Labat, J.L. Nadalin and I. Coghe (LGC) for implementing the experimental set-ups.
Appendix A. Supplementary data
Supplementary data associated with this article can be found, in the online version, athttp://dx.doi.org/10.1016/j.apcatb.2016. 01.016.
References
[1]G. Busca, S. Berardinelli, C. Resini, L. Arrighi, J. Hazard. Mater. 160 (2008) 265–288.
[2]R. Oost, J. Beyer, N. Vermeulen, Environ. Toxicol. Pharm. 13 (2003) 57–149.
[3]A. Dabrowski, A. Podkoscielny, Z. Hubicki, M. Barczak, Chemosphere 58 (2005) 1049–1070.
I. Benhamed et al. / Applied Catalysis B: Environmental 187 (2016) 228–237 237
[5]S.J. Kulkarni, R.W. Tapre, S.V. Patil, M.B. Sawarkar, Procedia Eng. 51 (2013) 300–307.
[6]M. Sheintuch, Y.I. Matatov-Meytal, Catal. Today 53 (1999) 73–80.
[7]O. Zanella, I.C. Tessaro, L.A. Ferris, Chem. Eng. Technol. 37 (2014) 1447–1459.
[8]E. Sabio, E. Gonzalez, C.M. Gonzalez-Garcia, A. Ramiro, J. Ganan, Carbon 42 (2004) 2285–2293.
[9]T. Charinpanitkul, W. Tanthapanichakoon, J. Ind. Eng. Chem. 17 (2011) 570–574.
[10]V.S. Mishra, V.V. Mahajani, J.B. Joshi, Ind. Eng. Chem. Res. 34 (1995) 2–48.
[11]F. Luck, Catal. Today 53 (1999) 81–91.
[12]A. Fortuny, J. Font, A. Fabregat, Appl. Catal. B 19 (1998) 165–173.
[13]F. Stüber, J. Font, A. Fortuny, C. Bengoa, A. Eftaxias, A. Fabregat, Top Catal. 33 (2005) 3–50.
[14]I. Polaert, A.M. Wilhelm, H. Delmas, Chem. Eng. Sci. 57 (2002) 1585–1590.
[15]H. Delmas, C. Creanga, C. Julcour, A.M. Wilhelm, Chem. Eng. J. 152 (2009) 189–194.
[16]I. Quesada-Pe ˜nate, C. Julcour-Lebigue, U.J. Jáuregui-Haza, A.M. Wilhelm, H. Delmas, J. Hazard. Mater. 221 (2012) 131–138.
[17]M. Baricot, S.A. Dastgheib, J. Font, A. Fortuny, F. Stüber, C. Bengoa, A. Fabregat, L. Le Coq, J. Font, Proceed. Eur. Congress Chem. Eng. (ECCE-6), Copenhagen, 16–20 September 2007, 2007.
[18]A. Quintanilla, J. Casas, J. Rodriguez, Appl. Catal. B 76 (2007) 135–145.
[19]J.C. Moreno-Piraján, L. Giraldo, Arabian J. Sci. Eng. 38 (2013) 49–57.
[20]S. Suwanprasop, A. Eftaxias, F. Stüber, I. Polaert, C. Julcour-Lebigue, H. Delmas, Ind. Eng. Chem. Res. 44 (2005) 9513–9523.
[21]A. Rey, M. Faraldos, J.A. Casas, J.A. Zazo, A. Bahamonde, J.J. Rodriguez, Appl. Catal. B 86 (2009) 69–77.
[22]F.M. Duarte, F.J. Maldonado-Hódarb, L.M. Madeira, Appl. Catal. A 458 (2013) 39–47.
[23]CRC Handbook of Chemistry and Physics, in: W.M. Haynes (Ed.), 96th ed., CRC Press, Boca Raton, FL, 2015, pp. 5–188, pp. 5–189.
[24]A. Quintanilla, J. Casas, A. Mohedano, J. Rodriguez, Appl. Catal. B 67 (2006) 206–216.
[25]K. Wieczorek-Ciurowa, A.J. Kozak, J. Thermal Anal. Calorim. 58 (1999) 647–651.
[26]S.A.A. Mansour, J. Therm. Anal. 45 (1995) 1381–1392.
[27]S. Brunauer, P.H. Emmett, E. Teller, J. Am. Chem. Soc. 60 (1938) 309–319.
[28]E.P. Barrett, L.G. Joyner, P.P. Halenda, J. Am. Chem. Soc. 73 (1951) 373–380.
[29]G. Horvath, K.J. Kawazoe, Chem. Eng. Jpn. 16 (1983) 470–475.
[30]H.P. Boehm, in: D.D. Eley, H. Pines, P.B. Weisz (Eds.), Chemical Identification of Surface Groups, Advances in Catalysis, vol. 16, Academic Press, 1966, 2016, pp. 179–274.
[31]G. De la Puente, J. Pis, J. Menendez, P. Grange, J. Anal. Appl. Pyrol. 43 (1997) 125–138.
[32]J.L. Figueiredo, M.F.R. Pereira, M.M.A. Freitas, J.J.M. Orfao, Carbon 37 (1999) 1379–1389.
[33]C. Julcour Lebigue, C. Andriantsiferana, N. Krou, C. Ayral, E. Mohamed, A.M. Wilhelm, H. Delmas, H.L. Le Coq, C. Gerente, K.M. Smith, S. Pullket, G.D. Fowler, N.J.D. Graham, J. Environ. Manage. 91 (2010) 2432–2439.
[34] Hach Company, DR/2500 Spectrophotometer procedure Manual, fourth ed., in: Oxygen Demand, Chemical: Reactor Digestion Method, 2003. [35]C. Andriantsiferana, C. Julcour-Lebigue, C. Creanga-Manole, H. Delmas, A.M.
Wilhelm, J. Environ. Eng. 139 (2013) 402–409.
[36]C. Julcour-Lebigue, N.J. Krou, C. Andriantsiferana, A.M. Wilhelm, H. Delmas, Ind. Eng. Chem. Res. 51 (2012) 8865–8874.