OATAO is an open access repository that collects the work of Toulouse
researchers and makes it freely available over the web where possible
Any correspondence concerning this service should be sent
to the repository administrator:
[email protected]
This is an author’s version published in: http://oatao.univ-toulouse.fr/21052
To cite this version:
Pecate, Sebastien and Kessas, Sid Ahmed and Morin,
Mathieu and Hemati, Mehrdji
Beech wood gasification in a
dense and fast internally circulating fluidized bed. (2019) Fuel,
236. 554-573. ISSN 0016-2361
Official URL:
Full Length Article
Beech wood gasi
fication in a dense and fast internally circulating fluidized
bed
Sebastien Pecate
⁎, Sid Ahmed Kessas, Mathieu Morin, Mehrdji Hemati
Laboratoire de Génie Chimique, Université de Toulouse, CNRS, INPT, UPS, Toulouse, France
A B S T R A C T
This study deals to improve the understanding of biomass thermo-chemical conversion in a dense and fast internally circulatingfluidized bed. The experimental rig used in this study ran either as a dense fluidized bed or as a fast internally circulatingfluidized bed. The effect of operating parameters, such as bed temperature (ranging from 750 to 850 °C), steam gas velocity (between 3 and 9.5 times the minimumfluidization velocity of bed material), steam to biomass mass ratio (ranging from 0.7 to 5.6kg.kg−1) and biomass shape (sawdust and pellets) is investigated in both dense and fast internally circulatingfluidized bed with olivine as bed material. In addition, the effect of bed material nature (olivine and sand) is also studied. Results indicated that syngas composition is strongly dependent on steam to biomass mass ratio. Moreover, it was found that syngas yield is favored by rising bed temperature and steam to biomass mass ratio while it is disadvantaged whenfluidizing gas velocity increases. In addition, a greater syngas yield was obtained with olivine particles, compared to sand particles. The effect of bed material circulation flow rate was also investigated in fast internally circulating fluidized bed. Results showed that an increase in this parameter leads to a lower syngas yield. Finally, the experimental results presented in this paper were compared to ones reported in the literature and a good agreement was found.
1. Introduction and state of art
High temperature biomass gasification (> 700 °C) is a promising
alternative to fossil fuels for the synthesis of highly energetic products via Fischer Tropsch or methanation processes. One of the most en couraging and advanced technology is Fast Internally Circulating
Fluidized Bed (FICFB)[1]. Its principle relies on the circulation of bed
material (catalytic or not) which acts as a heat carrier between an en
dothermic reactor (called gasifier) where biomass steam gasification in
densefluidized bed produces synthetic gas (syngas) and an exothermic
transported bed reactor (called combustor) where combustion of a part of the solid carbonaceous residue of biomass gasification (char) pro duces heat. Several demonstrators exist or are in construction to vali date this technology and take it to an industrial level.
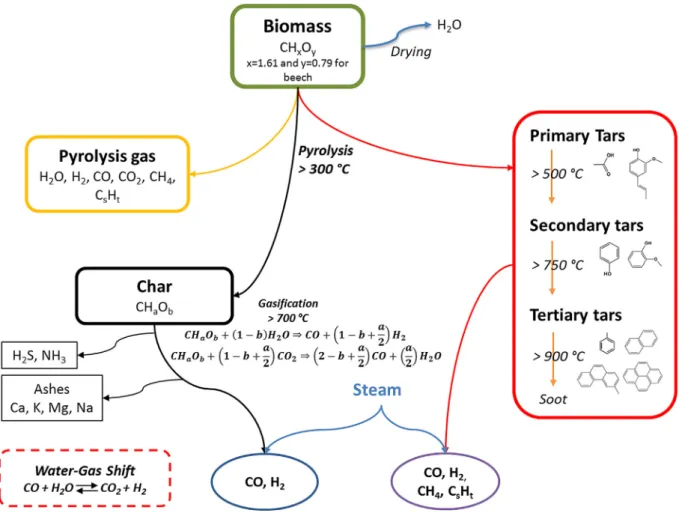
Biomass steam gasification is a thermochemical conversion occur
ring at high temperatures with many simultaneous reactions. Fig. 1
presents a simplified diagram which describes biomass transformation in successive steps.
Starting at 300 °C, the thermal decomposition of biomass, called pyrolysis or devolatilisation, occurs in the absence of oxygen and leads to the formation of:
•
Non condensable products (H2, CO, CO2, CH4and CsHt);•
Volatile condensable products (steam, and primary tars in the formof CnHmOq[2]. Beyond 500 °C, primary tars are converted to non
condensable species (H2, CO, CO2, CH4) and secondary tars in the
form of CnHmOq or CnHm[2 4]. According to Hosoya et al. [5],
chemical functional groups like acids, methoxy, propyl, propenyl, aldehydes and acetyl are eliminated, leaving only aromatic com pounds such as cresol and phenol, which constitute the main part of secondary tars. Above 700 °C, secondary tars undergo thermal cracking. In addition, tars can react with gaseous atmosphere in the
reactor, like H2O, CO2and H2, by steam reforming, CO2reforming
and hydrodeoxygenation, respectively. These reactions lead to non
condensable gases (H2, CO, CO2, CH4) as well as mono and poly
aromatics, called tertiary tars, in the form of CnHm[2,6 10]):
+ − = > + − +
Tars steam - reforming: C H On m q (n q)H O2 (m/2 n q)H2 nCO (R1)
+ − = > + −
Tars CO - reforming: C H O2 n m q (n q)CO2 (m/2)H2 (2n q)CO (R2)
+ − + = > +
Tars hydrodeoxygenation: C H On m q (2n m/2 q)H2 nCH4 qH O2 (R3) Tertiary tars are the most refractory tars regarding thermal cracking reactions, which were found to lead to the formation of many alkenes
like C2H2, C2H4and C2H6[11 13]. Besides, tertiary tars can also un
dergo steam reforming as well as steam and hydrodealkylation,
leading to the formation of non condensable species, such as CH4, H2
and CO, and lighter tars. For instance, Taralas et al. [14] proposed
overall steam and hydrodealkylation reactions schemes for toluene:
+ = > + ∘ = − −
Toluene hydrodealkylation: C H7 8 H2 C H6 6 CH ΔH(850 C)4 184.4 kJ. mol1
(R4)
+ = > + + ∘ = −
Toluene steam - dealkylation: C H7 8 H O2 C H6 6 2H2 CO ΔH(850 C) 40.8 kJ. mol1
(R5)
It must be precised that reactionsR(1) and R(5)strongly depend on
steam partial pressure.
•
A solid carbonaceous residue called char. Morin et al. [15] investigated the effect of the temperature on the composition of char
produced by fast pyrolysis in a densefluidized bed. The used bio
masses were beech pellets and beech sticks, with chemical formula
in the form of CH1.63O0.79and CH1.71O0.76, respectively.
Higher carbon content and lower hydrogen and oxygen contents were found for increasing temperatures. For instance, for a bed temperature of 850 °C, char is mainly made of carbon with a chemical formula in the
form of CH0.09O0.06. For these reasons, some authors considered char as
pure carbon[16 18]. Above 700 °C, char reacts with steam to produce
hydrogen and carbon monoxide according to:
+ = > + ∘ = −
Char steam - gasification: C H O2 CO H ΔH(850 C)2 135.6 kJ. mol1 (R6) Besides, char can react with carbon dioxide according to:
+ < = > ∘ = −
Boudouard reaction: C CO2 2CO ΔH(850 C) 169.2 kJ. mol 1
(R7) Tars cracking reactions can lead to the formation of a carbonaceous
solid, called coke, at the surface of the bed material[19 22]. This solid
will either react with steam, in the gasifier, to form CO and H2, or burn
in the combustor. In addition, these coking reactions can lead to the
formation of soot[23 24].
Steam can also react with carbon monoxide according to:
+ < = > + ∘ = − −
Water - Gas Shift reaction: CO H O2 CO2 H ΔH(850 C)2 33.6kJ. mol1
(8) The required syngas quality constitutes the main technical and
economic challenges for its optimal valorization. The H2over CO ratio
is an important parameter for catalytic applications like Fisher Tropsch
(H2/CO > 2) or methanation (H2/CO > 3). The presence of other
species such as methane can be an advantage for methanation, but also reduces the yield of Fischer Tropsch processes. Besides, refractory tars and inorganic compounds, which are systematically formed, have to be removed to very low concentrations before the downstream processes. List of symbols
Ar Archimedes number ( )
Cv coefficient of variance ( )
D wood pellets diameter (m)
d10, d50, d90 particle size distribution (m)
d3/2(or dp) Sauter mean particle diameter (m)
d4/3 volume particle equivalent spherical diameter (m)
dchar char particle diameter (m)
dp particle diameter (=d3/2) (m)
Fdaf,B dry ash free biomass feeding rate (kg.h−1)
FH2O steam massflow rate (kg.h−1)
FH2O/Fdaf,B steam to biomass mass ratio (kg steam. kg−1dry ash free biomass)
Fp circulating solid massflow rate (kg.h−1)
g acceleration due to gravity (m.s−2)
H2/CO ratio between H2 and CO molar flow rates in the dry
syngas without tracer ( )
HHV higher heating value of the biomass (kJ. kg−1dry ash free
biomass)
L wood pellets length (m)
LHV lower heating value of the biomass (kJ. kg−1dry ash free
biomass) or of the syngas (kJ. Nm−3dry syngas without
tracer)
MB biomass molar weight (kg.mol−1)
NcBed amount of carbon retained in the bed as char (mol)
NcBiomass amount of carbon fed in the gasifier as biomass (mol)
NcCyclone amount of carbon elutriated as char and recovered in the cyclone (mol)
amount of carbon leaving the gasifier as part of the dry syngas (mol)
Ṅc Syngas
instantaneous molar carbonflow rate leaving the gasifier
as part of the dry syngas (CO, CO2, CH4, C2H2, C2H4and
C2H6) (mol.h−1)
NcTar amount of carbon converted into tars (mol)
Ṅdaf B, instantaneous molarflow rate of carbon entering the re
actor as biomass (mol.h−1)
Ni molarflow rate of component i (mol.h−1)
PG syngas yield (Nm3dry syngas without tracer. kg−1dry ash
free biomass)
Pi yield of the component i (Nm3component i. kg−1dry ash
free biomass)
Remf Reynolds number at the minimumfluidization point ( )
TG gasifier bed temperature (°C)
texp duration of an experiment (h)
U gas velocity in the gasifier (m.s−1)
Umf minimumfluidization velocity (m.s−1)
Ut,char char terminal settling velocity (m.s−1)
V̇i volumetricflow rate, at STP conditions, of component i
(Nm3.h−1)
Vm molar volume of a gas, at STP conditions (Nm3.mol−1)
V̇N2 volumetric flow rate, at STP conditions, of tracer gas
(Nm3.h−1)
V̇T total volumetricflow rate, at STP conditions, of gas at the
reactor outlet (Nm3.h−1)
XcG carbon conversion rate ( )
yi molar fraction (content) of the component i in the dry
syngas without tracer ( ) Greek symbols
γ compressibility factor (%)
F
ΔB uncertainty of the biomass feeding rate (kg.h−1)
F
ΔN2 uncertainty of the tracer gas volumetric flow rate
(Nm3.h−1)
ΔH enthalpy of reaction (kJ.mol−1)
X
Δ ash uncertainty of the ash content in the biomass (%)
X
Δ H uncertainty of the moisture content in the biomass (%)
Y
Δ uncertainty of a given performance criteria (same unit as
the performance criteria)
y
Δi uncertainty of each component molar fraction (%)
εBA aerated bulk bed voidage ( )
μf fluid viscosity (kg.m−1.s−1)
ρBA aerated bulk density (kg.m−3)
ρBP packed bulk density (kg.m−3)
ρf fluid density (kg.m−3)
ρp particle apparent density (kg.m−3)
ρs particle skeletal density (kg.m−3)
χ Internal voidage (%)
1.1. Influence of operating parameters on steam gasification
In order to improve the understanding of biomass thermo chemical conversion, several studies were devoted to the influence of some op erating parameters on gasification performance (i.e. syngas composi
tion and yield). InTable 1are reported the experimental investigations,
found in the literature, on the effect of the bed temperature between 700 and 900 °C, on syngas composition and yield. Experiments were
carried out in densefluidized beds (DFB) as in FICFB. The authors used
a large diversity of bed material: sand, olivine, Nickel enriched olivine, Nickel based catalyst, and even no bed material. Several biomasses were also investigated, such as wood pellets, hemlock sawdust, almond shells, eucalyptus, pines wastes, holm oak, oak sawdust, and rice husk.
The results presented in Table 1 show that an increase in the bed
temperature leads to:
•
Higher syngas yield PGand carbon conversion rate into syngas XcG.This phenomenon is explained by: (i) a higher production of non condensable gases in the pyrolysis step at higher temperatures, as
pointed out by Hemati et al.[16], (ii) the production of gas through
the endothermal char steam gasification reaction, which is favor able at elevated temperatures and (iii) the increase of gas yield re sulting from the steam reforming and cracking of heavier hydro
carbons and tars when the bed temperature is increased[25];
•
Higher H2content and lower C2Hxand tar contents[25 31].However, some noteworthy divergences are observed, inTable 1,
regarding the effect of bed temperature on CO, CO2and CH4contents.
When the bed temperature increases, the evolution of these components seems to depend on two additional parameters: the type of used bio
mass and the bed material nature. For instance, Franco et al.[25]in
vestigated the effect of bed temperature on the steam gasification of three types of biomass. It was found that the bed temperature has a
great influence on the composition of syngas resulting from eucalyptus
gasification whereas it has only a moderate effect on pine wastes and holm oak conversion. In addition, literature studies on the effect of bed
material on biomass gasification is extensive and has been discussed in
several reviews[32 34]. It was shown that Ni based catalysts are the
most performant, regarding olivine, to promote tars destruction by cracking and steam reforming reactions and CO conversion by water gas shift reaction, while sand is considered as an inert reference. Thus, this catalytic activity directly affects syngas composition.
The effect of steam to biomass mass ratio (also called steam to fuel
ratio) on biomass steam gasification was also investigated in dense
fluidized bed as in fast internally circulating fluidized bed processes.
Table 2presents the experimental investigations, reported in the lit
erature, about the effect of this parameter between 0.18 and 1.1
kgsteam.kgbiomass−1. Several bed materials were used: sand, olivine, Nickel enriched olivine and natural catalyst. Besides, different bio masses were also tested: wood pellets, almond shells and pine wastes.
The results reported inTable 2show that an increase in the steam to
biomass mass ratio leads to:
•
A linearly increase in H2content;•
A decrease in tar content [27,35] and a rise in syngas yield[25,27,28]. These results were explained by the fact that steam Fig. 1. Simplified diagram of biomass thermochemical conversion.
gasification, water gas shift and tars cracking and steam reforming reactions are promoted by an increase in steam to biomass ratio.
Different trends regarding the effect of this parameter on CO, CO2
and CH4contents were found. Franco et al.[25], Rapagna et al.[27],
Hofbauer et al.[35]and Pfeifer et al.[28]found a linear increase in
CO2content and a linear decrease in the one of CO. For a ratio rising
from 0.7 to 0.85 kgsteam.kgbiomass−1, the same trends were observed by
Koppatz et al.[31]. However, beyond 0.85 kgsteam.kgbiomass−1, the CO
content remains at the same value while the CO2content decreases.
Regarding CH4content, when steam to biomass mass ratio rises, it re
mains constant according to Rapagna et al.[27], Koppatz et al.[31]
and Hofbauer et al.[35]and decreases in the work of Franco et al.[25]
and Pfeifer et al.[28].
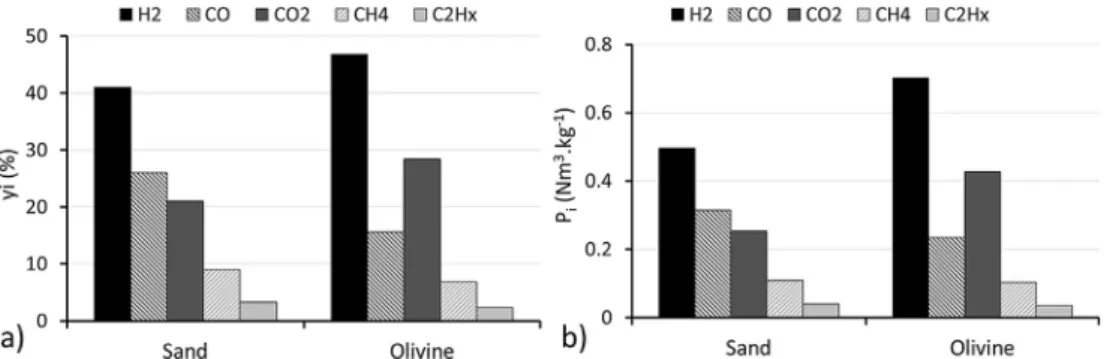
1.2. Influence of bed material on steam gasification:
Various catalysts were investigated in biomass gasification for tar
conversion and were discussed in several papers[32 34,36,37]. Three
of them are the object of many researches: dolomite, Nickel based catalysts and olivine. Dolomite is found to be the best catalyst for tar
cracking reactions[27,38 42]. However, the fragility of this material
regarding attrition phenomenon restrains its use in fluidized beds.
Nickel based catalysts are also very effective for tar cracking. Never
theless, many authors showed that they are quickly deactivated by a carbon deposition on the surface or sulphur poisoning, which is a major
problem for their use in biomass conversion processes[43 46]. Olivine
is the most used catalytic bed material in the biomass conversion pilot plants. It is a mineral containing magnesium, iron and silicium oxides. In addition to be an excellent heat transfer medium, olivine has good
thermal stability and attrition resistance[31,47 52]. In order to high
light the catalytic effect of olivine, some authors compared the results of biomass gasification in fluidized bed using olivine and silica sand
particles as bed material[27,31,48,50,52 55].Table 3reports the op
erating conditions, the type of reactor and the biomass nature used in
these studies. These experimentalfindings showed that the use of oli
vine instead of silica sand particles leads to a lower tar content, a
greater syngas yield, an increase in the H2and CO2contents and a
decrease in the ones of CO and CH4. The authors attributed these trends
to the catalytic properties of olivine regarding tar and hydrocarbons decomposition, and water gas shift reactions. In order to quantify the
effect of the catalytic behavior of olivine particles, Devi et al.[48]made
passed a slipstream from a lab scale atmospheric bubblingfluidized bed
gasifier through a secondary fixed bed reactor containing a mixture of
sand and olivine at 900 °C. By analyzing the tar concentration at the inlet and at the outlet of this reactor, the authors found that the pre
sence of olivine in thefixed bed promotes tar conversion. For instance,
a decrease of 48% in heavy polyaromatic compounds content was ob served with pure sand. An addition of 17 wt% of olivine to the sand leads to a decrease of 71%. The authors related the catalytic activity of olivine to its iron content.
The overall objective of this study is to better understand and characterize the influence of operating parameters, such as bed tem perature (ranging from 750 to 850 °C), steam gas velocity (between 3
and 9.5 times the minimumfluidization velocity of bed material), steam
to biomass mass ratio (ranging from 0.7 to 5.6kg.kg−1) and biomass
shape (pellets and sawdust) on the performance of biomass gasification
in a densefluidized bed reactor (DFB) as well as in a fast internally
circulatingfluidized bed (FICFB). In addition, the effect of bed material
nature (olivine and sand) and bed material circulationflow rate is in
vestigated in DFB and in FICFB, respectively. In this study, the reactor used is a biomass gasification FICFB unit designed and built up at the “Laboratoire de Génie Chimique” in Toulouse, which can run either in a FICFB mode or in a DFB mode, as a stand alone reactor, by dis connecting the gasifier from the circulation loop.
Table 1 Literature review on the eff ect of bed temperature on syngas composition and yield. Authors Type of reactor FH2O /F daf,B ( kg.kg − 1) Bed material Type of biomass Bed temperature (°C) yH2 (%) yCO (%) yCO2 (%) yCH4 (%) yC2Hx (%) Tar content (g.Nm − 3) PG (Nm 3.kg − 1) Xc G (%) [31] FICFB 0.84 Olivine Wood pellets 770 = > 850 36 = > 40 28 = > 25 ≈ 18 ≈ 10 2.7 = > 2 11 = > 6 n.r. n.r. [28] FICFB 0.6 Nickel enriched olivine Wood pellets 750 = > 850 850 = > 900 n.r. n.r. n.r. n.r. n.r. n.r. n.r. n.r. n.r. n.r. 4.5 = > 1.2 1.2 = > 0.9 0.9 = > 1 1 = > 1.1 n.r. n.r. [29] FICFB n.r. Ni-based catalyst Hemlock sawdust 718 = > 815 9 = > 13 30 = > 41 54 = > 37 6 = > 8 n.r. n.r. 2.4 = > 3.1 n.r. [27] DFB 1 Olivine Almond shells 700 = > 820 ≈ 49 21 = > 23 ≈ 5 ≈ 8 n.r. 6 = > 0.5 1.2 = > 1.9 n.r. [25] DFB 0.8 Sand Eucalyptus Pine wastes Holm-oak 700 = > 900 22 = > 42 27 = > 33 36 = > 46 40 = > 30 41 = > 37 32 = > 30 ≈ 15 13 = > 15 17 = > 19 13 = > 9 13 = > 11 10 = > 6 6= > 1 5= > 3 4= > 1 n.r n.r. n.r. 0.7 = > 1.2 n.r. n.r. 65 = > 70 n.r. n.r. [26] DFB 2.7 Sand Ni-based catalyst Oak sawdust 700 = > 900 700 = > 850 28 = > 34 57 = > 58 42 = > 38 20 = > 22 16 = > 13 19 = > 16 ≈ 10 4= > 3 4.6 = > 3.6 1 = > 0.8 n.r. n.r. 0.6 = > 1.1 1.5 = > 2 50 = > 82 71 = > 91 [30] Entrained fl ow reactor (air) n.r. No bed material Rice husk 700 = > 900 12 = > 20 52 = > 42 30 = > 35 ≈ 4 1.2 = > 0.2 n.r. 1.2 = > 1.4 n.r. n.r.: not reported.
2. Materials and methods 2.1. Experimental rig
Biomass, initially stored in a hermetic hopper, is continuously fed in
a densefluidized bed (Gasifier), by a vibrating extractor and a screw
feeder (Fig. 2). In order to avoid heating the biomass in the screw
feeder, the latter is cooled down by cold water circulating in a double
jacket. The vibration frequency sets the feeding biomass massflow rate
while the rotation speed of the screw feeder is at its maximum value to
make biomass feeding as continuous as possible. The gasifier is flui
dized by super heated steam, entering the reactor at 280 °C. In the gasifier, biomass gasification leads to the formation of gases and of a
carbonaceous residue (char). At the outlet of the gasifier, elutriated
particles (bed material, char and ashes) are separated from gases by a cyclone. Solids, containing bed material and unconverted char, are
continuously discharged from the gasifier, through a dump, to a
transportedfluidized bed reactor (Combustor), fed by two streams of air
pre heated up to 600 °C. Thefirst stream (primary air) ensures a dense
fluidized bed of bed material at the bottom of the combustor. The second stream (secondary air) is used for particles transport. It is fed by an injection cane located 150 mm above the primary air distributor. In
this reactor, the combustion of a part of the char from the gasifier in
duces bed material heating. At the outlet of the combustor, particles are
separated fromflue gas by a cyclone and are returned back to the ga
sifier through a standpipe, equipped with an L valve placed on the base
and fluidized by steam. Thus, the heat needed for the endothermic
biomass steam gasification is provided by the ex situ combustion of the
residual char. Besides, this reactor can be used as a densefluidized bed,
by disconnecting the gasifier from the bed material circulation loop.
The reactors are stainless steel cylindrical columns. The gasifier has
an inner diameter of 214 mm and a total height of 2.5 m, while the combustor has an inner diameter of 104 mm and a total height of 7.0 m. Both gasifier and combustor are surrounded by electric furnaces with 15 kW and 5.7 kW electric power, respectively. The bed temperatures in
the gasifier and in the combustor are controlled by PID controller.
Nevertheless, a natural gas feeding is required in the combustor in order to reach temperatures up to 900 °C in the setup. It is introduced 40 cm above the distributor.
The pilot plant is equipped with 23 pressure sensors and 20 tem
perature sensors. The bed material circulation massflow rate is mea
sured with a micro wave probe (supplier: SWR Engineering, model: SolidFlow 2.0), previously calibrated, located in the standpipe, 50 cm
below the base of the combustor cyclone (Fig. 2).
At the outlet of each reactor, a burner associated with a post com bustion chamber heated up to 850 °C allows burning all combustible gas. Then, gas streams are mixed together in a cylindrical chamber and cooled down in a 5 m multitubular heat exchanger. A cyclone and a bag filter ensure the filtration of fine particles before rejecting gas into at mosphere.
Non condensable gas composition is measured at the outlet of the gasifier cyclone, by means of an online micro Gas Chromatograph
Agilent 490. The analyzed components are H2, N2, O2, CO, CH4, CO2,
C2H2, C2H4and C2H6. Sample gases are sucked by a vacuum pump
connected to aflowmeter (volume flow 100 mL.min−1at STP). Before
entering the analyzer, the gas passes through a cyclone in order to re tain the biggest particles entrained. Then, it goes through a condenser
and a wash bottle cooled at 20 °C to remove any trace of water and
tars. Finally, thefinest particles are separated from gas by a metallic
filter. The time lapse between two quantifications is 2 min.
Performing an energetic balance on this experimental rig is complex because of the lack of energy recovery systems and the significant
Authors Type of
reactor
Type of biomass
Bed material Bed temperature
(°C) FH2O/Fdaf,B (kg.kg 1) yH2 (%) yCO (%) yCO2 (%) yCH4 (%) yC2Hx (%) Tar content (g.Nm 3) PG (Nm3.kg 1)
[35] FICFB Wood pellets Natural catalyst 850 0.18 = >
0.62 34 = > 35 33 = > 27 15 = > 19 ≈ 10 n.r. 7.5 = > 2.5 n.r.
[28] FICFB Wood pellets Nickel enriched
olivine 850 0.3 = > 0.9 41 = > 45 28 = > 26 19 = > 21 9 = > 7 n.r. n.r. 0.97 = > 1.08
[31] FICFB Wood pellets Olivine 850 0.7 = >
0.85 0.85 = > 1.1 39 = > 40 40 = > 41 30 = > 25 ≈ 25 15 = > 20 20 = > 18 ≈ 9 ≈ 9 n.r. n.r. n.r. n.r. n.r. n.r. [27] DFB Almond shells Olivine 820 0.5 = > 1 47 = > 49 31 = > 25 15 = > 20 ≈ 7 n.r. 1.2 = > 0.5 1.8 = > 1.85
[25] DFB Pine wastes Sand 800 0.5 = > 0.8 20 = >
30 45 = > 38 12 = > 15 14 = > 12 n.r. n.r 0.8 = > 1 n.r.: not reported. Table 3
Literature review on the effect of olivine as bed material on biomass gasification performance.
Authors Experimental setup
(fluidizing agent)
Type of biomass Biomassflow rate
(kg.h 1)
Steam to biomass ratio (kg.kg 1)
Bed inventory (kg) Bed temperature (°C)
[27] DFB (steam) Almond shells 0.3 1 0.6 770
[52] DFB (air + steam) Sewage sludge 0.084 0.5–1 0.1 750–850
[50] DFB (air + steam) Spruce wood pellets n.r. 0.65 3–5 780
[31] FICFB (steam) Wood pellets 20 0.8–1 100 850
[54] FICFB (air) Sunflower and willow pellets 6.8–8 0 n.r. 750–800
[55] DFB and FICFB (steam) Wood pellets 10 0.2–0.8 45 750–900
[53] Conical spouted bed (steam) Pine wood sawdust 0.09 1 0.07 900
[48] DFB for tar cracking only Tar from beech wood
air-gasification
– – 0.048 800–900
Table 2
thermal loss, mainly explained by the very high ratio of surface and volume of the experimental set up compared to the industrial plant and
the poor quality of insulation. Nevertheless, a recent study[56]focused
on the performance of a FICFB biomass gasifier associated to a me thanation process showed that this type of process is thermally self
sufficient and can reach a cold gas efficiency higher than 71%.
2.2. Feedstock
The experiments in this study were carried out with beech sawdust and beech pellets particles as biomass. Both beech sawdust and pellets are from the same wood batch. Beech pellets were obtained from sawdust pelleting.
The proximate analysis of the biomasses was carried out following the standard test method for chemical analysis of wood charcoal D 1762 84. In addition, the elemental analysis was also performed fol lowing the MA E2 02, MA E2 12 and MA E2 13 standard test methods. The same results were found for both beech sawdust and pellets, re
ported in Table 4. Besides, it is found that the ash content and the
moisture are 1.6% and 10.9%, respectively. According to the supplier,
the dry biomass LHV is 17710kJ.kg−1. From the elemental analysis, a
chemical formula for beech wood is proposed: CH1.34O0.65, with a
molar weight of MB= 23.68.10−3kg.mol−1.
The size distribution of a representative sample of beech sawdust
was determined using a Laser Diffraction Particle Sizing MS2000
(Table 5). Results show that the beech sawdust batch is made of Fig. 2. Schematic diagram of the installation.
Table 4
Biomasses proximate and elemental analysis.
Proximate analysis (wt% dry basis) Ash content = 1.8 Moisture = 10.9 Volatile matters = 75.1 Fixed carbona= 12.4
Elemental analysis (wt% dry basis) C = 50.54 H = 5.64 O = 43.53 N = 0.25
Dry LHV = 17710kJ.kg 1Dry HHV = 18910kJ.kg 1
particles heterogeneous in size, with diameters between 200 and 1500 µm, and a mean Sauter diameter of 497 µm. Besides, beech saw dust apparent density was assumed to be the same as the one of beech wood. The density of the latter was measured from the weigh and vo lume of a single particle of beech stick. Regarding pellet particles, they have a mean diameter of 6 mm and a mean length of 15 mm. Pellet apparent density was measured from the weight and volume of a single cylindrical particle of beech pellet. It is shown that the pelleting step leads to a higher wood apparent density.
2.3. Bed material pre treatment and characterization
Most of the experiments presented in this study were carried out with olivine particles, provided by the Austrian manufacturer Magnolithe GmbH, as bed material. Nevertheless, some tests were also
performed with sand particles. As shown inTable 6, olivine particles
are essentially made of magnesium oxide, silicium oxide and iron oxide. The latter reaches 10.5 wt% in our case. Regarding sand particles, they are mainly made of silicium oxide. Before their use as bed material in the gasifier, the particles previously undergo:
•
Afine elutriation step. In this step, the undesired fine particles areremoved by elutriation, at ambient temperature during 20 h;
•
A calcination step, at 850 °C during 4 h.During these stages, carried out in the gasifier, the gas velocity was
maintained at 8 times the minimumfluidization velocity (U = 8∙Umf) at
the considered temperature. After this pretreatment stage, particle size distribution, particle density, skeletal density, aerated bulk density, packed bulk density, angle of repose, internal voidage, specific surface
area and shape factor were measured using Laser Diffraction Particle
Sizing MS2000, Mercury Porosimetry, Hosokawa analyzer, Helium Pycnometry, BET analyzer and G3 Morphology, respectively. Results
are reported in Table 6. Based on the values of the mean Sauter dia
meter and particle density for both sand and olivine, it can be con cluded that the particles used in this work belong to the Geldart class B. Besides, the particles employed are lowly porous, with internal voidage of 9% and 7% for sand and olivine particles, respectively.
In this work, Sauter diameter (d3/2) is considered as the mean
particle size.
Moreover, a recent study focused on the hydrodynamic behavior of
a dense fluidized bed of olivine particles in the gasifier used in this
study[57]. The effect of bed temperature (between 20 and 950 °C),
particle size (between 282 and 689 µm) andfluidizing gas nature (air or
steam) on the minimum fluidization velocity (Umf) was investigated.
From the experimental results, a correlation was proposed to predict this hydrodynamic parameter according to the operating conditions.
This correlation also well estimates the minimumfluidization velocity
of sand particles. = + − Remf (20.322 0.031·Ar)0.5 20.32 (1) with:Remf = and:Ar= − ρ U d μ g d ρ ρ ρ μ · · · · ·( ) f mf p f p f p f f 3 2
Table 7 reports the minimumfluidization velocity of olivine and
sand particles, calculated from Equation(1)between 750 and 850 °C,
with steam asfluidizing gas.
Mixing and segregation phenomena between biomass and bed par ticles are of fundamental importance since they are usually responsible
of the good or bad operating of the reactor. Hemati et al.[58]studied
the mixing and segregation behavior of oak sawdust (d3/2= 370 µm,
ρp= 500 kg.m−3) in afluidized bed of sand particles (d3/2= 300 µm,
ρp= 2600 kg.m−3) at ambient temperature. The authors found a good
biomass sand mixing for gas velocities higher than 2.5 times the
minimum fluidization velocity of sand particles (U = 2.5∙Umf). Later,
Detournay[59]investigated the behavior of beech pellets (D = 6.2 mm,
L = 10 mm,ρp= 1040 kg.m−3) and char pellets (D = 4 mm, L = 9 mm,
ρp= 600 kg.m−3) mixed with olivine particles (d3/2= 265 µm,
ρp= 2965 kg.m−3). The char pellets were obtained from the pyrolysis
of wood pellets at 650 °C under inert atmosphere (nitrogen). The ex periments were performed at ambient temperature, in an altuglass column having the same diameter as the reactor used in this study. The
effect of the fluidizing gas velocity was investigated. The experimental
results showed that beyond 2 times the minimumfluidization velocity
of olivine (U = 2∙Umf), the solid particles mixing quality is fairly af
fected by the gas velocity. These results were furtherly confirmed by
Cluet et al.[60], who studied the mixture between olivine particles (d3/
2= 237 µm,ρp= 3250 kg.m−3) and cylindrical beech wood (dowels,
D = 8 mm, L = 25 mm,ρp= 685 kg.m−3). The authors found that a gas
velocity higher than 3 times the minimumfluidization velocity of oli
vine (U = 3∙Umf) is required to ensure a fairly good mixing. In the
present work, thefluidizing gas velocity was always higher than, or
equal to, 3 times the minimumfluidization velocity of bed material.
2.4. Performance criteria
During each experiment, afixed nitrogen volumetric flow rateV̇N2,
at Standard Temperature and Pressure conditions (STP, 0 °C, 1 atm), is
Biomass Dimensional properties Apparent density (kg.m 3)
Beech sawdust d10= 260 µm d50= 771 µm d90= 1454 µm d3/2= 497 µm d4/3= 763 µm 733
Beech pellets D (mm) × L (mm): 6–15 1050
Table 6
Bed material properties.
Type of particle Sand Olivine
Chemical formula SiO2 (Fex, Mg1 x)2SiO4
Composition SiO2: 98.34% Fe2O3: 0.022% Al2O3: 1.206% TiO2: 0.03% CaO: 0.014% K2O: 0.745% MgO: 47.5– 50.0% SiO2: 39.0– 42.0% CaO: max. 0.4% Fe2O3: 8.0– 10.5% Skeletal densityρs(kg.m 3) 2650 3265 Internal voidageχ (%) 9 7
Apparent particle densityρP(kg.m 3) 2400 2965
Aerated bulk densityρBA(kg.m 3) 1519 1344
Packed bulk densityρBP(kg.m 3) 1643 1500
Aerated bulk bed voidageεBA(–) 0.49 0.55
Angle of repose (°) 33.2 29.6 Compressibility factor: γ = 100. (ρBP-ρBA)/ ρBP(%) 8 10 Shape factor (–) – 0.85 d10(µm) 190 188 d50(µm) 305 300 d90(µm) 488 475 d3/2(µm) 285 282 d4/3(µm) 324 318 Cv= (d90- d10)/d50(–) 0.98 0.96
Specific surface area (m2.g 1) – 0.73
Table 5
introduced in the gasifier as tracer gas. Besides, the composition of the non condensable gases was analyzed as a function of time from the
continuous micro Gas Chromatograph. The total volumetricflow rate of
dry gas at the reactor outlet, at STP conditions, is given by: = V t V y t ̇ ( ) ̇ ( ) T N N 2 2 (2)
whereV tṪ ( )is the temporal total gas volumetricflow rate (Nm3.h−1),
V̇N2 is the volumetric flow rate of nitrogen introduced as tracer gas
(Nm3.h−1) and yN2( )t is the volume or molar fraction of nitrogen
measured at the reactor outlet.
Then, the volumetricflow rate of each component is calculated as
follows: =
V ti̇ ( ) y t V ti( )· ̇ ( )T (3)
where V ti̇ ( )andy ti( )are the temporal volumetricflow rate (Nm
3.h−1) and volume fraction of component i, respectively.
The dry gas analyzed at the reactor outlet is made of tracer (N2) and
dry syngas (H2, CO, CO2, CH4, C2H2, C2H4and C2H6). Thus, the syngas
total yield (PG), corresponding to the dry syngas volume produced per
kg of dry ash free biomass introduced in the reactor, can be calculated at STP conditions as follows: =∑≠ P t V t F ( ) ̇ ( ) G i N i daf B 2 , (4)
where PG(t) is the temporal syngas yield (Nm3.kg−1) and Fdaf,Bis the
dry ash free biomass feeding rate (kg.h−1).
Similarly, each component yield (Pi) is defined as:
= P t V t F ( ) ̇ ( ) i i daf B, (5)
where P ti( )is the temporal yield of component i (Nm3.kg−1).
Besides, the molarflow rate of each component is given by:
= N t V t V ( ) ̇ ( ) i i m (6)
whereN ti( )is the temporal molarflow rate of component i (mol.h−1),
and Vm is the molar volume of a gas at STP conditions (=0.0224
Nm3.mol−1).
Then, the carbon conversion rate, being the ratio between the carbon amount in the produced dry syngas and the carbon amount in the biomass fed in the reactor, is calculated as follows:
= ∑ ℵ X t N t F M ( ) ( ( )· ) / cG i i iC daf B, B (7)
where XcG( )t is the temporal carbon conversion rate,ℵiCis the carbon
atom number in the component i (i = CO, CO2, CH4, C2H2, C2H4, C2H6),
and MBis the biomass molar weight (0.02368 kg.mol−1).
Moreover, the H2/CO molar ratio is calculated as the ratio between
the molarflow rate of H2and the one of CO.
Besides, the syngas composition used in this study in order to in terpret the experimental results is defined as the dry gas composition measured by the online micro Gas Chromatograph, without tracer. Thus, the volume fraction of each component i in the dry syngas is defined by: = − y t y t y t ( ) ( ) 100 ( ) i syngas i N2 (9)
where yisyngas( )t is the temporal volume fraction of component i.
Finally, from the dry syngas composition, the dry syngas lower heating value (LHV) non diluted by the tracer is calculated. It depends
on the LHV of each component in the syngas, reported inTable 8.
∑
=
LHV t( ) LHV yi·i ( )t syngas
(10) where LHV(t) is the temporal dry syngas lower heating value
(kJ.Nm−3) and LHVi is the lower heating value of component i
(kJ.Nm−3).
It is important to precise that the experimental results presented in this study are average values of the results measured and calculated during at least 1 h in stable steady state regime.
In order to assess the amount of carbon converted into tars, carbon balance throughout the gasifier is performed. It is made of the following terms:
•
The cumulated carbon amount fed in the gasifier as biomass,NcBiomass(mol);
•
The cumulated carbon amount leaving the reactor as part of the drysyngas (CO, CO2, CH4, C2H2, C2H4and C2H6), (mol);
•
The carbon elutriated as char and recovered in the cyclone NcCyclone(mol). A new container for particles elutriated recovering is placed on the base of the cyclone as soon as the stable steady state regime starts. After the experiment, the particles recovered are burnt 8 h at 850 °C in order to determine the amount of carbon elutriated, as suming that char is made of pure carbon;
•
The carbon retained in the bed as char NcBed (mol). In order toquantify char retention in the bed at the end of each experiment, fluidizing gas is switched to air, with a fixed molar flow rate, to burn
all carbonaceous residues. The temporal evolutions of CO and CO2
produced by its combustion lead to the amount of carbon burnt. Thus, in this work, the amount of carbon converted into tars is es timated by:
= − − −
NcTar NcBiomass NcSyngas NcCyclone NcBed (11)
= ∫ = ∫
N N dt N N dt
where cBiomass ̇ . and ̇ .
t daf B cSyngas t c Syngas 0 , 0 exp exp (12)
where NcTaris the carbon amount converted into tars (mol),Ṅdaf B, is the
instantaneous carbonflow rate introduced in the gasifier as biomass
(mol.h−1) and Ṅc
Syngas
is the instantaneous carbonflow rate leaving the
gasifier as syngas (mol.h−1). This value is overestimated since the
amount of char recovered in the cyclone is likely lower than the amount of char really elutriated. Indeed, the cyclone has a cut size of 10 µm and thus does not retain all the particles elutriated.
The uncertainty assessment is carried out for each experiment per formed, using the concepts and procedures reported by Coleman et al.
[62]. In this work, uncertaintyΔY is defined as the experimental error,
being the difference between the experimentally determined value and
the true value of a given performance criteria Y. The experimental uncertainties of the performance criteria defined above depend on the ones of the following parameters:
•
The molar fraction of each component (Δyi). Relative uncertaintiesof each component molar fraction are given inTable 9. The values
Bed temperature (°C) 750 800 850
Olivine Umfwith steam (m.s 1) 0.043 0.041 0.039
Sand Umfwith steam (m.s 1) 0.036 0.034 0.032
Table 8
LHV of each component in the syngas[61].
H2 CO CH4 C2H2 C2H4 C2H6
LHV (kJ.Nm 3) 10,785 12,621 35,798 56,110 59,330 69,674
Table 7
Olivine and sand minimum fluidization velocity, between 750 and 850 °C (fluidizing gas: steam).
reported only depend on the micro Gas Chromatograph accuracy and not on the operating conditions;
•
The biomass feeding rate (ΔFB). Biomass feeding rate in the gasifieris calculated from the evolution of the biomass hopper weight versus time at steady state regime. A maximum relative uncertainty of 15% was estimated for each experiment;
•
The tracer gas volumetricflow rate (ΔFN2). Its relative value wasfound to be between 5 and 10% for all the experiments in both gasifier and combustor;
•
The moisture and ash contents in the biomass (ΔXHandΔXASH). Inthis work, the relative uncertainty of these parameters mainly de pends on the one of the weighing scale used for their determination. The relative uncertainty of the weighing scale used is much lower than 0.01% ( ± 0.01 mg).
Although the biomass feeding rate relative uncertainty seems high, the measured parameters are constant over time when the system is in steady state. As an example, the gas compositions measured during an
experiment are presented over time inFig. A.1, in Appendix A. In ad
dition, some tests are repeated in order to evaluate the reproducibility of the phenomena. From the results, an error can be calculated. In this study, this error is always substantially lower than the experimental uncertainty.
3. Results and discussion
In this study, the influence of the biomass shape, the gasifier bed
temperature (TG), the steam to biomass mass ratio (FH2O/Fdaf,B) and the
steam massflow rate (FH2O) on beech wood gasification is investigated
in a densefluidized bed (DFB) as well as in a fast internally circulating
fluidized bed (FICFB), both made of 60 kg of olivine particles. Besides, the effect of bed material nature is investigated in the DFB with a 60 kg
bed inventory of sand. In addition, the effect of bed material circulation
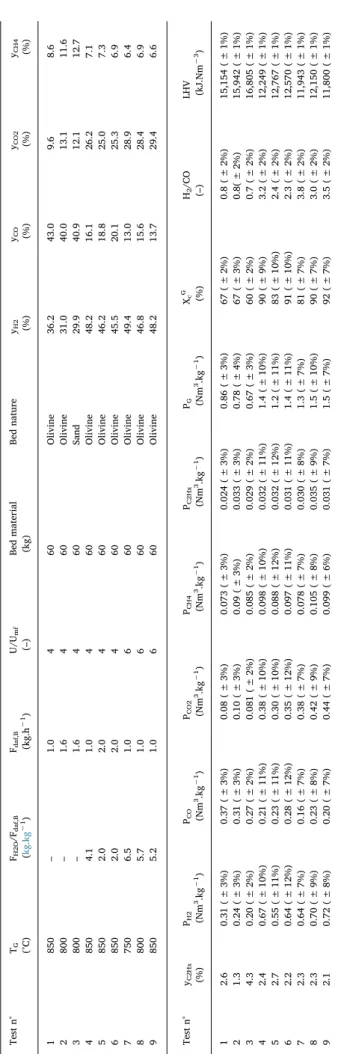
massflow rate (Fp) is studied in the FICFB.Table 10indicates the range
of variation of the operating parameters experimented in this study. InTables 11 and 12are presented the experimental results obtained from the DFB experiments and from the FICFB experiments, respec tively. In each table are given:
•
The operating conditions (bed temperatures, steam to biomass massratio, dry ash free biomass feeding rate, U/Umfratio, bed material
inventory and nature, natural gasflow rate and bed material cir
culationflow rate). The minimum fluidization velocity of the bed
material particles (olivine or sand) is calculated with steam as fluidizing gas for steam gasification experiments and with nitrogen
asfluidizing gas for pyrolysis experiments, and for a Sauter mean
particle diameter, at the gasifier dense fluidized bed temperature;
•
The syngas composition non diluted by the tracer gas;The performance criteria, calculated from the experimental results,
as well as their relative uncertainty (syngas yield and LHV, H2/CO
molar ratio, carbon conversion rate and each component yield).
Besides, the results reported inTable 1 2, presenting the experi
mental results obtained in the FICFB mode, were compared to some experimental results available in the literature. This comparison is
presented inTable B.1in Appendix B. The comparison shows that the
experimental results presented in this study are in good agreement with those already reported.
3.1. Comparison between pyrolysis and steam gasification
Beech sawdust pyrolysis and steam gasification experiments are
carried out in the densefluidized bed mode, with the same dry ash free
biomass feeding rate (1 kg.h−1), bed temperature (850 °C) and U/Umf
ratio (4). The only difference arises from the fluidizing gas nature.
Pyrolysis tests are performed with pure nitrogen while steam gasifica tion tests are performed with pure steam. Under the same operating conditions, the presence of steam is expected to favor the char steam gasification, water gas shift and tars steam reforming reactions kinetics, leading to a greater gasification performance.
InTable 11are presented the experimental results of the pyrolysis experiment (test n° 1) and steam gasification experiment (test n° 4). It is
shown that the H2/CO molar ratio, the syngas yield and the carbon
conversion rate increase whenfluidizing gas is switched from nitrogen
to steam. Besides, H2and CO2contents and yields increase while those
of CO decrease in the presence of steam.
In addition, carbon balance performed for both pyrolysis and steam
gasification experiments is illustrated Fig. 3, and shows that in the
presence of steam, the fraction of carbon converted into tars is divided by 10 (from 10 to 1 mol%). As explained above, the assessment of the fraction of carbon converted into tars presents some uncertainties. Thus, these results must only be considered as qualitative information. Nevertheless, these results can be compared to some experimental re sults compared in the literature. As an example, during biomass pyr olysis, the results from the carbon balance show that 10% of the carbon amount fed in the gasifier is converted into tars. Assuming tars are
mainly made of benzene, the tar concentration can be estimated to 41g.
kg−1of dry ash free biomass, at 850 °C with olivine as bed material.
This value is consistent with the amount of tars produced during wood
pyrolysis at 850 °C (40g.kg−1 of dry ash free biomass) reported by
Dufour et al.[63].
These trends show that char steam gasification, water gas shift and tars steam reforming reactions are favored in the presence of steam.
Besides, CH4and C2HXyields are found to slightly increase. These
results indicate that these components are mainly formed during the
biomass pyrolysis step. Nevertheless, the low variation in CH4and C2Hx
yields is likely related to the degrading reactions of aromatic tar com pounds.
Moreover, the use of steam asfluidizing gas instead of nitrogen
leads to a lower syngas LHV, mainly because the CO content decreases
while the CO2one increases.
In order to confirm the carbon converted into tars amount calcu lated by carbon balance, the results were compared to some results reported in the literature.
3.2. Effect of the biomass shape
In order to investigate the influence of the biomass shape, steam
gasification experiments are carried out with beech sawdust and beech
H2 CO CO2 CH4 C2H2 C2H4 C2H6 N2
Relative uncertainty (Δyi/yi) 1 1 1 1 2 2 2 1
Table 10
Operating conditions of the gasification experiments.
Parameter Biomass shape TG(°C) FH2O/Fdaf,B(kg.kg 1) FH2O(kg.h 1) Bed material nature Fp(kg.h 1)
Range in the densefluidized bed mode Sawdust/Pellets 750–850 1.4–5.6 3.5–6.3 Olivine/Sand –
Range in the circulatingfluidized bed mode 800–850 0.7–1.3 5.6–10 – 350–1000
Table 9
•
Char elutriation phenomenon might be promoted with sawdust as biomass, which reduces char residence time in the bed and disfavors steam gasification reaction;•
Char from sawdust pyrolysis is instantly perfectly mixed in the bedof olivine particles. Regarding char from pellets pyrolysis, it remains at the bed surface until its diameter shrank enough to be perfectly mixed. This leads to a higher heating rate and a better char gas
contact for char sawdust, promoting the char steam gasification
reaction.
3.3. Effect of the bed temperature (T)
The effect of the bed temperature is investigated between 750 and
850 °C in the densefluidized bed mode with beech sawdust particles as
biomass fuel. It is also studied between 800 and 850 °C in the circu
latingfluidized bed mode with beech pellets as biomass fuel. For each
operating mode, experiments are carried out with the same dry biomass
feeding rate and U/Umfratio. From the thermodynamic and kinetic
points of view, an increase in bed temperature is supposed to favor the kinetics of the endothermic char steam gasification, Boudouard, tars cracking and steam reforming reactions. Regarding the exothermic water gas shift reaction, it is expected to be disfavored.
Experimental results obtained in the densefluidized bed mode are
reported inFig. 5andTable 11(tests n° 7, 8 and 9). Two trends are
observed:
•
For a rise in bed temperature from 750 to 800 °C, syngas yield andcarbon conversion rate are found to increase from 1.3 to 1.5
Nm3.kg−1and from 81 to 90%, respectively. Moreover, H
2, CO and
CO2yields increase. These trends show that a rise in bed tempera
ture promotes char steam gasification, Boudouard and tars cracking and steam reforming reactions while it disfavors water gas shift reaction. For instance, the increase in CO yield means that the amount of CO produced by char steam gasification, Boudouard and tars conversion reactions is higher than the amount consumed by water gas shift reaction. These trends agree fairly well with the re
sults reported by Franco et al.[25]and Zhao et al.[30];
•
For a rise in bed temperature from 800 to 850 °C, carbon conversionrate increases much more slightly than between 750 and 800 °C: from 90 to 92%. Syngas yield is even found to remain constant. These results can be explained by the fact that beyond 800 °C, the
steam gasification and steam reforming reactions become fast en
ough to make the gas and char residence time the limiting step.
Regarding CH4and C2Hxyields, they only slightly increase with bed
temperature (from 0.078 to 0.105 Nm3.kg−1and from 0.030 to 0.035
Nm3.kg−1, respectively). These values are similar to the ones obtained
after the pyrolysis experiment presented above, meaning that these components are mainly formed during this step.
In addition,Table 11reports that the H2/CO molar ratio as well as
the syngas LHV and composition lowly depend on the bed temperature.
This is in good agreement with the results found by Rapagna et al.[27]
in a densefluidized bed reactor with olivine particles.
Besides, the effect of the bed temperature, between 800 and 850 °C,
in the circulatingfluidized bed mode, is presented inTable 1 2(tests n°
26, 27 and 28) andFig. 6. The bed temperature is adjusted by mod
ifying the natural gasflow rate introduced in the combustor (Table 1 2).
From the experimental results obtained in the densefluidized bed
mode, an increase in the bed temperature is expected to lead to higher syngas yield and carbon conversion rate, without affecting syngas composition.
The experimental results illustrate these trends. It is shown that carbon conversion rate and syngas yield increase with the bed tem
perature. H2, CO and CO2 yields are also found to rise. Regarding
syngas composition and LHV, they are not significantly affected by this
parameter. Thus, similar to the results presented above in the dense fluidized bed mode, a rise in bed temperature promotes char steam
gasification and tars cracking and steam reforming reactions.
3.4. Effect of the steam to biomass mass ratio (FH2O/Fdaf,B)
The influence of the steam to biomass mass ratio is investigated
through two experimental campaigns. The first one was carried out
between 1.4 and 5.6kg.kg−1in the dense fluidized bed mode, with
beech sawdust particles as biomass. The second one was performed
between 0.7 and 1.3 kg.h−1in the circulatingfluidized bed mode, with
beech pellets as biomass. Each campaign of experiment is carried out
keeping the same steam flow rate and gasifier bed temperature and
varying the dry biomass feeding rate.
The experimental results from thefirst campaign are presented in
Table 11(tests n° 10 17) andFig. 7. It is shown that an increase in
steam to biomass mass ratio leads to higher H2/CO molar ratio, dry
syngas yield and carbon conversion rate.
These trends agree with the literature results reported inTable 2
[25,27 28,31,35]. They are likely explained by the fact that a decrease
in the biomassflow rate leads to a higher steam partial pressure and to a
lower gas flow rate, or velocity, at the bed outlet (steam + syngas).
These phenomena increase char and gas residence time in the reactor by reducing solids elutriation and promote the kinetics of char steam pellets, in DFB (first campaign) and FICFB (second campaign). For each
campaign, the same dry biomass feeding rate, gasifier bed temperature and steam mass flow rate are set.
The results of the first campaign, performed in the dense fluidized
bed mode, are reported in Fig. 4 and Table 11 (the beech sawdust and
beech pellets gasification experiments correspond to test n° 5 and 6,
respectively). It is shown in Fig. 4 that the biomass shape does not affect
significantly the syngas composition. This is consistent with the con
stant H2/CO molar ratio and syngas LHV reported in Table 11. Never
theless, it is found that syngas yield and carbon conversion rate are higher with beech pellets (test n° 6), regarding beech sawdust (test n°5).
In addition, greater H2, CO and CO2 yields are found with beech pellets.
This difference is likely explained by the larger size of char particles produced by beech pellets pyrolysis, regarding the ones produced by beech sawdust pyrolysis. Consequently, char terminal settling velocity is higher, making its residence time in the dense bed longer during beech pellets gasification, and promoting the kinetics of the char steam
gasification reaction.
Regarding CH4 and C2Hx, their contents remain constant when the
biomass shape is switched from sawdust to pellets while their yields slightly differ in the range of values reported above. Thus, these com ponents do not seem to be affected by the biomass shape.
The effect of biomass shape is also investigated in the circulating fluidized bed. Nevertheless, because of the difficulty in controlling the biomass feeding rate with sawdust as biomass, this test was not carried out with the same biomass feeding rate than the beech pellets steam
gasification experiments. Thus, the results of the beech sawdust steam
gasification experiment (test n° 25 in Table 1 2) are compared to the
range of values found during the beech pellets steam gasification ex
periments (test n° 24 in Table 1 2) presented in this paper.
The experimental results reported in Table 1 2 show that beech
sawdust steam gasification leads to results very similar to those ob tained during beech pellets steam gasification. Only a slight decrease is observed regarding carbon conversion rate and syngas yield. For in stance, the carbon conversion rate is equal to 83% while the syngas
yield is found to be 1.03 Nm3.kg−1 with beech sawdust. These values
are between 85 and 88% for the carbon conversion rate and between
1.03 and 1.13 Nm3
.kg−1 for the syngas yield with beech pellets. Similar
to the results obtained in the dense fluidized bed mode, it is likely ex plained by the fact that char particles from sawdust pyrolysis are smaller than from pellets pyrolysis. This difference can lead to the following competitive phenomena:
gasification, water gas shift and tars steam reforming reactions. How
ever, Table 11 indicates that syngas LHV decreases when steam to
biomass mass ratio rises, mainly because the CO content decreases
while that of CO2increases.
Moreover,Table 11shows that:
•
The yield of CH4+ C2HXremains almost constant, and is similar tothe one obtained during the pyrolysis experiment presented above. These results show that these gaseous products are mainly produced during biomass pyrolysis and their degradation in the presence of olivine is negligible;
•
The H2yield increases with the steam to biomass mass ratio from0.47 to 0.73 Nm3.kg−1, which is related to the effect of the steam
partial pressure on the steam gasification, water gas shift and tars steam reforming reactions;
•
The CO2yield increases from 0.23 to 0.44 Nm3.kg−1, which is related to the effect of the steam to biomass mass ratio on the water gas shift reaction;
•
The CO yield slightly decreases from 0.27 to 0.20 Nm3.kg−1, whichcan be explained by the competition between the reactions leading to CO formation (steam gasification and steam reforming reactions) and the one conducting to CO consumption (water gas shift). Finally, the test carried out for a steam to biomass mass ratio equal
to 2.6kg.kg−1was repeated. Results seem to show a good reproduci
bility of the phenomena.
The experimental results from the second campaign, carried out in
the circulatingfluidized bed mode, are presented inTable 1 2(tests n°
29 and 30). The results confirm the experimental findings from the first
campaign performed in the dense fluidized bed mode. Indeed, it is
found that:
•
H2and CO2yields increase with the steam to biomass mass ratio,while that of CO decreases. These trends are likely attributed to the fact that the steam partial pressure increases with the steam to
biomass mass ratio, promoting char steam gasification, water gas
shift and tars steam reforming reactions. Moreover, for a same
steamflow rate, a decrease in biomass feeding rate lowers the gas
velocity at the outlet of the gasifier, leading to higher char and gas
residence times in the reactor;
•
CH4and C2Hxyields are not affected by the steam to biomass massratio, confirming that these components are mainly formed during
biomass pyrolysis step.
In conclusion, biomass steam gasification is promoted as the steam
to biomass mass ratio rises, which is consistent with the results obtained
in the densefluidized bed.
3.5. Effect of the steam mass flow rate (FH2O) orfluidizing gas velocity
Two experimental campaigns are carried out in order to investigate
the influence of the steam mass flow rate. The first campaign is per
formed in the DFB mode, between 3.5 and 6.3 kg.h−1(from 3 to 6.Umf),
and with beech sawdust as biomass. The second one is performed in the
FICFB mode, between 5.6 and 10 kg.h−1 (from 5 to 9.8.Umf), with
beech pellets as biomass. Each campaign is carried out keeping the same dry biomass feeding rate and gasifier bed temperature. For a same
biomass feeding rate, an increase in the steam massflow rate leads to a
higher steam to biomass mass ratio. Thus, the gasification performance should be promoted, as mentioned above. However, an increase in the
steam massflow rate also affects the gas and char residence time in the
densefluidized bed. It can lead to a decrease in these residence times,
resulting in a lower gasification performance.
The experimental results of thefirst campaign, carried out in the
densefluidized bed mode, are reported inTable 11(tests n° 18 21) and
Fig. 8. Two trends can be observed:
Table 11a Presentation of the experimental results obtained in the dense fl uidized bed (Part 1/3). Test n° TG (°C) FH2O /F daf,B ( kg.kg − 1) Fdaf,B (kg.h − 1) U/U mf (– ) Bed material (kg) Bed nature yH2 (%) yCO (%) yCO2 (%) yCH4 (%) 1 850 – 1.0 4 60 Olivine 36.2 43.0 9.6 8.6 2 800 – 1.6 4 60 Olivine 31.0 40.0 13.1 11.6 3 800 – 1.6 4 60 Sand 29.9 40.9 12.1 12.7 4 850 4.1 1.0 4 60 Olivine 48.2 16.1 26.2 7.1 5 850 2.0 2.0 4 60 Olivine 46.2 18.8 25.0 7.3 6 850 2.0 2.0 4 60 Olivine 45.5 20.1 25.3 6.9 7 750 6.5 1.0 6 60 Olivine 49.4 13.0 28.9 6.4 8 800 5.7 1.0 6 60 Olivine 46.8 15.6 28.4 6.9 9 850 5.2 1.0 6 60 Olivine 48.2 13.7 29.4 6.6 Test n° yC2Hx (%) PH2 (Nm 3.kg − 1) PCO (Nm 3.kg − 1) PCO2 (Nm 3.kg − 1) PCH4 (Nm 3.kg − 1) PC2Hx (Nm 3.kg − 1) PG (Nm 3.kg − 1) Xc G (%) H2 /CO (– ) LHV (kJ.Nm − 3) 1 2.6 0.31 ( ± 3%) 0.37 ( ± 3%) 0.08 ( ± 3%) 0.073 ( ± 3%) 0.024 ( ± 3%) 0.86 ( ± 3%) 67 ( ± 2%) 0.8 ( ± 2%) 15,154 ( ± 1%) 2 1.3 0.24 ( ± 3%) 0.31 ( ± 3%) 0.10 ( ± 3%) 0.09 ( ± 3%) 0.033 ( ± 3%) 0.78 ( ± 4%) 67 ( ± 3%) 0.8( ± 2%) 15,942 ( ± 1%) 3 4.3 0.20 ( ± 2%) 0.27 ( ± 2%) 0.081 ( ± 2%) 0.085 ( ± 2%) 0.029 ( ± 2%) 0.67 ( ± 3%) 60 ( ± 2%) 0.7 ( ± 2%) 16,805 ( ± 1%) 4 2.4 0.67 ( ± 10%) 0.21 ( ± 11%) 0.38 ( ± 10%) 0.098 ( ± 10%) 0.032 ( ± 11%) 1.4 ( ± 10%) 90 ( ± 9%) 3.2 ( ± 2%) 12,249 ( ± 1%) 5 2.7 0.55 ( ± 11%) 0.23 ( ± 11%) 0.30 ( ± 10%) 0.088 ( ± 12%) 0.032 ( ± 12%) 1.2 ( ± 11%) 83 ( ± 10%) 2.4 ( ± 2%) 12,767 ( ± 1%) 6 2.2 0.64 ( ± 12%) 0.28 ( ± 12%) 0.35 ( ± 12%) 0.097 ( ± 11%) 0.031 ( ± 11%) 1.4 ( ± 11%) 91 ( ± 10%) 2.3 ( ± 2%) 12,570 ( ± 1%) 7 2.3 0.64 ( ± 7%) 0.16 ( ± 7%) 0.38 ( ± 7%) 0.078 ( ± 7%) 0.030 ( ± 8%) 1.3 ( ± 7%) 81 ( ± 7%) 3.8 ( ± 2%) 11,943 ( ± 1%) 8 2.3 0.70 ( ± 9%) 0.23 ( ± 8%) 0.42 ( ± 9%) 0.105 ( ± 8%) 0.035 ( ± 9%) 1.5 ( ± 10%) 90 ( ± 7%) 3.0 ( ± 2%) 12,150 ( ± 1%) 9 2.1 0.72 ( ± 8%) 0.20 ( ± 7%) 0.44 ( ± 7%) 0.099 ( ± 6%) 0.031 ( ± 7%) 1.5 ( ± 7%) 92 ( ± 7%) 3.5 ( ± 2%) 11,800 ( ± 1%)
Table 11b Presentation of the experimental results obtained in the dense fl uidized bed (Part 2/3). Test n° TG (°C) FH2O /F daf,B ( kg.kg − 1) Fdaf,B (kg.h − 1) U/U mf (– ) Bed material (kg) Bed nature yH2 (%) yCO (%) yCO2 (%) yCH4 (%) 10 850 1.4 2.9 4 60 Olivine 43.1 24.6 21.3 8.4 11 850 1.7 2.4 4 60 Olivine 43.9 23.1 22.0 8.4 12 850 2.0 2.0 4 60 Olivine 46.2 18.8 25.0 7.3 13 850 2.6 1.6 4 60 Olivine 46.3 17.9 25.9 7.6 14 850 2.6 1.6 4 60 Olivine 46.4 17.6 26.2 7.6 15 850 3.7 1.1 4 60 Olivine 47.5 16.2 26.4 7.7 16 850 4.1 1.0 4 60 Olivine 48.3 15.9 26.9 6.7 17 850 5.6 0.7 4 60 Olivine 48.7 13.6 29.1 6.6 18 820 1.6 2.2 3 60 Olivine 37.9 28.1 20.7 9.8 Test n° yC2Hx (%) PH2 (Nm 3.kg − 1) PCO (Nm 3.kg − 1) PCO2 (Nm 3.kg − 1) PCH4 (Nm 3.kg − 1) PC2Hx (Nm 3.kg − 1) PG (Nm 3.kg − 1) Xc G (%) H2 /CO (– ) LHV (kJ.Nm − 3) 10 2.6 0.47 ( ± 6%) 0.27 ( ± 7%) 0.23 ( ± 6%) 0.092 ( ± 7%) 0.029 ( ± 9%) 1.1 ( ± 6%) 80 ( ± 6%) 1.8 ( ± 2%) 13,333 ( ± 1%) 11 2.6 0.51 ( ± 8%) 0.27 ( ± 7%) 0.26 ( ± 9%) 0.098 ( ± 8%) 0.030 ( ± 8%) 1.17 ( ± 7%) 82 ( ± 7%) 1.9 ( ± 2%) 13,280 ( ± 1%) 12 2.7 0.55 ( ± 11%) 0.23 ( ± 11%) 0.30 ( ± 10%) 0.088 ( ± 12%) 0.032 ( ± 12%) 1.2 ( ± 11%) 83 ( ± 10%) 2.4 ( ± 2%) 12,767 ( ± 1%) 13 2.3 0.58 ( ± 9%) 0.23 ( ± 9%) 0.33 ( ± 9%) 0.096 ( ± 9%) 0.029 ( ± 10%) 1.26 ( ± 9%) 85 ( ± 8%) 2.5 ( ± 2%) 12,627 ( ± 1%) 14 2.2 0.60 ( ± 7%) 0.23 ( ± 6%) 0.34 ( ± 6%) 0.098 ( ± 6%) 0.029 ( ± 7%) 1.3 ( ± 6%) 85 ( ± 6%) 2.5 ( ± 2%) 12,769 ( ± 1%) 15 2.2 0.65 ( ± 7%) 0.22 ( ± 6%) 0.36 ( ± 8%) 0.105 ( ± 6%) 0.030 ( ± 7%) 1.37 ( ± 7%) 87 ( ± 6%) 2.9 ( ± 3%) 12,525 ( ± 1%) 16 2.2 0.67 ( ± 11%) 0.22 ( ± 11%) 0.38 ( ± 10%) 0.094 ( ± 10%) 0.031 ( ± 10%) 1.4 ( ± 10%) 90 ( ± 9%) 3.2 ( ± 2%) 12,249 ( ± 1%) 17 2.0 0.73 ( ± 7%) 0.20 ( ± 7%) 0.44 ( ± 7%) 0.099 ( ± 7%) 0.030 ( ± 8%) 1.5 ( ± 7%) 92 ( ± 7%) 3.6 ( ± 2%) 12,182 ( ± 1%) 18 3.5 0.38 ( ± 12%) 0.28 ( ± 11%) 0.21 ( ± 12%) 0.10 ( ± 11%) 0.035 ( ± 11%) 1.0 ( ± 11%) 79 ( ± 12%) 1.4 ( ± 2%) 14,551 ( ± 1%) Table 11c Presentation of the experimental results obtained in the dense fl uidized bed (Part 3/3). Test n° TG (°C) FH2O /F daf,B ( kg.kg − 1) Fdaf,B (kg.h − 1) U/U mf (– ) Bed material (kg) Bed nature yH2 (%) yCO (%) yCO2 (%) yCH4 (%) 19 820 2.0 2.2 4 60 Olivine 47.0 18.7 25.2 6.9 20 820 2.5 2.2 5 60 Olivine 42.8 21.9 24.3 8.0 21 820 2.8 2.2 6 60 Olivine 43.6 21.4 24.0 8.1 22 800 5.7 1.0 6 60 Olivine 46.8 15.6 28.4 6.9 23 800 5.2 1.0 6 60 Olivine 40.2 25.7 21.8 9.0 Test n° yC2Hx (%) PH2 (Nm 3.kg − 1) PCO (Nm 3.kg − 1) PCO2 (Nm 3.kg − 1) PCH4 (Nm 3.kg − 1) PC2Hx (Nm 3.kg − 1) PG (Nm 3.kg − 1) Xc G (%) H2 /CO (– ) LHV (kJ.Nm − 3) 19 2.2 0.51 ( ± 12%) 0.21 ( ± 11%) 0.28 ( ± 9%) 0.076 ( ± 10%) 0.024 ( ± 11%) 1.1 ( ± 9%) 82 ( ± 9%) 2.3 ( ± 2%) 12,752 ( ± 1%) 20 3.0 0.43 ( ± 9%) 0.22 ( ± 9%) 0.24 ( ± 9%) 0.080 ( ± 9%) 0.030 ( ± 9%) 1.0 ( ± 8%) 78 ( ± 8%) 1.9 ( ± 2%) 13,296 ( ± 1%) 21 2.9 0.39 ( ± 11%) 0.20 ( ± 9%) 0.22 ( ± 10%) 0.073 ( ± 11%) 0.026 ( ± 11%) 0.9 ( ± 10%) 72 ( ± 10%) 1.7 ( ± 2%) 13,222 ( ± 1%) 22 2.3 0.70 ( ± 9%) 0.23 ( ± 8%) 0.42 ( ± 9%) 0.105 ( ± 8%) 0.035 ( ± 9%) 1.5 ( ± 10%) 90 ( ± 7%) 3.0 ( ± 2%) 12,150 ( ± 1%) 23 3.3 0.48 ( ± 11%) 0.31 ( ± 11%) 0.26 ( ± 12%) 0.108 ( ± 12%) 0.040 ( ± 11%) 1.2 ( ± 11%) 85 ( ± 11%) 1.6 ( ± 2%) 14,151 ( ± 1%)
•
For a steam massflow rate up to 4.5 kg.h−1(from 3 to 4.Umf), a rise
in this parameter leads to higher carbon conversion rate, syngas
yield and H2/CO molar ratio. Moreover, H2 and CO2 yields and
contents increase while the CO ones decrease. Finally, syngas LHV
decreases with steam massflow rate because of the increase in H2
and CO2contents and the decrease in that of CO;
•
For a steam massflow rate increasing beyond 4.5 kg.h−1(from 4 to6.Umf), it is found that both carbon conversion rate, syngas yield and
H2/CO molar ratio decrease. In addition, H2 and CO2 yields and
contents decrease while the CO ones slightly increase. Finally,
syngas LHV increases because of the decrease in CO2content and the
increase in that of CO.
Test n° 24 25 26 27 28 29 30
Bed temperature in the gasifier TG(°C) 815 815 800 815 850 815 815
Dense bed temperature in the combustor (°C) 825–865 830 810 825 855 865 865
Temperature at the outlet of the combustor (°C) 845–860 850 825 845 885 855 855
Fdaf,B(kg.h 1) 5.0 2.3 5.0 5.0 5.0 9.0 5.0
U/Umf(–) 5–7 6 7 7 7 6 6
FH2O/Fdaf,B(kg.kg 1) 1.1–1.5 2.8 1.5 1.5 1.5 0.7 1.3
FH2O(kg.h 1) 5.5–7.5 6.4 7.5 7.5 7.5 6.4 6.4
Fp(kg.h 1) 350–1000 500 1000 1000 1000 350 350
Airflow rate in the combustor (Nm3.h 1) 32–42 42 34.5 34.5 34.5 32 32
Natural gasflow rate (Nm3.h 1) 2–3.3 3.0 1.7 2.0 3.0 3.0 3.0
Bed material (kg) 60 60 60 60 60 60 60
Bed nature Olivine Olivine Olivine Olivine Olivine Olivine Olivine
yH2(%) 34.4–37.0 35.2 37.1 37.0 37.3 36.3 36.8 yCO(%) 21.7–24.1 22.5 22.4 23.2 24.7 27.1 21.7 yCO2(%) 26.8–29.7 29.3 27.4 26.8 25.7 23.2 29.7 yCH4(%) 8.4–9.7 9.2 9.7 9.7 9.2 9.9 8.4 yC2Hx(%) 3.3–3.4 3.8 3.3 3.3 3.1 3.6 3.4 H2/CO (–) 1.43–1.70 1.56 ( ± 2%) 1.65 ( ± 2%) 1.60 ( ± 2%) 1.50 ( ± 2%) 1.34 ( ± 2%) 1.70 ( ± 2%) PH2(Nm3.kg 1) 0.36–0.42 0.36 ( ± 9%) 0.34 ( ± 8%) 0.38 ( ± 9%) 0.43 ( ± 9%) 0.37 ( ± 8%) 0.40 ( ± 10%) PCO(Nm3.kg 1) 0.23–0.26 0.23 ( ± 9%) 0.20 ( ± 9%) 0.24 ( ± 8%) 0.28 ( ± 9%) 0.28 ( ± 8%) 0.24 ( ± 10%) PCO2(Nm3.kg 1) 0.27–0.31 0.30 ( ± 9%) 0.25 ( ± 9%) 0.27 ( ± 9%) 0.29 ( ± 10%) 0.24 ( ± 8%) 0.32 ( ± 10%) PCH4(Nm3.kg 1) 0.09–0.11 0.094 ( ± 9%) 0.088 ( ± 9%) 0.10 ( ± 8%) 0.10 ( ± 11%) 0.10 ( ± 8%) 0.092 ( ± 10%) PC2HX(Nm3.kg 1) 0.036–0.043 0.039 ( ± 9%) 0.040 ( ± 8%) 0.043 ( ± 9%) 0.035 ( ± 10%) 0.036 ( ± 7%) 0.037 ( ± 10%) Syngas LHV (kJ.Nm 3) 13095–13747 12,227 ( ± 1%) 13,675 ( ± 1%) 13,747 ( ± 1%) 13,638 ( ± 1%) 14,385 ( ± 1%) 13,095 ( ± 1%) XcG(%) 85–88 83 ( ± 8%) 79 ( ± 7%) 86 ( ± 7%) 88 ( ± 9%) 81 ( ± 7%) 86 ( ± 9%) PG(Nm3.kg 1) 1.03–1.13 1.03 ( ± 9%) 0.90 ( ± 8%) 1.03 (8%) 1.14 ( ± 9%) 1.03 ( ± 7%) 1.10 ( ± 9%) Table 12b
Presentation of the experimental results obtained in the fast internally circulatingfluidized bed (Part 2/2).
Test n° 31 32 33 34 35 36
Bed temperature in the gasifier TG(°C) 815 815 815 815 815 815
Dense bed temperature in the combustor (°C) 830 830 830 830 865 832
Temperature at the outlet of the combustor (°C) 850 850 850 850 855 860
Fdaf,B(kg.h 1) 5.0 5.0 5.0 5.0 5.0 5.0
U/Umf(–) 5 7.5 8.5 9.5 6 6
FH2O/Fdaf,B(kg.kg 1) 1.1 1.6 1.8 2.0 1.3 1.3
FH2O(kg.h 1) 5.6 8.0 9.0 10.0 6.5 6.5
Fp(kg.h 1) 500 500 500 500 350 1000
Airflow rate in the combustor (Nm3.h 1) 42 42 42 42 32 41
Natural gasflow rate (Nm3.h 1) 3.0 3.0 3.0 3.0 3.0 3.3
Bed material (kg) 60 60 60 60 60 60
Bed nature Olivine Olivine Olivine Olivine Olivine Olivine
yH2(%) 34.4 36.9 37.9 37.6 36.8 36.8 yCO(%) 24.1 19.4 19.9 20.4 21.7 23.5 yCO2(%) 28.6 32.1 30.4 31.4 29.7 27.0 yCH4(%) 9.5 8.4 8.7 7.1 8.4 9.4 yC2Hx(%) 3.4 3.1 3.1 3.5 3.4 3.3 H2/CO (–) 1.4 ( ± 2%) 1.9 ( ± 2%) 2.0 ( ± 2%) 1.9 ( ± 2%) 1.70 ( ± 2%) 1.56 ( ± 2%) PH2(Nm3.kg 1) 0.36 ( ± 7%) 0.38 ( ± 9%) 0.40 ( ± 10%) 0.38 ( ± 10%) 0.40 ( ± 10%) 0.40 ( ± 7%) PCO(Nm3.kg 1) 0.26 ( ± 7%) 0.20 ( ± 9%) 0.21 ( ± 10%) 0.21 ( ± 10%) 0.24 ( ± 10%) 0.25 ( ± 7%) PCO2(Nm3.kg 1) 0.30 ( ± 7%) 0.34 ( ± 9%) 0.31 ( ± 10%) 0.32 ( ± 9%) 0.32 ( ± 10%) 0.29 ( ± 7%) PCH4(Nm3.kg 1) 0.10 ( ± 7%) 0.088 ( ± 9%) 0.090 ( ± 10%) 0.072 ( ± 10%) 0.092 ( ± 10%) 0.10 ( ± 7%) PC2HX(Nm3.kg 1) 0.036 ( ± 7%) 0.033 ( ± 8%) 0.032 ( ± 9%) 0.036 ( ± 9%) 0.037 ( ± 10%) 0.036 ( ± 7%) Syngas LHV (kJ.Nm 3) 13,524 ( ± 1%) 12,648 ( ± 1%) 13,747 ( ± 1%) 12,591 ( ± 1%) 13,095 ( ± 1%) 13,624 ( ± 1%) XcG(%) 85 ( ± 7%) 81 ( ± 8%) 79 ( ± 9%) 78 ( ± 9%) 86 ( ± 9%) 84 ( ± 6%) PG(Nm3.kg 1) 1.06 ( ± 7%) 1.05 ( ± 8%) 1.04 ( ± 9%) 1.02 ( ± 9%) 1.10 ( ± 9%) 1.08 ( ± 7%) Table 12a