OATAO is an open access repository that collects the work of Toulouse
researchers and makes it freely available over the web where possible
Any correspondence concerning this service should be sent
to the repository administrator: [email protected]
To cite this version:
Collin, Philippe and Touhami, Sarah and malec, David and Lefèvre, Yvan
and Llibre, Jean-François : Design of Electric Machine Taking Into
Account the Partial Discharges Phenomena for Future Hybrid Propelled
Aircrafts,
(2019) In: More Electric Aircraft - MEA 2019, 6 February 2019 -
7 February 2019 (Toulouse, France)
Design of Electric Machine Taking Into Account the Partial
Discharges Phenomena for Future Hybrid Propelled Aircrafts
P. Collin , S.Touhami, D. Malec, Y. Lefevre, J.F. Llibre LAPLACE, Université de Toulouse, CNRS, INPT,UPS, France
{
collin, stouhami, malec, lefevre, jean-francois.llibre @laplace.univ-tlse.fr}
Abstract
Designing the electric motors to propel an aircraft represents a huge challenge. The constraint of weight requires such machines to be compact. Besides, the high specific power necessary (a few kW/kg, machine cooling included) leads to an increase of the voltage range of stator winding. Such characteristics increase considerably the risk of partial discharges (PD) in the stator winding. In this paper, the design of electric motors aimed to propel a future hybrid aircraft will be presented. It will be realized using 2 tools.
Introduction
The transition toward more electric aircraft started some years ago. In the 50s, more power has been required so that inboard voltage has been increased from 28V DC to 115/200 V AC at 400Hz frequency [1]. Until the 80s, flight controls used only hydraulic power. It is no more the case since the concept of "Fly by wire" [2] which introduced electric flight controls. Nowadays, in a vocation to become more ecofriendly and more economic, the aircraft industry is looking toward the "full electric aircraft".
Airbus A380 is equipped with the first electric actuator for reverse propulsion ETRAS, which was completely new back in 2005 [2]. Europe is one of the leader of such transition by continuing the Clean Sky program. In order to propel future hybrid aircrafts, 2 targets are aimed. In 2025, the program announces a 5 kW/kg electric motor and a 10 kW/kg in 2035 [3]. To increase specific power of electric machine, the rotational speed and the number of pole pairs (consequently electric frequency) should be increased. Therefore, it induces an increase of the voltage level. The on-board DC voltage bus is going to overpass 1kV. This increases the risk of PD in the machine fed by inverters (cf. Fig. 1).
This works represents a first collaboration between two studies: sizing machine and partial discharges phenomena. As a first level approach, some hypotheses are formulated. In that way, a star winding configuration with the neutral connected to the ground will be presented. This represents the worst configuration for the electrical stress between the conductors and the slot. In case of overshoot, only the first conductor will be affected. The winding class is chosen to 220°C and the winding temperature of the sizing point is 180°C. This temperature value does not influence the Paschen’s criteria in the case of electric breakdown in air gaps of length in range of 10-200µm [4]. The slot is modelled with air in order to take into account the imperfection of the impregnation process [5]. By neglecting the winding capacitance effect and the voltage displacement between conductors, the conductor voltage varies linearly. The first part introduces the machine sizing tool called 'Target Setting Tool (TST)' with an illustrative
example of a high specific power electric machine. The second part focuses on taking into account the Partial Discharges (PD) phenomena, in the illustrative example, thanks to the second tool.
Fig. 1: Propulsion Chain of a Hybrid Aircraft [3]
I. Machine sizing tool: Target Setting Tool (TST)
To reach each level of specific power of electric machine of hybrid aircraft, the machine sizing tool called "Target Setting Tool (TST)" is developed. It uses the loadability concepts [6] applied on the analytical model of ideal sinewave synchronous motor [7]. The loadability concepts characterize the performances and the technological level allowing to make tradeoffs on high specific power of electric machine [6]. The loadability concepts are mainly the electric, magnetic and thermal loads [6]:
- the magnetic loading Bm, indicates the magnetic flux density in airgap allowed by the soft and hard magnetic materials,
- the electric loading Km, indicates the surface current density in airgap allowed by the insulation materials and by the cooling technology,
- the electromagnetic loading σt, indicated the tangential stress in airgap allowed by the soft, hard magnetic materials, by the insulation material and by the cooling technologies.
2 K Bm m t =
s (1)
The maximum electromagnetic torque (Tem) is given by: L R 2 T 2 t em =
s
p
(2)These loads are introduced as inputs to give main sizes, weight and performances of electric motor without to specify the stator winding configuration and the rotor structure. Indeed, this tool also needs very few data which presents a main interest for quickly sizing of several electric motor types. These inputs data are:
- the mechanical power Pm, the rotational speed N, the number of pole pairs p,
- the geometrical choices such as the form factor l, the winding head coefficient kwh and fill factor kfill in the slot.
In TST, the airgap flux density and the surface current density are assumed sinewaves. Therefore, more the sized motor is close to these assumptions more their performances are achieved [8]. The magnetic saturation and magnetic reaction of armature are not taking into account. This tool sizes electric motor at the maximum torque operating point. The main sizes of electric motor are: the external stator radius Rout, the inner stator radius R, the axial active length L, the stator yoke height hy and the slot height hs, as shown in Fig. 2.
The inner stator radius R and the axial active length L are given by the tangential stress in the airgap σt and the torque with a choice of the form factor l [2]. The stator yoke height hy is given from the permitted airgap flux density Bm and yoke flux density By. The slot height is given by the permitted loads namely the surface current density Arms, current density jrms, airgap flux density Bm and tooth flux density Bt and also by fill factor kfill [8]. Therefore, the weight of electric motor can be deduced and then the specific power and torque densities.
Fig. 2: Main sizes of electric motor
Sizing of a high specific power electric motor
A high specific power electric motor is sized using TST and presented in [9]. Their mechanical specifications, the electric, the magnetic and the thermal loads fixed in order to obtain the main sizes, weight and the specific power and torque densities, are summarized in Table 1. A joint design of Halbach array PM and distributed stator winding are made in [9] to validate the performances of high specific power density of electric motor.
The three phase distributed winding is made in [9] with two slots per pole and per phase. The full pitch concentric winding configuration is shown in Fig. 3. To study the PDs phenomena in this winding
configuration, a choice of 6 conductors per slot is made (Table 2). Conductor voltage is given:
max V L L V tot i condi= (3) Where Vcondi is the voltage of ith conductor computed
from the ground, Li is the length of conductor computed from the ground, Ltot is the total conductor length and Vmax is the amplitude of voltage per phase. Table 2 presents the voltages of each conductor. These voltages are calculated at the half axial active length of the stator (cf. Fig.3).
Parameters Symbol Unit Value
Mechanical specifications
Mechanical power Pm kW 900
Mechanical torque T N. m 430
Electric, Magnetic and thermal loads
Rms current density jrms A.mm-2 11
Max airgap flux density Bm T 1
Max linear current
density Km kA/m 76
Tooth flux density Bt T 1.3
Stator yoke flux density Bsy T 1
Geometric choices
Number of poles 2p - 4
Fill factor kfill - 0.5
Head winding coefficient kwh - 1.4
Form factor λ - 0.5
Main sizes
Stator outer radius Rout mm 136.2
Stator inner radius R mm 76.6
Active length machine L mm 306.5
1
Slot height hs mm 21.28
Weight, specific power and torque densities
Weight of motor Mmot kg 152.5
Specific power density Pm/Mmot kW.kg-1 5.9
Specific torque density T/Mmot Nm.kg-1 2.81
Table 1: Electric machine parameters [9]
Parameters Symbol Unit Value
Number of conductors per slot
Nc/s - 6
Max voltage per phase Vmax kV 2.390
1st conductor voltage Vcond1 kV 2.382
2nd conductor voltage Vcond2 kV 2.278
3rd conductor voltage Vcond3 kV 2.174
4th conductor voltage Vcond4 kV 2.071
5th conductor voltage Vcond5 kV 1.969
6th conductor voltage Vcond6 kV 1.867
Table 2: Conductor voltage
Fig. 3: Stator winding configuration: concentric
winding with 6 conductors per slot.
½ L
R R
out
hs
II. Tool to detect Partial Discharges (PDs) in stator winding
A. Paschen’s theory
In the literature, the Paschen’s theory [10] remains the main criteria used to predict PDs in numerical models. This theory requires some strong hypothesis. One considers an air gap between 2 parallel metallic electrodes. A voltage drop is applied between these electrodes so that a uniform electric field is formed. The temperature and humidity conditions are the normal ones: T=20°C and Ha=11g/m3 [4]. An electron initially present in the air gap will be accelerated by the applied electric field. In its way to reach one of the electrodes (the anode) it will collide with some neutral particles present in the gap. These interactions result in more electrons present in the air gap. This electronic avalanche is supposed to be the only ionization mechanism in the air gap. The ions, generated by the collision with electrons, will travel toward the opposite electrode (the cathode). They will bomb it and may release others electrons. If this secondary emission releases an electron that replaces the initial electron which started the electronic avalanche, the ionization in the air gap is self-maintained.
In this case, the breakdown voltage of the air gap is linked to the pressure and the length of the gap between the electrodes by the following expression:
) ln( pd C Bpd VB + = (4) ÷ ÷ ÷ ÷ ø ö ç ç ç ç è æ + = ) ln( ln g1 1 A C (5)
With p the pressure in the gap, d the length of the gap between the electrodes, A=11.40 Pa-1.m-1 and
B=277.40 V. Pa-1.m-1 [4]. The coefficient g is the secondary electron emission coefficient. It is the number of electrons leaving the cathode over the number of impacting ions. It equals 0.01 [5] in the case of plane metallic electrodes. This coefficient is highly dependents of the geometry of the electrodes, the uniformity of the electric field and the composition of the gas in the gap.
B. Partial Discharges (PDs) study of high specific power electric motor
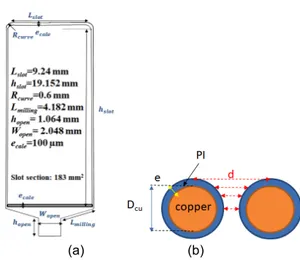
The TST tool gives the information on the winding so that the electromagnetic torque and specific power constrains are reached (cf. part 1). The winding is made of 6 conductors. Each conductor must have a copper cross section of 16.9mm² in order to be compliant with the current density constraint. The filling factor is 0.5. This factor is linked to the air section and insulation section (enamel & slot insulation) by the following equation:
air my e cu cu slot cu fill S S S S S S S k + + + = = (6)
With SCu the total copper section, SSlot the slot section, Se the total enamel section, Smy the total slot insulation section (made of Mylar [11]) and Sair the air section. In this example, the slot geometry (i. e. SSlot) and the copper cross section (SCu) are fixed. The wires are covered in PI enamel of e equals min grade 2 thickness [12] (Figure 4). The slot insulation is made of Mylar of emy thickness. The electric relative permittivity of these polymers is taken equal to
5 . 3 = r
e
.The voltage repartition over the turns is also given by TST. In the following, Vi refers to the voltage over the
ith copper wire. The choice is made to use 2 wires in parallel per conductor. To take into account the rising time of the voltage due to the power converter, an overshoot of 33% of the voltage is taken into account on the first turn.
V1=1.33*Vcond1 Step 0: initialization DCu=3.35mm e=43µm emy=100µm 6 conductors 2 wires/ conductor
Table 3: Initialization parameters
(a) (b)
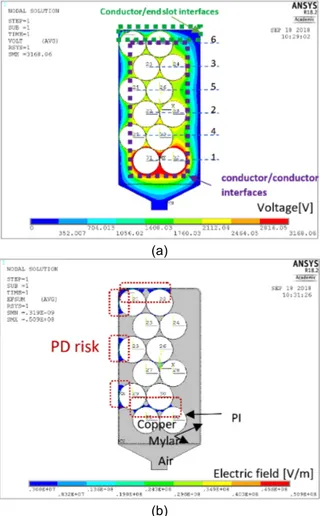
Fig. 4: (a) Slot dimensions (b) enamel covered wire The winding is organized so that the electric constrain between conductors and conductors/slot is reduced (Fig. 5). In this configuration, the electrical stress between conductors and the slot (left side and end slot) are similar. Hence, only the conductors/end slot interfaces will be studied as conductor/slot interfaces. The slot and winding parameters are entered in MatLab (Fig. 6). An Ansys 2D model of the slot with the winding is then automatically built, meshed and solved. The slot is modelled filled with air at pressure 1 bar so that the simulated results are close to the ones obtained experimentally with an epoxy filled slot [5]. The voltage values and position of nodes along the wires perimeters and slot contour are sent back to MatLab for post processing. The Vsimu(pd=d) curved
obtained are compared to the experimental Paschen curve obtained by Dakin and al [13]. If there is some PD risk, the tool updates the winding configuration and the problem is solved again.
At the end of the post processing stage on MatLab, the tool returns the results presented on Fig. 7. One can notice the PD risk zones. These are the zones where the Vsimu(pd=d) curves are above the Paschen curve.
(a)
(b)
Fig. 5: (a) Initialization - Voltage map [V], (b) Electric field norm [V/m]
Fig. 6: PD detection tool organigram
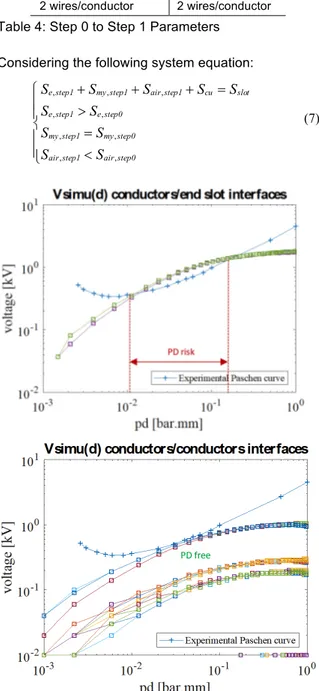
Fig. 7: Initialization - Vsimu(pd=d) curves vs experimental Paschen’s curve (e min grade 2) The tool then updates the enamel thickness to e equals max grade 3 [12].
Ø Post processing Ø V(pd=d) curves vs
Step 0: initialization Step 1 DCu=3.35mm DCu=3.35mm e=43µm e=85.5µm emy=100µm emy=100µm 6 conductors 6 conductors 2 wires/conductor 2 wires/conductor
Table 4: Step 0 to Step 1 Parameters Considering the following system equation:
ï ï î ï ï í ì < = > = + + + 0 step air 1 step air 0 step my 1 step my 0 step e 1 step e slot cu 1 step air 1 step my 1 step e S S S S S S S S S S S , , , , , , , , , (7)
Fig. 8: Step 1 - Vsimu(pd=d) curves vs experimental Paschen curve (e max grade 3 [12])
At the end of step 1, there may be no more PD risk between conductors. However, PD risk remains for conductor/slot interfaces. In step 2, e is kept equals to max grade 3 and the Mylar thickness is increased to its maximum thickness allowed by the slot section (emy=480µm [11]).
Step 0: initialization
Step 1 Step 2
DCu=3.35mm DCu=3.35mm DCu=3.35mm
e=43µm e=85.5µm e=85.5µm
emy=100µm emy=100µm emy=480µm
6 conductors 6 conductors 6 conductors
2 wires/ conductor 2 wires/ conductor 2 wires/ conductor
Table 5: Step 0 to Step 2 Parameters Considering the following system equation:
ï ï î ï ï í ì < > = = + + + 1 step air 2 step air 1 step my 2 step my 1 step e 2 step e slot cu 2 step air 2 step my 2 step e S S S S S S S S S S S , , , , , , , , , (8)
Where Smy is increasing while Sair is decreasing. Scu,
Se and SSlot remain constant.
Fig. 9: Step 2 - Vsimu(pd=d) curves vs experimental Paschen curve (emy=480µm [11])
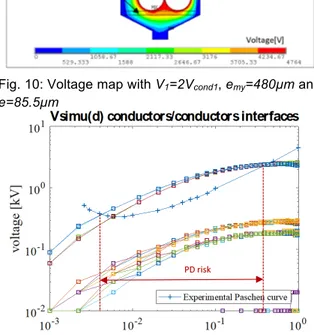
After 2 iterations, the tool probably suppresses the risk of PD in conductor/conductor interfaces and conductor/slot interfaces (under the hypothesis of a 33% overshoot on Vcond1). However, overshoot due to the inverter can reach twice the nominal voltage (i. e 100% overshoot on Vcond1) [5]. A simulation has been done in this case (Figs. 10 and 11).
PD will probably occur between conductors. Hence the total slot surface is used, the filling factor has to be decrease. This case illustrates the interest of the
future interaction between the 2 tools.
Fig. 10: Voltage map with V1=2Vcond1, emy=480µm and e=85.5µm
Fig. 11: Vsimu(pd=d) conductor/conductor interfaces
for overshoot 100% (ie. V1=2Vcond1) C. Discussion and perspectives
The problem is that in a stator slot, the interfaces wire/wire and wire/slot is not metallic plane/plane electrodes. Indeed, the insulation coating creates a dielectric barrier discharge (DBD) configuration. Moreover, considering round wires, the geometry of the wire/wire and wire/slot interfaces are respectively cylinder/cylinder and cylinder/plane. Due to these facts, one cannot consider a uniform electric field on these interfaces. The secondary electron emission coefficient γ also changes due to the geometry and the polymer coating. In the literature, there is no way to determinate this coefficient by an analytical formulation due to the complexity of the mechanisms introduced by the polymer coating.
The author [14] quantify the error on field line length on a wire/wire configuration. He considered 2 round wires on which a voltage drop was applied (Fig. 12). He realized a study on the error on the length of the electric field line compared to an assumed straight field lines. For d=1mm the error is about 20%. In the illustrative example, it is assumed that the straight field lines hypothesis is valid for distances between wires and from the slot edge lower than 1mm.
copper copper polyruethane E rr or ( % ) Distance [mm]
Fig. 12: assumed straight field lines (left) & error on field line length (right): U=900V, e=30µm [14]
The author [5] modified the Paschen’s curve. He used the same geometrical configuration than author [14]. He identified the breakdown voltage experimentally. Then he updated the secondary electron emission coefficient g so that the modified Paschen curve intersects the modelled V(pd=d) curve at the coordinates obtained experimentally (Fig.13). This
V(pd=d) curve is the simulated voltage drop along the
assumed straight field line.
Fig. 13: Modified Paschen’s curve for given enamel round wires [5]
III. Interaction between the 2 tools
For bigger overshoot on V1 (cf. §II.2. B) there may be PD risk remaining after the 2 steps. However, considering the given filling factor, the slot insulation has been increased to its maximum. The machine designer must now reconsider is design by reducing this filling factor or changing the number of turns as shown in Fig.14.
Fig. 14: Interaction between the two tools Ø Post processing
Ø V(pd=d) curves vs Paschen curve
Conclusion
Partial discharges (PD) phenomena have to be taken into account in the design process of high specific power machine. For now, the PD tool uses the Paschen’s criterion to conclude on the PD risk for a given winding. However, this criterion was not formulated for enamel covered round wire. Experimental work is under progress in order to establish a more representative criterion. It will lead to a better understanding of the physic of PD, in presence of polymer coating, in a stator slot. The final objective is to integrate these tools in a global optimization process.
Acknowledgment
This project has received funding from the Clean Sky 2 Joint Undertaking under the European Union’s Horizon 2020 research and innovation program under grant agreement No 715483.
References
[1] , X. Roboam, O. Langlois, H. Piquet, B. Morin, C. Turpin, Hybrid power generation system for aircraft electrical emergency network ',IEEE IET
Electrical Systems Transportation , vol 1, 2011. .
[2] F. Barruel, A. Caisley, N. Retiere , J.L. Schanen. ‘Stability Approach for Vehicles DC Power Network: Application to Aircraft On-board System',IEEE 36th Power Electronics Specialists
Conference,2005 .
[3] Hybrid Aircraft Academic reSearch on Thermal & Electrical Components and Systems (HASTECS), Project selected from CFP in Cleansky II (H2020) framework.
[4] E. Sili, J.P. Cambronne and F. Koliatene, “Temperature Dependence of electrical Breakdown Mechanism on the Left of the Paschen
Minimum”, IEEE Trans.Plas.Sci.vol.39, Issue 11, 2011.
[5] S. Duchesne, G. Parent, J. Moenecley, et al,
‘Prediction of PDIV in motor coils using finite
element method. In: Dielectrics (ICD)’, 2016 IEEE
International Conference on Dielectrics, pp.
638-641, 2016.
[6] J. Pyrhönen, T. Jokinen, V. Hrbovcovà, 'Design of Rotating Electrical Machine's. John Wiley & Sons, pp. 281-300, 2008.
[7] G. R. Slemon, 'On the design of High-Performance Surface-Mounted PM Motors', IEEE
Transactions on Industry Applications, vol. 30,
n°1, January/February 1994.
[8] Y. Lefevre, S. El. Aabid, J.F. Llibre, C. Henaux, S. Touhami, 'Performance assessment tool based on loadability concepts', The 18th Symposium on
Applied Electromagnetics and Mechanics, Sept
3-6 2017, France.
[9] S. Touhami, Y. Lefevre, J.F. Llibre, 'Joint Design of Halbach Segment Array and Distributed Stator Winding', IEEE International Conference Electrical
Machine ICEM’2018, Sept 3-6 2018, Greece.
[10] F. Paschen, 'Annalen der Physik', vol 37, pp.69-96, 1889.
[11] Synflex Elektro GmbH, website: http://www.synflex.de.
[12] Enamelled Copper Wires Sona Datasheet, website: http://www.universalmetalproducts.com/ [13] T. W. Dakin et al, “Breakdown of gases in
uniform fields Paschen curves for nitrogen, air and sulfur hexafluoride “, ELECTRA N°32, pp 61-81. [14] L. Benmamas, P. Teste, G. Krebs, E. Odic, F.
Vangraefschepe, T. Hamiti, "Contribution to partial discharge analysis in inverter-fed motor windings for automotive application", Electrical Insulation
![Fig. 1: Propulsion Chain of a Hybrid Aircraft [3]](https://thumb-eu.123doks.com/thumbv2/123doknet/2956668.80956/2.892.466.789.426.628/fig-propulsion-chain-hybrid-aircraft.webp)
![Table 1: Electric machine parameters [9]](https://thumb-eu.123doks.com/thumbv2/123doknet/2956668.80956/3.892.459.797.476.1065/table-electric-machine-parameters.webp)