DOCTORAT DE L'UNIVERSITÉ DE TOULOUSE
Délivré par :Institut National Polytechnique de Toulouse (Toulouse INP) Discipline ou spécialité :
Génie Electrique
Présentée et soutenue par :
M. JEROME THAUVIN le lundi 22 octobre 2018
Titre :
Unité de recherche : Ecole doctorale :
Exploring the design space for a hybrid-electric regional aircraft with
multidisciplinary design optimisation methods
Aéronautique-Astronautique (AA)
Laboratoire Plasma et Conversion d'Energie (LAPLACE) Directeur(s) de Thèse :
M. XAVIER ROBOAM M. MARC BUDINGER
Rapporteurs :
M. MIRKO HORNUNG, TECHNISCHE UNIVERSITAT MUNICH M. STÉPHANE BRISSET, ECOLE CENTRALE DE LILLE
Membre(s) du jury :
Mme DELPHINE RIU, INP DE GRENOBLE, Président M. BRUNO SARENI, INP TOULOUSE, Membre M. MARC BUDINGER, INSA TOULOUSE, Membre M. XAVIER ROBOAM, CNRS TOULOUSE, Membre
Envisagée à partir des 15 à 30 années à venir dans l’industrie aéronautique, la propulsion hybride électrique permet d’intégrer de nouvelles briques technologiques offrant des degrés de liberté supplémentaires pour améliorer les performances des aéronefs, limiter l’utilisation de ressources fossiles et réduire l’impact environnemental des avions. Au-jourd’hui, la technologie hybride électrique est principalement appliquée aux transports terrestres, aux voitures, aux bus et aux trains, mais aussi aux navires. La faisabilité pour le transport aérien doit encore être établie et l’amélioration des performances des aéronefs reste à démontrer. Cette thèse vise à évaluer les gains énergétiques apportés par l’hybridation électrique d’un avion régional de 70 places.
Tout d’abord, les opportunités d’économie d’énergie sont identifiées à partir de l’analyse des rendements propulsifs et aérodynamiques d’un avion bi-turbopropulsé conventionnel. Les gains potentiels provenant de la variation de la taille des moteurs principaux et de nouvelles gestions de puissance par l’utilisation de batteries sont étudiés. De plus, les possibles améliorations aérodynamiques émanant de nouveaux positionnements des hélices sont considérées. Pour chaque sujet, des analyses simplifiées fournissent une estimation d’économie d’énergie. Ces résultats sont ensuite utilisés pour sélectionner quatre systèmes propulsifs électrifiés qui sont étudiés plus en détail dans la thèse: un hybride parallèle, un turboélectrique avec propulsion distribuée, un turboélectrique partiel à hélices hypersustentatrices, et un tout-électrique.
L’évaluation des avions hybrides électriques sélectionnés est d’autant plus difficile que le dimensionnement des différentes composants, les stratégies de gestion d’énergie et les profils de mission que l’on peut imaginer sont nombreux et variés. En outre, le processus global de conception de l’avion et les outils d’évaluation doivent être adaptés en conséquence. L’outil interne de conception par optimisation multidisciplinaire d’Airbus nommé XMDO, qui inclut la plupart des modifications requises, est finalement sélectionné et développé au cours de la thèse. Par exemple, de nouveaux modèles paramétriques de composants (voilure soufflée, moteur électrique, turbine à gaz, hélice, etc...) sont créés, une formulation générique pour résoudre l’équilibre du système de
propulsion est mise en place, et les modèles de simulation de décollage et d’atterrissage sont améliorés.
Afin d’évaluer l’efficacité énergétique des avions hybrides électriques, un avion de référence équipé d’un système propulsif conventionnel est d’abord optimisé avec XMDO. Différents algorithmes d’optimisation sont testés, et la consistance de la nouvelle méthode de conception est vérifiée.
Par la suite, les configurations hybrides électriques sont toutes optimisées selon les mêmes exigences de conception que l’avion de référence. Pour les composants électriques, deux niveaux de technologie sont définis selon la date d’entrée en service de l’aéronef. Les résultats d’optimisation pour le turbo-électrique et le turbo-électrique partiel sont utilisés pour mieux appréhender les gains aérodynamiques potentiels identifiés en première partie de thèse. Les optimisations pour l’hybride parallèle, comprenant différents scénarios de recharge batterie, mettent en évidence les meilleures stratégies de gestion d’énergie lorsque des batteries sont utilisées comme sources d’énergie secondaire. Tous les résultats sont finalement comparés à la référence en termes de consommations de carburant et d’énergie, pour les deux niveaux de technologie électrique.
La dernière partie de la thèse se concentre sur l’avion tout électrique. Elle vise à identifier l’énergie spécifique minimale requise pour les batteries en fonction de la distance maximale à parcourir. Une étude de sensibilité est également réalisée en fonction de la date d’entrée en service pour les autres composants électriques.
Envisioned in the next 15 to 30 years in the aviation industry, hybrid-electric propulsion offers the opportunity to integrate new technology bricks providing additional degrees of freedom to improve overall aircraft performance, limit the use of non-renewable fossil resources and reduce the aircraft environmental footprint. Today, hybrid-electric technology has mainly been applied to ground-based transports, cars, buses and trains, but also ships. The feasibility in the air industry has to be established and the improvement in aircraft performance has still to be demonstrated. This thesis aims to evaluate the energy savings enabled by electric power in the case of a 70-seat regional aircraft.
First, energy saving opportunities are identified from the analysis of the propulsion and aerodynamic efficiencies of a conventional twin turboprop aircraft. The potential benefits coming from the variation of the size of prime movers and the new power managements with the use of batteries are studied. Also, possible aerodynamic improvements enabled by new propeller integrations are considered. For each topic, simplified analyses provide estimated potential of energy saving. These results are then used to select four electrified propulsion systems that are studied in more detail in the thesis: a parallel-hybrid, a turboelectric with distributed propulsion, a partial-turboelectric with high-lift propellers and an all-electric.
Evaluating the selected hybrid-electric aircraft is even more challenging that the sizing of the different components, the energy management strategies and the mission profiles one can imagine are many and varied. In addition, the overall aircraft design process and the evaluation tools need to be adapted accordingly. The Airbus in-house Multidisciplinary Design Optimisation platform named XMDO, which includes most of the required modifications, is eventually selected and further developed during the thesis. For examples, new parametric component models (blown wing, electrical motor, gas turbine, propeller, etc. . . ) are created, a generic formulation for solving the propulsion system equilibrium is implemented, and simulation models for take-off and landing are improved.
In order to evaluate the energy efficiency of the hybrid-electric aircraft, a reference aircraft equipped with a conventional propulsion system is first optimised with XMDO. Different optimisation algorithms are tested, and the consistency of the new design method is checked.
Then, all the hybrid-electric configurations are optimised under the same aircraft design requirements as the reference. For the electrical components, two levels of technology are defined regarding the service entry date of the aircraft. The optimisation results for the turboelectric and the partial-turboelectric are used to better understand the potential aerodynamic improvements identified in the first part of the thesis. Optimisations for the parallel-hybrid, including different battery recharge scenarios, highlight the best energy management strategies when batteries are used as secondary energy sources. All the results are finally compared to the reference in terms of fuel and energy efficiencies, for the two electrical technology levels.
The last part of the thesis focuses on the all-electric aircraft, and aims at identifying the minimum specific energy required for batteries as a function of the aircraft design range. A trade study is also carried-out in accordance with the service entry date for the other electrical components.
Je souhaite dans un premier temps remercier les membres du Jury. Merci à Delphine RIU qui a accepté de présider ce jury de thèse. Je remercie également les rapporteurs, Mirko HORNUNG et Stéphane BRISSET, pour le temps et l’attention qu’ils ont consacrés à la relecture du manuscrit et pour leurs remarques sur mon travail. Enfin, merci à Jean HERMETZ d’avoir accepté notre invitation.
J’adresse également toute ma reconnaissance à mes encadrants de thèse, Xavier ROBOAM, Marc BUDINGER, et Bruno SARENI qui m’ont suivi du côté académique, et à Guillaume BARRAUD du côté industriel.
Merci Xavier pour ta confiance et tes remarques constructives sur mes travaux de recherche, malgré un sujet de thèse qui a fortement dévié de sa trajectoire initiale. Je te remercie également de m’avoir donné la possibilité de terminer plus sereinement la rédaction du manuscrit au LAPLACE.
Marc, je te remercie vivement pour ton implication dans mes travaux de thèse. Merci de m’avoir fait confiance dès l’obtention de mon diplôme d’ingénieur, me permettant de rejoindre ton équipe à l’Institut Clément Ader, puis, par la suite, de réaliser cette thèse. Tu t’es toujours investi pleinement pour tenter d’assurer la continuité de mes activités professionnelles, mais aussi pour que je dispose des ressources matérielles et humaines nécessaires au bon déroulement de la thèse. Je t’en suis très reconnaissant. Enfin, merci pour les séances d’enseignement que nous avons pu partager, j’y ai pris un grand plaisir.
Bruno, je souhaite tout d’abord te remercier pour ta disponibilité et tes nombreux conseils concernant la rédaction du manuscrit et la préparation de la soutenance. De plus, je t’adresse toute ma gratitude pour ton aide en Optimisation qui a été précieuse. Enfin, merci pour ta grande sympathie.
Guillaume, je te remercie de m’avoir permis de vivre cette expérience incroyable au sein des Avant-Projets d’Airbus. Merci pour ton écoute et ton soutien durant ces trois années. Tu as toujours su apporter un regard critique et des remarques pertinentes pour la progression de mes travaux, même sur des sujets nouveaux. J’ai beaucoup appris
grâce à toi, et je te remercie pour ton accompagnement de qualité qui a fortement contribué au développement de l’ingénieur-docteur que je suis aujourd’hui.
Je souhaite également remercier Matthieu MEAUX d’avoir partagé avec moi sa plateforme MDO et pour le temps qu’il m’a accordé. Sans cet outil, la complexité des études et la richesse des résultats auraient été bien moindres. Merci également à Alexis, Johannes, Vincent, et Thanh pour leur aide sur de nombreux développements de la plateforme.
Je remercie également Matthias qui a travaillé plusieurs mois sur le pré-dimensionnent de différents moteurs pour me permettre de construire le modèle utilisé dans cette thèse.
Je souhaite remercier Philippe ESCARNOT, Laurence BERNADAC et Laurent MARIN pour leur accueil au sein des Avant-Projets d’Airbus. Merci à tous mes collègues des Avant-Projets pour leur soutien, leur sympathie et l’excellente ambiance de travail. Je mesure la chance de pouvoir rejoindre l’équipe après cette thèse ! Merci à toute l’équipe : Matthieu, Anthony, Antoine, Julien, Mathieu, Renaud, André, Camil, Catherine, Céline, Sole, Philippe, Thierry, Claire(s), Marylène, Guillaume, Julien, Mickaël, Sergio, Cécile, Michel, Yann, Eric, Gilles, Adrien, Jean-Pierre, Hema, Jérôme, Sara, Fabien et Hauke. Un remerciement particulier à Olivier pour ses illustrations 3D, ainsi qu’à Paul qui a relu certains chapitres de ce manuscrit.
Je remercie également mes anciens camarades de l’Institut Clément Ader. Malgré mes passages irréguliers, la convivialité était toujours au rendez-vous : merci partic-ulièrement à Florian, Nicolas, Simon, Scott, Francesco, Aurélien, Luis et Victor. Je suis également reconnaissant envers mes collègues de bureau du LAPLACE, où la bonne ambiance a aiguayé la fin de la rédaction : Matthieu, Sami et Abdelkader, merci à vous.
Enfin, mes remerciements s’adressent à ma famille et belle-famille qui m’ont toujours soutenu pendant ces trois années peu ordinaires.
Je remercie particulièrement ma belle-mère, Yvonne, pour sa présence auprès de ma femme et de ma fille; me permettant de finaliser plus sereinement cette thèse.
Je remercie également mes parents, Colette et Gabriel, qui m’ont toujours encouragé pendant mes études et dont le soutien m’a permis d’accéder au métier qui m’a toujours
fasciné, celui de concevoir des avions. Merci à ma sœur, Céline, d’avoir toujours eu les bonnes attentions au bon moment.
Mes derniers mots de remerciements s’adressent à ma femme, Juliette. Ces trois années de thèse ont été marquées par de nombreux évenements heureux et par des périodes plus difficiles que tu m’as aidé à gérer. Ton soutien a été permanent et je mesure l’importance de tes efforts. Quelques mots ne sont évidemment pas suffisants pour t’exprimer mon immense reconnaissance. Merci pour la femme et la mère extraordinaire que tu es. La page se tourne, place à notre nouvelle vie.
1 Introduction
1 New potentials enabled by electric power for regional aircraft
5
1.1 Aircraft of interest . . . . 6
1.2 Transient energy storage . . . . 9
1.2.1 Energy sharing . . . . 9
1.2.2 Energy recovering . . . . 16
1.3 Power management and efficiency . . . . 22
1.3.1 Propeller efficiency . . . . 23
1.3.2 Engine operating point . . . . 25
1.3.3 Number of prime movers and size effect . . . . 29
1.3.4 Secondary energy source: start and stop . . . . 31
1.4 Improved aerodynamics . . . . 32
1.4.1 Differential thrust . . . . 32
1.4.2 Blown wing . . . . 33
1.4.3 Boundary layer ingestion . . . . 36
1.4.4 Wingtip propellers . . . . 40
1.5 Fuel replacement . . . . 43
2 Hybrid-electric regional aircraft configurations 49 2.1 A common airframe geometry . . . . 50
2.2 A reference propulsion system . . . . 51
2.3 Different electrified propulsion systems . . . . 52
2.3.1 Comparison of electrical components . . . . 54
2.3.2 Studied electrified propulsion systems . . . . 60
3 Multidisciplinary design optimisation for aircraft preliminary design
3.1 Multidisciplinary design optimisation . . . . 68
3.1.1 Aircraft design: a multi-disciplinary optimisation problem . . . 68
3.1.2 Multidisciplinary Design Optimisation architectures . . . . 71
3.2 Conventional aircraft design process . . . . 74
3.2.1 General work-flow . . . . 75
3.2.2 Mission performance evaluation . . . . 76
3.2.3 Mass-Performance loop . . . . 78
3.2.4 Evaluation of the requirements . . . . 82
3.2.5 Evaluation of the optimisation criteria . . . . 83
3.2.6 Overall aircraft design software . . . . 84
3.3 New needs for hybrid-electric aircraft tradespace analyses . . . . 85
3.3.1 Mission performance evaluation . . . . 86
3.3.2 Towards a multi-mission Mass-Performance loop . . . . 88
3.3.3 Software adaptation . . . . 92
4 The XMDO tool 95 4.1 Origins . . . . 96
4.2 Overall framework . . . . 97
4.2.1 General vehicle description . . . . 99
4.2.2 Mission evaluation . . . 101
4.2.3 (X)MDO architecture . . . 104
4.2.4 Optimisation features . . . 105
4.3 Trajectories and control laws . . . 107
4.3.1 Trajectories . . . 107
4.3.2 Control laws . . . 109
4.4 Solving aircraft dynamic equations . . . 112
4.4.1 Airborne . . . 112
4.4.2 Ground run . . . 115
4.4.3 Take-Off and Landing segments . . . 116
4.4.4 Note on Newton-Raphson solver . . . 121
4.5 Propulsion system and power flows . . . 122
4.5.1 Rating formulation in XMDO . . . 123
4.5.2 New propulsion system modelling . . . 126
5 Reference aircraft optimisation 133 5.1 Aircraft modelling . . . 134 5.1.1 Geometry . . . 134 5.1.2 Mass . . . 134 5.1.3 Aerodynamics . . . 134 5.1.4 Propulsion . . . 136 5.2 Component modelling . . . 137 5.2.1 Fuselage . . . 138 5.2.2 Nacelle . . . 138 5.2.3 Wings . . . 138 5.2.4 Horizontal stabiliser . . . 139 5.2.5 Vertical stabiliser . . . 139 5.2.6 Equipments . . . 140 5.2.7 Non-propulsive load . . . 140 5.2.8 Turboshaft . . . 140 5.2.9 Propeller . . . 141 5.2.10 Power gearbox . . . 141 5.3 Optimisation . . . 142 5.3.1 Missions . . . 142
5.3.2 Constraints and objective function . . . 145
5.3.3 Optimisation algorithms and penalty functions . . . 147
5.4 Optimisation results . . . 148
5.4.1 Optimisation cases and design variables . . . 148
5.4.2 Convergence rate . . . 149
5.4.3 S1 versus S2 . . . 150
5.4.4 Deeper analysis of S1 . . . 151
5.4.5 Comparison with ATR72 . . . 159
6 Hybrid-electric aircraft optimisations 161 6.1 General optimisation case . . . 162
6.1.1 Airframe modelling . . . 162
6.1.2 Missions and objective function . . . 163
6.2 Additional component models . . . 163
6.2.1 Electric machine . . . 164
6.2.2 In-line gearbox . . . 164
6.2.3 High-lift propeller . . . 165
6.2.5 Power electronics . . . 166
6.2.6 Battery . . . 167
6.2.7 Summary of electrical component assumptions . . . 168
6.3 Aerodynamic improvements: TE4 and PT8 . . . 169
6.3.1 Turboelectric TE4 . . . 169
6.3.2 Turboelectric PT8 . . . 178
6.4 New energy management: PH and PH-R . . . 184
6.4.1 Parallel-hybrid PH . . . 184
6.4.2 Parallel-hybrid with battery recharge PH-R . . . 191
6.5 Comparison of fuel and energy efficiencies . . . 194
6.6 Technology target setting: all-electric AE . . . 196
6.6.1 Airframe and component models . . . 196
6.6.2 Missions, objective function and constraints . . . 197
6.6.3 Propulsion . . . 197
6.6.4 Optimisation results . . . 198
Conclusion
References
Appendix A XMDO: optimisation features Appendix B Basics of B-splines
Appendix C Aerodynamic model Appendix D Turboshaft model Appendix E Propeller model Appendix F Gearbox model
Appendix G Permanent magnet synchronous machine model 203 209 219 227 229 241 253 267 277
AoA Angle of Attack
BLI Boundary Layer Ingestion CAS Calibrated Air speed CG Centre of Gravity COC Cash Operating Cost DOC Direct Operating Cost EIS Entry Into Service FL Field Length FPA Flight Path Angle HLP High-Lift Propeller HTP Horizontal Tail Plane IDF Individual Design Feasible IM Induction Machine
ISA International Standard Atmosphere LHV Lower Heating Value
LW Landing Weight
MAC Mean Aerodynamic Chord MCL Maximum Climb rating
MDF Multidisciplinary Design Feasible MDO Multidisciplinary Design Optimisation MLW Maximum Landing Weight
MTO Maximum Take-Off rating MTOW Maximum Take-off Weight MZFW Maximum Zero Fuel Weight NPL Non-Propulsive Load
OAD Overall Aircraft Design OEI One Engine Inoperative OEW Operating Empty Weight
PHE Potential for Hybridisation in Energy PHP Potential for Hybridisation in Power PMSM Permanent Magnet Synchronous Machine SFC Specific Fuel Consumption
SOC State Of Charge
STOL Short Take-Off and Landing TAS True Air Speed
TLAR Top Level Aircraft Requirements TOFL Take-Off Field Length
TOW Take-Off Weight
VTOL Vertical Take-Off and Landing VTP Vertical Tail Plane
WRSM Wound Rotor Synchronous Machine ZFW Zero Fuel Weight
Propulsion system innovations have been a key driver of aeronautic evolution. The increase of propulsion performance and efficiency has enabled aircraft to travel at higher speeds over longer ranges while carrying larger payloads. Today the improvement of conventional engine technologies is reaching an asymptote, while future demands on the air transport systems still dictate that aircraft should be less polluting, less noisy and more fuel efficient. In this context, electrified propulsion systems offer the opportunity to transform in the long term the landscape of aircraft propulsion and furthermore enable new aircraft configurations.
In this thesis the term hybrid-electric aircraft is used to define an aircraft that operates more than one type of energy source and/or power flow for propulsion means. Aircraft propulsion is indeed currently limited to kerosene and mechanical transmissions. Hybrid-electric propulsion offers the opportunity to integrate new technology bricks providing additional degrees of freedom to improve overall aircraft performance, limit the use of non-renewable fossil resources and reduce the aircraft environmental footprint. Today, hybrid-electric technology has mainly been applied to ground-based transports, cars, buses and trains, but also ships. However, the feasibility of hybrid-electric propusion in the air industry has to be established and the improvement in aircraft performance has still to be demonstrated. This thesis aims to evaluate the new energy savings enabled by electric power in the case of a 70-seat regional aircraft.
Designing a hybrid-electric aircraft is even more challenging that the sizing of the different components, the energy management strategies and the mission profiles one can imagine are many and varied. This thesis also adresses design methods to deal with the optimisation of the airframe, the propulsion system, the control laws and the trajectories in the same workflow.
Chapter 1evaluates the new energy saving opportunities with respect to a reference
conventional aircraft that was designed for the purpose of this chapter only. These opportunities account for the potential benefits, but do not include the penalties
coming from the additional mass or drag imparted by the use of electrical components. The correct evaluation of energy savings requires the implementation of new design methodologies and new design models that are presented in the next chapters.
To begin with, the potential benefits of transient energy storage are estimated. The mission profile of the conventional aircraft is analysed according to energy variations and the results are compared to typical figures for cars, trains, and ships. In addition, the opportunities of recovering energy in descent and during landing are evaluated, and a quick study tends to highlight the best energy management strategies in descent. The power chain efficiency of the reference aircraft is also studied along its nominal mission in order to identify potential improvements enabled by hybridisation, and a particular attention is given to the propeller and the gas turbine. For the latter, the scale effect on efficiency is discussed.
Then, this chapter addresses potential aerodynamic improvements enabled by new propeller or fan integrations. Concepts such as differential thrust, blown wing, boundary layer ingestion and wing-tip propellers are analysed. In particular, a first order study regarding the implementation of boundary layer ingestion on the reference aircraft is presented.
Lastly, the opportunities of replacing kerosene by a greener source of energy are commented. A special focus is given on batteries and fuel cells as means of providing this energy on-board.
Chapter 2 introduces the different aircraft configurations that are studied in more
detail in the last chapters of the thesis.
The general airframe configuration is described, and the conventional propulsion system that is used to optimise the reference aircraft is presented.
Then, the chapter focuses on electrified propulsion system architectures, and starts by addressing their classification. Since different technologies of electrical components can be used for the purpose of transmitting power from generators to propellers, a comparison of serial arrangements of these components is provided. Finally, the selection of electrified propulsion systems for this thesis is commented in accordance with the analyses of Chapter 1, and the associated aircraft configurations are presented: a parallel-hybrid, a turboelectric with distributed propulsion, a partial-turboelectric with high-lift propellers and an all-electric.
Chapter 3 deals with the aircraft design process addressed by the Overall Aircraft
After presenting the constrained multidisciplinary optimisation problem that must be solved when designing an aircraft, a brief overview of the most suitable multidisci-plinary optimisation methods is provided.
The second part focuses on the case of conventional aircraft drawing energy from a unique source, namely kerosene. A special attention is given to the mission per-formance evaluation during which the fuel burn is calculated, and to the iterative Mass-Performance Loop sub-process required to define the total structural weight. Typical constraints and optimisation criteria are also commented, and existing software for carrying out overall aircraft design studies are presented.
The last part addresses the case of hybrid-electric aircraft that can be designed with more than one type of energy storage device. Using energy from multiple sources involves additional variables in solving the design optimisation problem, requiring modifications of the classical design process, and in particular of the performance evaluation modules and of the Mass-Performance Loop. Modifications are proposed, including a new mathematical formulation of the latter. Finally, the most promising software for conducting the studies of this thesis are discussed.
Chapter 4 is dedicated to the Multidisciplinary Design Optimisation (MDO)
platform that was eventually selected.
First, the origins and history of this tool, called XMDO, are introduced. After providing an overview of the tool framework, this chapter addresses the XMDO top level notions and methods that are used to model a vehicle and to evaluate its performance along a mission. The MDO architecture implemented in the tool is also discussed, and the tool optimisation features are presented.
The other sections focus on detailed implementations in XMDO: trajectory and control law modelling, aircraft equations of motion and solving, and generic propulsion system modelling. For each topic, the section begins with the presentation of the initial implementation in XMDO and follows with the main developments brought by the author of this manuscript.
In the last section, the different constraints that are defined throughout the chapter for solving the global MDO problem are summarised.
Chapter 5focuses on the optimisation of the reference aircraft with XMDO.
The design models that are used at aircraft level but also at component levels are first presented. A great deal of work was dedicated to the development of these models: turboshaft, gearbox, propeller, blown wing, etc.
Then, the optimisation cases are defined: the different missions, the constraints and the objective function, and the optimisation algorithms that were selected.
Lastly, two optimisation cases deferring from each other by the set of missions included in the optimisation process are compared. In the first case, the objective function is calculated according to a single mission while the second case uses a weighted objective function. The main outputs of these two optimisations are provided and discussed.
Chapter 6 deals with the optimisation of the different hybrid-electric aircraft
configurations presented in Chapter 2. In the description of each optimisation case, a particular attention is given to the assumptions relating to the propulsion system modelling and the constraints considered in the optimisation problem. Throughout this chapter, results are compared to the conventional aircraft optimised in Chapter 5.
First, the models and assumptions applying to all the aircraft configurations are exposed, and the different missions considered in the optimisation cases are presented.
Then, the component models that were developed and implemented for the purpose of electrified propulsion system studies are addressed. In order to include the effect of technology improvements with time, two technology levels are defined according to the service entry date of the aircraft: 2025 and 2030+.
The third section presents and analyses the optimisation results for the turboelec-tric and the partial turboelecturboelec-tric, the two architectures that were selected to better understand the potential aerodynamic improvements identified in Chapter 1.
The fourth section deals with the optimisation of the parallel-hybrid that was defined for the study of fuel savings brought by new energy management strategies. Different battery recharge scenarios are considered, including in-flight recharging.
Afterwards, the results of the previous sections are all compared in terms of fuel and energy consumptions versus the reference aircraft, and conclusions are drawn.
The last section is dedicated to the all-electric aircraft, and aims at identifying the minimum specific energy required for batteries as a function of the aircraft design range. A trade study is also carried-out in accordance with the service entry date for the other electrical components.
New potentials enabled by electric
power for regional aircraft
Contents
1.1 Aircraft of interest . . . . 6
1.2 Transient energy storage . . . . 9
1.2.1 Energy sharing . . . 9
1.2.2 Energy recovering . . . 16
1.3 Power management and efficiency . . . . 22
1.3.1 Propeller efficiency . . . 23
1.3.2 Engine operating point . . . 25
1.3.3 Number of prime movers and size effect . . . 29
1.3.4 Secondary energy source: start and stop . . . 31
1.4 Improved aerodynamics . . . . 32
1.4.1 Differential thrust . . . 32
1.4.2 Blown wing . . . 33
1.4.3 Boundary layer ingestion . . . 36
1.4.4 Wingtip propellers . . . 40
1.5 Fuel replacement . . . . 43
This chapter aims to review the new energy saving opportunities enabled by electric power with respect to a reference conventional aircraft that was designed for the purpose of this chapter. These opportunities account for the potential benefits, but do
not include the penalties coming from the additional mass or drag imparted by the use of electrical components. The correct evaluation of energy savings requires the implementation of new design methodologies and new design models that are presented in the next chapters.
To begin with, the potential benefits of transient energy storage are estimated. The mission profile of the conventional aircraft is analysed according to energy variations and the results are compared to typical figures for cars, trains, and ships. In addition, the opportunities of recovering energy in descent and during landing are evaluated, and a quick study tends to highlight the best energy management strategies in descent. The power chain efficiency of the reference aircraft is also studied along its nominal mission in order to identify potential improvements enabled by hybridisation, and a particular attention is given to the propeller and the gas turbine. For the latter, the scale effect on efficiency is discussed.
Then, this chapter addresses potential aerodynamic improvements enabled by new propeller or fan integrations. Concepts such as differential thrust, blown wing, boundary layer ingestion and wing-tip propellers are analysed. In particular, a first order study regarding the implementation of boundary layer ingestion on the reference aircraft is presented.
Lastly, the opportunities of replacing kerosene by a greener source of energy are commented. A special focus is given on batteries and fuel cells as means of providing this energy on-board.
1.1
Aircraft of interest
The Regional Aircraft class usually covers both Regional Jets and Turboprops categories. Regional Jets are jet aircraft with a maximum range capability from 1,000 nautical miles1
to 2,000 nautical miles, a typical seat capacity between 70 and 100 passengers and flying at a speed below Mach 0.80. For example, Boeing 717, Bombardier CRJ700/900/1000, Embraer EMB170/175/190/195, Comac ARJ-21, Sukhoi Superjet or Mitsubishi MRJ fall into this category. Turboprops are propeller aircraft with a seat capacity ranging from 50 to 75 passengers and a cruise speed generally between Mach 0.4 and Mach 0.65. ATR42/72, Bombardier Q300/400 and Saab 2000 are members of the Turboprops family. They evidently fly over shorter ranges even if some of them, in particular the Saab 2000, are able to reach 1000 nm.
This thesis focuses on a 70-seat turboprop aircraft. The design of this aircraft, powered by a hybrid or a conventional propulsion system, depends heavily on the range capability requirement. In addition, setting the range capability too high will make the design of a hybrid aircraft even more difficult (see Section 1.2.1). In order to set the right target for the maximum range capability of our aircraft, it is always useful to look at the flight distributions based on current market or predictions. Antcliff and Capristan [9] provide a 2030 prediction of the distance distribution for regional trips between airports in the United States (Figure 1.1). It shows that setting the maximum range capability to 400 nm (741 km) allows capturing 90% of the regional market. Even if these data are related to United States regional market, they are fairly representative of the global regional market. For this reason the thesis deals with the design of a turboprop aircraft capable of flying up to 400 nm.
0 20 40 60 80 100 0 200 400 600 800 C um ul at iv e T ri ps ( % ) Range (nm) 90 %
Fig. 1.1 Regional Jet and Turboprop cumulative trip distribution versus mission range [9]
In order to produce non-confidential but representative data for this first chapter, a conventional twin-turbo propeller (Figure 1.2) was designed with an Airbus internal tool named OCCAM2. This tool results from more than ten years of research and
has been used in several public scientific works [12] [14] [102]. A description of the tool, formerly named SiMCAD (Simple Models for Conceptual Aircraft Design), is available in [14]. OCCAM is a fast aircraft design tool based on analytical models that can be calibrated thanks to a database comprising around 60 aircraft. The effect of the modification of one or several design parameters on aircraft performance can be evaluated in a few seconds. Throughout this chapter, the conventional twin-turbo
Fig. 1.2 Project aircraft TP1
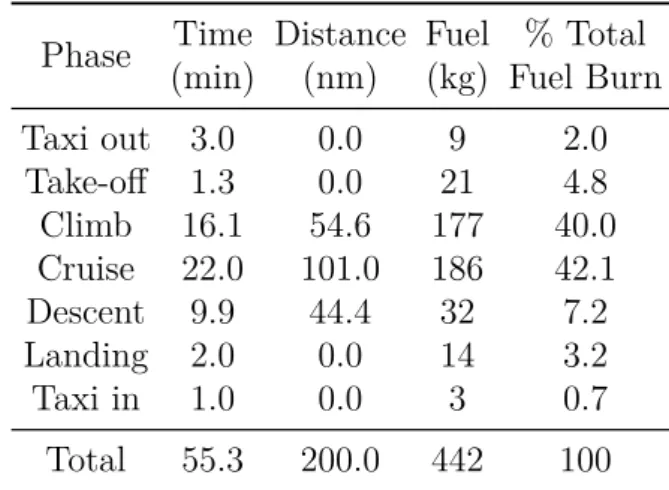
Phase Time Distance Fuel % Total(min) (nm) (kg) Fuel Burn Taxi out 3.0 0.0 9 2.0 Take-off 1.3 0.0 21 4.8 Climb 16.1 54.6 177 40.0 Cruise 22.0 101.0 186 42.1 Descent 9.9 44.4 32 7.2 Landing 2.0 0.0 14 3.2 Taxi in 1.0 0.0 3 0.7 Total 55.3 200.0 442 100 Table 1.1 TP1 mission overview propeller aircraft designed with OCCAM is named TP1. The engine size and the wing area are constrained by the time to climb (17 min) and the approach speed (113 kts) requirements, respectively, which is generally the case for turboprop aircraft of this category. More details about the TP1 aircraft design requirements are provided in Table 3.1 of Chapter 2. Despite the range capability of 400 nm, the aircraft performance is evaluated on a 200 nm mission (Table 1.1) as this aircraft is expected to operate most of its life on such range (57th percentile of the range distribution of Figure 1.1).
The TP1 aircraft is equipped with two turbopropeller engines, each of them providing a maximum power of 2,500 horsepower3 (1.870 MW) at take-off. Figure 1.3 provides the
power profile of one engine along the 200 nm mission. Note that it is common to express operating speeds in terms of Mach number (M) or Calibrated Air Speed (CAS4). At first
order, a given Calibrated Air Speed describes a given dynamic pressure acting on the aircraft. The red curve shows the maximum power than can be provided continuously by the engine along the trajectory without overworking the engine, and corresponding to the Maximum Climb rating (MCL) [138]. During take-off the Maximum Take-Off rating (MTO) of the engine is used providing augmented power versus MCL rating, enabled by higher combustion temperatures that are permitted for up to 5 minutes of operation. Finally, the maximum continuously available power of the engine inevitably falls with altitude because of the decreasing air density.
31 horsepower ≈ 745.7 watts
0 200 400 600 800 1000 1200 1400 1600 1800 2000 0 10 20 30 40 50 60 S ha ft pow er pe r eng ine (kW) Time (min) Power profile
Maximum available power (MCL rating)
take-off climb 170 kCAS cruise 20,000 ft M0.45 descent 220 kCAS approach & landing taxi-in taxi-out
Fig. 1.3 Power profile of the TP1 aircraft
1.2
Transient energy storage
In this section, the power profile of the TP1 aircraft is analysed according to energy variations. Also, the opportunities of recovering energy in descent and during landing are evaluated.
1.2.1
Energy sharing
Generally, for hybrid architectures using energy storage devices, the main source of power provides the average load of the mission while energy storage devices provide peak loads. This allows the main source of power to be downsized and to increase the overall efficiency of the power generating system. Akli [5] (French written) defined two criteria to assess the relevance of a propulsion system to be hybridised with energy storage devices: the potential for hybridisation in power and the potential for
hybridisation in energy. These indicators are also addressed in english in [134].
The evaluations of these indicators are based on the analysis of the power profile of the non-hybrid power generating system. The definitions proposed by Akli [5] are presented hereafter:
The potential for hybridisation in power P HPA expresses the potential reduc-tion in size of the main source of power enabled by the use of an energy storage
(P )
max 1t
P (t)
1(P )
moy 1 (a) Mission m1, P HPA = 50%(P )
max 2t
P (t)
2(P )
moy 2 (b) Mission m2, P HPA= 30%Fig. 1.4 Two power profiles and associated values for P HPA [5]
device. It is defined by Equation 1.1, where Pmoy is the timed-average value of the required power during the mission and Pmax is the maximum value of the power profile. Figure 1.4 better illustrates the calculation of P HPA.
P HPA= 1 −
Pmoy
Pmax (1.1)
This definition assumes that the downsized power source has a maximum output power equal to Pmoy and is able to continuously provide Pmoy over the mission. Also the power that must be provided by the downsized power source is equal to (1 − P HPA) times the maximum power that the non-hybrid power source was
able to produce (i.e. Pmax).
For reasons linked to power density and rarefied air operation, the main power sources of hybrid aircraft will likely remain gas turbines. Because the maximum available output power of a gas turbine evolves with altitude, the proposed formula is thus incompatible with our case study requiring a new definition presented later in this section.
The potential for hybridisation in energy P HEA is defined to characterise the variation of the stored energy throughout the mission if the main power source is downsized as described in the definition of P HPA. Since the downsized power source continuously provides Pmoy in such case, the stored energy Es at time t is then defined by Equation 1.2.
Es(t) = Z t
ti
t
P (t)
1(P )
moy 1(P )
max 1(E (t))
S 1(E )
u 1t
e (a) Mission m1, P HPA= 50%, Eu= 7et
P (t)
2(P )
moy 2(P )
max 2(E (t))
S 2(E )
u 2t
e (b) Mission m2, P HPA = 50%, Eu= 3eFig. 1.5 Two power profiles with same P HPA but different values for Eu [5]
The useful energy Eu that is representative of the energy storage capacity is defined by Equation 1.3.
Eu= max
ti≤t≤tfEs(t) − minti≤t≤tfEs(t) (1.3)
The definitions of Es and Eu are illustrated in Figure 1.5 which compares two different missions having the same P HPA.
The author defined the P HEA as the ratio of the maximum power of the mission profile Pmax to the useful energy Eu of the storage device (Equation 1.4).
P HEA=
Pmax
Eu (1.4)
P HEA is thus homogeneous to a frequency characterizing the variations of the stored energy. Also for a given Pmax, it can be stated that the smaller the P HEA, the larger the required capacity of the energy storage. The definition of the potential for hybridisation in energy is slightly modified in this thesis for a better characterisation of the storage unit.
The new definitions of potential for hybridisation in power and potential for hybridisation in energy proposed for analysing the power profile of the TP1 aircraft shown in Figure 1.3 are described next.
The definition of P HPA assumes that the energy provided by the storage unit equals the energy it received over the mission. This assumption is used as a starting point for defining the new potential for hybridisation in power P HPT. This energy management strategy is surely not best suited for hybrid aircraft operation but is convenient for the purpose of mission profile comparison. Let Pmission be the required power for flying the mission (i.e. blue curve of Figure 1.3). Also, let PmaxN H be the
maximum power that can be continuously provided by the non-hybrid gas turbine (i.e. red curve of Figure 1.3). Finally, let kdown be the ratio of the maximum continuous available power of the downsized gas turbine to PmaxN H under given flight conditions.
kdown is assumed constant over the mission, the engine power lapse rates with altitude and speed being independent of the engine size to the first order. The stored energy
Es at time t is then defined by Equation 1.5.
Es(t) = Z t
ti
kdownPmaxN H(τ) − Pmission(τ)dτ (1.5)
Based on the first statement of this paragraph, kdown must satisfy Es(tf) = 0 (i.e. the energy storage unit is recharged to its initial state), thus defining kdown such as written in Equation 1.6 where the mathematical operator < . > returns the timed-average value of the input function.
kdown=
< Pmission>
< PmaxN H >
(1.6)
The potential for hybridisation in power P HPT expressing the potential reduction in size of the non-hybrid gas turbine enabled by the use of an energy storage device is therefore taken equal to 1 − kdown as written in Equation 1.7.
P HPT = 1 −
< Pmission>
< PmaxN H >
(1.7) Similarly to the definition of P HPA, P HPT = 0 expresses a mission profile that is strictly unsuitable for the downsizing of the main power source through hybridisation while P HPT = 1 expresses a mission profile that firmly supports it. Also, if the maxi-mum available output power PmaxN H of the non-hybrid source of power is independent
maxi-mum value of Pmission, then Equation 1.7 is strictly identical to the definition of P HPA.
The potential for hybridisation in energy P HET is defined as the ratio of the maximum power delivered or received by the energy storage unit during the mission to the useful energy Eu, such as written in Equation 1.8. The expression of the useful energy Eu in Equation 1.3 still holds but the stored energy Es(t) is to be calculated from Equation 1.5. P HET is still homogeneous to a frequency, which relates in this case to the inverse of a time constant that characterises the storage unit in terms of dynamic performance and can be placed in the Ragone chart accordingly (Figure 1.6).
P HET =
maxti≤t≤tf|Pmission(t) − (1 − P HPT)PmaxN H(t)|
Eu (1.8) 0.01 0.1 1 10 100 1000 10 100 1000 10000 Energ y Density , Wh/k g Power Density, W/kg Supercapacitors Supercapacitors Flywheel Flywheel Fuel Cells Fuel Cells Capacitors Capacitors Pb NiCd NiMH Li-ion
Fig. 1.6 Ragone Plot: Energy Storage Characterisation
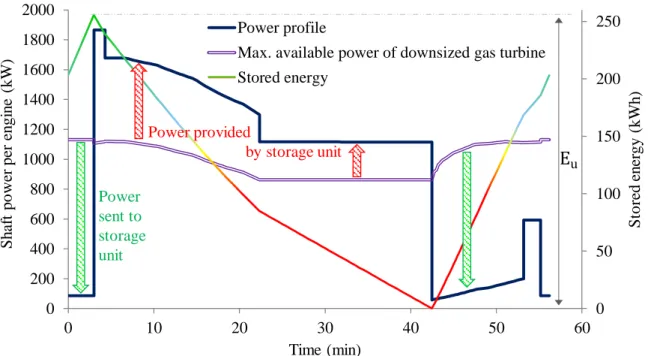
The gas turbine size reduction and the energy management strategy based on the definitions of P HPT and P HET are illustrated in Figure 1.7. Note that in this appli-cation case, the maximum power sent or received by the energy storage unit is during a recharge phase (i.e. green arrows) while usual design practices use the discharge power for sizing the energy storage unit. Nonetheless, modifying the definitions of P HPT and
presented below. 0 50 100 150 200 250 0 200 400 600 800 1000 1200 1400 1600 1800 2000 0 10 20 30 40 50 60 S to re d en er gy ( kW h ) S h af t po we r pe r en gi n e (kW ) Time (min) Power profile
Max. available power of downsized gas turbine Stored energy Power sent to storage unit Power provided by storage unit E u
Fig. 1.7 Illustration of power flows based on P HPT and P HET definitions
The two indicators are now used to characterize the power profile of different vehicles including the TP1 aircraft (Table 1.2). For cars, calculations are based on Common Artemis Driving Cycles [8] assuming a vehicle mass of 1400 kg, a reference area of 2.7 m2 (frontal area), a drag coefficient of 0.25 and a 0.028 rolling friction coefficient. The motorway profile is shown on Figure 1.8. Results for trains are extracted from the study carried out in [6]. The power profile for the local service aplication, which refers to the transportation of freight between two cities that are within 40 km from each other, is shown in Figure 1.9. Mission profiles for ships are taken from [24] and the power required is calculated assuming a proportional increase with the cube of the ship speed (Figure 1.10).
The P HPTs of the regional aircraft and container ship are very low compared to the other applications. This can be explained by the fact that their conventional propulsion systems operate at a relatively high level throughout the mission versus its maximum capability. Therefore the potential reduction in size of the main power source is small. Obviously, the longer the cruise phase, the smaller the P HPT. The time constant τsto of the regional aircraft falls into the battery category. However, the small P HET calculated for the regional aircraft also expresses a huge capacity need that might be critical for this application. Thus, based on this set of indicators, the
0 40 80 120 160 0 500 1000 sp eed (k m /h ) time (s) 0 20 40 60 80 0 500 1000 Po w er at th e w h eel s (k W ) time (s)
Fig. 1.8 ARTEMIS motorway speed profile (left) and resulting power profile (right) [8]
0 5 10 15 20 25 30 35 40 45 50 0 100 200 300 400 500 600 P(t) Time (min) Power (kW) ave
Fig. 1.9 Power profile for train – local service [6]
0 2 4 6 8 10 12 14 0 20 40 60 80 100 % of m is si o n t im e % of maximum speed 0 2 4 6 8 10 12 14 0 20 40 60 80 100 % o f m is si o n t im e % of maximum power
Fig. 1.10 Speed profile for Ro/Ro ferry [24] (left) and resulting power profile (right) implementation of hybridisation to aircraft appears as a challenging task from the energy point of view.
Car Train Ship Aircraft Urban Rural Motorway Local Switchingroad 150km/h service transportUrban Container Ro/Ro Regionalferry 200nm
P HPT (%) 94 85 74 65 83 91 43 63 33
P HET (mHz) 66 30 12 3 29 20 n/a n/a 0.22
τsto 15s 34s 1.4min 5.8min 35s 50s n/a n/a 77min
Table 1.2 Mission profile comparison
1.2.2
Energy recovering
While hybrid cars are now entering the market in increasing numbers, their interest is mainly limited to urban driving cycles characterized by its numerous stops and starts. Main savings come from the ability of the hybrid architecture to recover kinetic energy during deceleration. This section analyses potential energy savings of the TP1 aircraft through energy recovering at landing and during the descent phase.
Braking energy
In order to stop at landing an aircraft dissipates its kinetic energy through several braking systems: disc brakes, air brakes and thrust reversers. Calculating the maximum kinetic energy at landing of the TP1 aircraft using the maximum landing weight and the reference approach speed yields to 36 MJ or 0.19% of the total energy consumed during the nominal mission. Assuming a Lower Heating Value of 42.8 MJ/kg for kerosene and a gas turbine efficiency of 40%, 36 MJ is the energy that can be obtained by burning 2 kg of fuel (to be compared with the total fuel burn of Table 1.1). Also, as the landing phase lasts only few seconds, the energy recovering system should be able to withstand very high power flows leading to a heavy and complex device. Considering the small portion of energy that can be recovered and the additional complexity brought by an energy recovering system, the potential benefit of braking energy recovering will not be investigated further in this thesis.
Gravitational potential energy
With its cruise altitude of 20,000 ft the TP1 aircraft benefits from a 1,183 MJ (329 kWh) potential energy at the end of cruise (19,800 kg). That is, 6.3% of the energy consumed over the mission. Hybridisation could enable aircraft to convert gravitational potential energy during descent through windmilling propellers, store it in electric batteries, and use it during a later phase. The following study addresses this point
and tends to highlight the best energy management in descent.
Let Dac be the drag force applied to the aircraft without its propeller blades, but including nacelles and spinners. In constant-speed cruise, the thrust generated by the propulsion system exactly compensates Dac. For the purpose of this study, four different operating modes of the propellers in descent are defined:
• Folded: propeller blades are fully folded along or in the nacelles to reduce as far as possible the propeller drag in descent. The aircraft drag penalty associated to this propeller mode is assumed to be zero.
• Feathered: the blade pitch angle is increased to the point that the chord line of the blade is approximately parallel to the on-coming airflow reducing the propeller drag in comparison with uncontrolled windmilling. Still, a feathered propeller generates drag that is taken into consideration by scaling the drag coefficient of [15] with respect to the propeller diameter and the number of blades. In this propeller mode, both propellers of the TP1 aircraft are assumed to be feathered, and a drag penalty of 60 drag counts in the aircraft reference area5 is imparted
to Dac.
• Transparency: the propeller is rotating but produces neither drag nor thrust. The small amount of power required to operate this mode is taken into consideration using the propeller efficiency map (Figure 1.16) and optimizing the propeller speed as a function of flight conditions to minimize the required amount of shaft power along the curve Ct= 0 (thrust coefficient Ct defined in Equation E.6). No drag component is added to Dac as for the folded mode.
• Wind turbine: the aircraft recovers some energy during the descent. The ad-ditional drag is defined proportionally to Dac through the energy recovering coefficient k. The total aircraft drag is therefore (1 + k)Dac. The shaft power extracted from the windmilling propellers is calculated using the actuator disk theory [111], hence neglecting friction losses and blade tip losses.
Figure 1.11 illustrates the effect of the different propeller modes on the aircraft flight path. The distance covered in folded mode was chosen as the reference distance to destination from cruise altitude. Note that under the assumptions of this study, the transparency mode involves the same flight path as the folded mode. The feathered mode and the wind turbine propeller mode require a steeper descent slope due to the additional drag. As a consequence the distance covered in descent is less than
5i.e. the drag force1/2ρS
the reference and the cruise flight must be extended to reach the destination. The comparison between propeller operating modes is performed at iso-time-to-descent which explains why the descent speeds are different. Nevertheless, the cruise part is flown at the design speed.
0 2000 4000 6000 0 10000 20000 30000 40000 50000 60000 70000 80000 Alti tude ( m) Distance (m) wind turbine (k=0.5) feathered folded M0.45 210 kCAS 171 kCAS 194 kCAS
Fig. 1.11 Trajectory comparison for 10 min descent time
This study aims to compare the onboard energy consumption of the aircraft in descent depending on the propeller operating mode and the descent time. In this analysis the following assumptions are considered:
• The aircraft weight is supposed to be constant and equal to 19,800 kg during the descent.
• Five different descent times are considered ranging from 16 min to 5 min. • The distance covered in folded mode for the 16 min descent time is chosen as the
reference range to destination as the descent speed for this case approaches the speed of best lift-to-drag ratio.
• Descent speeds are adjusted to match the required descent time while the cruise speed is fixed to Mach 0.45.
• For the wind turbine mode, coefficient k was varied from 0.1 to 3.0 with a 0.1 step for each descent time as far as the stall speed was not reached. In the results (Figures 1.13, 1.14 and 1.15) only the case providing the minimum overall energy
consumption is depicted.
• The energy consumption of non-propulsive systems is taken into account through-out the range to be covered by assuming a constant power consumption Psys of 140 kW.
To go even further, additional assumptions are made on the efficiency of the power generation system depending on the flight segment:
• If the additional cruise segment is performed with a gas turbine type system, its efficiency is set to 40% which applies between the energy source and the propeller shaft but also between the energy source and the non-propulsive systems. For the descent segment, an efficiency of 10% is considered for this type of system to account for the low efficiency of gas turbines in idle (Section 1.3.2).
• If an electrical power generation system is used in place of the thermal system for the additional cruise and/or the descent a 90% efficiency is considered. The power flows and possible efficiency combinations are illustrated in Figure 1.12.
𝑃𝑠ℎ𝑎𝑓𝑡
Onboard Energy Source
Power generation - Electric: 𝜂 = 90% - Thermal: 𝜂 = 40% 𝑃𝑠𝑦𝑠 𝜂 = 90% 𝑃𝑠ℎ𝑎𝑓𝑡 Power generation - Electric: 𝜂 = 90% - Thermal: 𝜂 = 10% 𝑃𝑠𝑦𝑠 (2) (2)
(1): transparency mode only (2): wind turbine mode only
(1)
Onboard Energy Source
Fig. 1.12 Possible power flows for cruise segment (left) and descent (right) A short Scilab [35] script was developed for the purpose of solving the equations of flight mechanics in descent and evaluating the energy consumption. The aerodynamic forces acting on the aircraft featuring no propeller blades have been calculated from the drag polar of the TP1 aircraft provided by OCCAM (Section 1.1) and corrected according to the different propeller operating modes. Results of this trade study are depicted on Figures 1.13, 1.14 and 1.15. The onboard energy consumption is represented as a percentage of the gravitational potential energy between cruise altitude and 1,500ft (i.e. 1,093 MJ).
The energy management strategy of the TP1 aircraft can be analysed through the 10 minutes descent and the transparency mode of Figure 1.13. The propeller does not operate in a transparency mode in reality but the average thrust along the descent approaches zero. It can be shown that going to the feather mode would reduce the energy consumption by 20% for the same descent time. Of course this may entail a complex modification of the engine architecture as the mechanical off-takes have to be provided even if the propeller gearbox output shaft is stopped.
38% 38% 38% 54% 54% 54% 77% 77% 77% 100% 100% 100% 123% 123% 123% 169% 157% 157% 131% 117% 117% 84% 66% 66% 49% 26% 26% 31% 79% 69% 59% 55% 55% feathered transparency folded feathered transparency folded feathered transparency folded feathered transparency folded feathered transparency folded
non-prop. syst. - cruise non-prop. syst. - descent propulsion - cruise propulsion - descent propeller
mode
descent
time (ref.=1093MJ) Total
123% 178% 156% 126% 181% 150% 143% 202% 162% 170% 240% 186% 196% 274% 208% TP1 aircraft 16 min 13 min 10 min 7 min 5 min
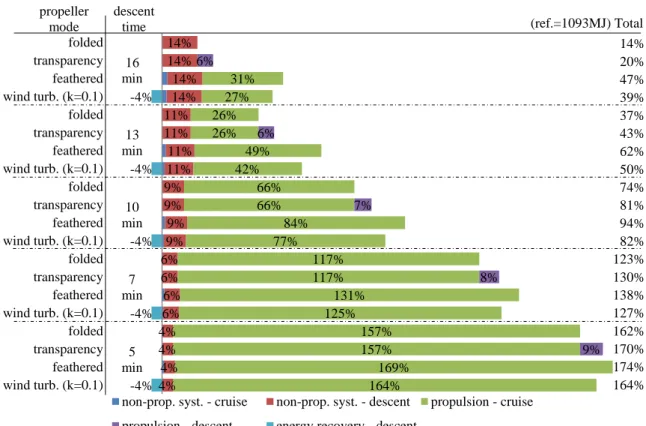
Fig. 1.13 Comparison of onboard energy consumption for full thermal power generation system – Cruise: Thermal / Descent: Thermal
4% 4% 4% 4% 6% 6% 6% 6% 9% 9% 9% 9% 11% 11% 11% 11% 14% 14% 14% 14% 164% 169% 157% 157% 125% 131% 117% 117% 77% 84% 66% 66% 42% 49% 26% 26% 27% 31% 9% 8% 7% 6% 6% -4% -4% -4% -4% -4% wind turb. (k=0.1) feathered transparency folded wind turb. (k=0.1) feathered transparency folded wind turb. (k=0.1) feathered transparency folded wind turb. (k=0.1) feathered transparency folded wind turb. (k=0.1) feathered transparency folded
non-prop. syst. - cruise non-prop. syst. - descent propulsion - cruise propulsion - descent energy recovery - descent
propeller mode
descent
time (ref.=1093MJ) Total
14% 20% 47% 39% 37% 43% 62% 50% 74% 81% 94% 82% 123% 130% 138% 127% 162% 170% 174% 164% 16 min 13 min 10 min 7 min 5 min
Fig. 1.14 Comparison of onboard energy consumption for hybrid power generation system – Cruise: Thermal / Descent: Electric
4% 4% 4% 4% 6% 6% 6% 6% 9% 9% 9% 9% 11% 11% 11% 11% 14% 14% 14% 14% 81% 75% 70% 70% 55% 58% 52% 52% 34% 37% 29% 29% 19% 22% 12% 12% 12% 14% 9% 8% 7% 6% 6% -15% -4% -4% -4% -4% wind turb. (k=0.5) feathered transparency folded wind turb. (k=0.1) feathered transparency folded wind turb. (k=0.1) feathered transparency folded wind turb. (k=0.1) feathered transparency folded wind turb. (k=0.1) feathered transparency folded
non-prop. syst. - cruise non-prop. syst. - descent propulsion - cruise propulsion - descent energy recovery - descent
propeller mode
descent
time (ref.=1093MJ) Total
14% 20% 28% 23% 23% 29% 34% 26% 38% 44% 47% 39% 58% 66% 65% 58% 74% 83% 80% 72% 16 min 13 min 10 min 7 min 5 min
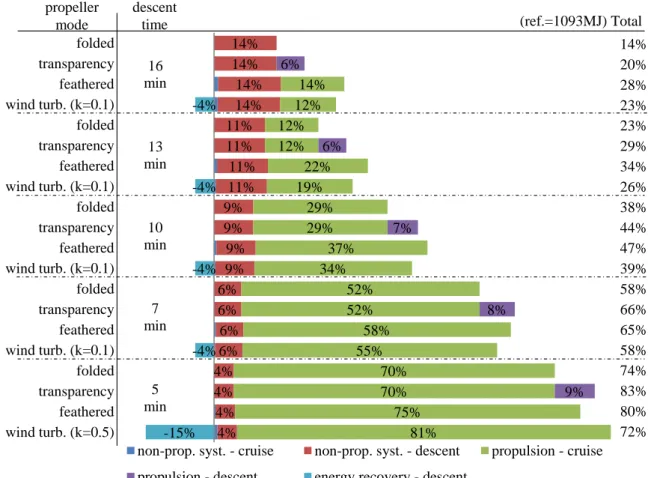
Fig. 1.15 Comparison of onboard energy consumption for full electrical generation system – Cruise: Electric / Descent: Electric
The hybrid power generation system (Figure 1.14) brings significant reduction in overall energy consumption versus the full thermal system thanks to its high efficiency in descent. In particular, an 8.8 ratio in energy consumption can be shown between most energy efficient cases (i.e 123% for full thermal versus 14% for hybrid). Contrary to the full thermal power generation it is better to perform the descent in transparency mode rather that in feather mode: the energy cost for keeping the propellers rotating is much less than the energy required to fly the additional cruise segment when feathered propellers are used. As energy recovering is now assumed possible with this system, it can be noted that the lowest overall energy consumption with the wind turbine mode is performed with a 4% recovery of the gravitational potential energy only. Still, the transparency and folded modes are always more energy efficient than the wind turbine mode for descent time longer than 10 minutes. Note that the descent time is generally constrained by cabin repressurization limits and will likely never be shorter than 7 minutes in normal operation. If the folded mode cannot be implemented because of
the complexity of designing a folding variable-pitch propeller, then the most energy efficient operation of this hybrid configuration is reached in transparency mode with a 16 min descent time (20% of reference energy consumed). This result is to be compared with the most energy efficient operation of the conventional aircraft (Figure 1.13) with unfolded propellers, consuming 150% of the reference energy in feathered mode for a 13 min descent time.
For the full electrical power generation system, the overall energy consumption with the wind turbine mode is generally better than the transparency mode as the energy cost for additional cruise is much less than with the previous hybrid system. The recovered energy also participates in lowering this cost even further. Nonetheless, the most efficient case in transparency mode (16 min) to cover the reference distance is still better than the most efficient case in wind turbine mode (16 min also).
This first analysis based on efficiency considerations shows that if possible, propellers should be folded during the descent whatever the power generation system. Also, the use of a hybrid power generation system could largely help reducing the energy consumption in descent (-60% for 10 min descent time, up to -130% for 16 min descent time versus full thermal power generation). With the high efficiency of such system in descent, the propeller (if not folded) should be operated in transparency mode rather than being feathered or being used as wind turbines for descent in normal operation. Finally, energy recovering through windmilling propellers is definitely not the most energy efficient way to use the gravitational potential energy of the aircraft if there is no constraint on the descent time: the aircraft should descend at the speed of best lift over drag with the propellers folded or operated in transparency mode.
Let us recall that this study assumed a constant aircraft weight, whatever the power generation system considered. Weight penalties imparted by new systems, in particular for the full electric one, will highly influence these results. This pointed out the importance of considering the overall aircraft design in energy management trade studies. Moreover, this study highlights the strong influence of the trajectory on the aircraft energy consumption.
1.3
Power management and efficiency
Tackling the problem of low efficiency in certain phases of the mission should lead to immediate fuel savings. This section focuses on propeller and gas turbine efficiency of the TP1 aircraft.
1.3.1
Propeller efficiency
Current turboprop aircraft are fitted with constant-speed propellers meaning that the propeller rotates at a specific speed during each phase of flight. Three different propeller speeds are usually defined, each of them being associated to take-off, cruise and idle operations, respectively. A hydraulic propeller pitch changing mechanism adjusts the blade pitch to keep the propeller rpm to the required value. The idle speed is generally never under 60% of the maximum propeller speed Np due to the minimum frequency required by non-propulsive systems and other hydraulic power generation equipment connected to the gearbox. The propeller efficiency map of the TP1 aircraft shown in Figure 1.16 is derived from a typical efficiency map of [125] and rescaled according to the number of blades. The advance ratio J, power coefficient Cp, thrust coefficient Ct and propeller efficiency η are defined in Equations E.6, E.7, E.8 and 1.12, respectively. In these equations, V is the aircraft speed, ρ the air density,
D the propeller diameter, n the number of rotation per seconde of the propeller, P
the propeller shaft power and T the propeller thrust. More details about propeller modelling can also be found out in Appendix E.
J= V nD (1.9) Cp= P ρn3D5 (1.10) Ct= T ρn2D4 (1.11) η= JCt Cp (1.12)
The propeller efficiency of the TP1 aircraft is analysed using the operating points indicated in Table 1.3. The red dots of Figure 1.16 locate the propeller operating points in these conditions. To place them, an optimisation was performed in order to maximize the propeller efficiency by varying the propeller speed between 60% Np and 100% Np and the blade pitch angle to reach the given propeller thrust. The optimisation results are summarised in Table 1.4.
One can notice that three speed levels could be defined for the conventional use of the propeller (i.e. red dots): 100% Np for TO and CL, 83% Np for CR and 60%
Np for idle phases. Also, the propeller efficiencies in climb and in cruise are very good while the efficiency in taxi is almost three times less. TX-2p refers to taxiing with two propellers while TX-1p refers to the single propeller taxi case. Performing the
0.0 0.2 0.4 0.6 0.8 1.0 0.0 0.5 1.0 1.5 2.0 2.5 3.0 Cp J Propeller operating points Taxi - no min. rpm Ct = 0 CR CL TO TX-1p TX-2p
Fig. 1.16 Propeller performance map of the TP1 aircraft derived from [125] – Solid
lines are constant blade pitch angle lines
Phase Code Altitude (ft) Mach Thrust (N) Taxi TX 0 0.02 4,021 Take-off TO 1,500 0.18 46,000
Climb CL 10,000 0.31 25,300 Cruise CR 20,000 0.45 13,900 Descent DSC 10,000 0.39 -300 Table 1.3 TP1 total thrust on nominal mission
taxi using one propeller instead of two slightly increases the efficiency from 31% to 35%. The main advantage of single propeller taxi on current aircraft is mainly due to the poor efficiency of the gas turbine in idle and only incidentally to the increase of propeller efficiency as shown in the next section. For both taxi cases the propeller rpm was driven by the optimizer to the lower bound 60% Np. Using hybrid-electric systems during taxi should enable to release this minimum speed constraint.
A new set of calculations have been done for the taxi cases by removing the lower bound on propeller rpm. The new propeller efficiencies are located by the green dots in Figure 1.16. Enabling the propeller to rotate slower than 60% Np increases the
Code (% NSpeed Pitch Efficiency p) (°) (%) TO 100 26 78 CL 100 31 90 CR 83 26 91 TX-2p (red) 60 3 31 TX-1p (red) 60 7 35 TX-2p (green) 33 14 52 TX-1p (green) 46 13 41
Table 1.4 Propeller speed and blade pitch angle for optimum operation
propeller efficiency by at least 7% for single propeller taxiing (41% efficiency). It is also noticeable that the propeller efficiency is now higher when the thrust for taxi is equally shared between the propellers as it reaches 52%.
Changing the blade pitch angle of the TP1 aircraft propeller allows varying the propeller rotation speed so as to meet the highest possible efficiency under given flight conditions. Since the propeller speed is tied to that of the output shaft of the gas turbine through a fixed ratio gearbox, the propulsion chain efficiency is a compromise between propeller and gas turbine efficiency that is analysed in the next section. Nonetheless, the use of hybrid-electric systems to lower the minimum propeller speed should help improving the propeller efficiency in taxi.
1.3.2
Engine operating point
The single spool engine (Figure 1.17) is the simplest gas turbine that can be used for driving a load. In this configuration both the engine compressor and the load are driven by the turbine. Since the engine cannot operate if the load speed is zero, the output torque at zero output speed, also referred to as stall torque, is zero. Also, very little torque is available at low output speed. For this reason, this architecture is almost solely employed for power generation where the shaft must rotate at synchronous speed irrespective of power level.
For vehicle propulsion, the free power turbine engine (Figure 1.18) is preferred. Here the load is driven by a free power turbine separate from that driving the engine compressor. The compressor and turbine combination that provides the hot, high pressure gas that enters the free power turbine is generally referred to as gas generator. Unlike the single spool engine the stall torque is around 2 times that at full power and 100% speed. At part load, the compressor efficiency remains higher than for a single
Fig. 1.17 Single spool shaft power engine [138] – shown with cold end drive spool turboshaft since the gas generator speed is not tied to that of the load. For a given power or gas generator speed the power turbine speed may vary over a wide range, depending on the absorption characteristics of the driven load. Figure 1.19a illustrates the variation of Specific Fuel Consumption6 (SFC) versus the shaft output power and
power turbine speed. Note that this efficiency map has been built by using referred parameters [138] which allows us to use it independently of flight conditions. There also exist free power turbine engines with multi spool gas generators [55] resulting in different compressor designs. However, the variation of SFC is basically similar to that for a single spool free power turbine engine.
Fig. 1.18 Free power turbine engine [138] – shown with hot end drive
0 10 20 30 40 50 60 70 80 90 100 110 0 20 40 60 80 100 Engine output power (%)
Power turbine speed (%) SFC = fuel flow/output power (% of design)
Maximum limiting output power Cube law 100 103 105 110 120 130 150 200 400 CR CL TX-1p TO
(a) Effect of power turbine speed on turboshaft SFC [138]
50 100 150 200 250 300 350 400 0 20 40 60 80 100 SFC (% of desig n ) Output power (%) 0
(b) SFC variation for cube law opera-tion
![Fig. 1.1 Regional Jet and Turboprop cumulative trip distribution versus mission range [9]](https://thumb-eu.123doks.com/thumbv2/123doknet/2992246.83623/23.892.238.673.496.752/fig-regional-turboprop-cumulative-distribution-versus-mission-range.webp)
![Fig. 1.4 Two power profiles and associated values for P HP A [5]](https://thumb-eu.123doks.com/thumbv2/123doknet/2992246.83623/26.892.113.753.173.365/fig-power-profiles-associated-values-p-hp.webp)
![Fig. 1.5 Two power profiles with same P HP A but different values for E u [5]](https://thumb-eu.123doks.com/thumbv2/123doknet/2992246.83623/27.892.137.775.165.520/fig-power-profiles-p-hp-different-values-e.webp)
![Fig. 1.9 Power profile for train – local service [6]](https://thumb-eu.123doks.com/thumbv2/123doknet/2992246.83623/31.892.166.749.420.886/fig-power-profile-train-local-service.webp)
![Fig. 1.16 Propeller performance map of the TP1 aircraft derived from [125] – Solid](https://thumb-eu.123doks.com/thumbv2/123doknet/2992246.83623/40.892.112.761.159.569/fig-propeller-performance-map-tp-aircraft-derived-solid.webp)
![Fig. 1.18 Free power turbine engine [138] – shown with hot end drive](https://thumb-eu.123doks.com/thumbv2/123doknet/2992246.83623/42.892.145.734.716.986/fig-free-power-turbine-engine-shown-hot-drive.webp)